

Abstract
Background
Masked hypertension (MHT) and prehypertension (PHT) are both associated with an increase in cardiovascular disease (CVD) risk, relative to sustained normotension. This study examined the diagnostic overlap between MHT and PHT, and their interrelationships with left ventricular (LV) mass index (LVMI), a marker of cardiovascular end-organ damage.
Methods
A research nurse performed three manual clinic blood pressure (CBP) measurements on three occasions over a 3-week period (total of nine readings, which were averaged) in 813 participants without treated hypertension from the Masked Hypertension Study, an ongoing worksite-based, population study. Twenty-four-hour ambulatory blood pressure (ABP) was assessed by using a SpaceLabs 90207 monitor. LVMI was determined by echocardiography in 784 (96.4%) participants.
Results
Of the 813 participants, 769 (94.6%) had normal CBP levels (<140/90 mm Hg). One hundred and seventeen (15.2%) participants with normal CBP had MHT (normal CBP and mean awake ABP ≥135/85 mm Hg) and 287 (37.3%) had PHT (mean CBP 120–139/80–89 mm Hg). 83.8% of MHT participants had PHT and 34.1% of PHT participants had MHT. MHT was infrequent (3.9%) when CBP was optimal (<120/80 mm Hg). After adjusting for age, gender, body mass index (BMI), race/ethnicity, history of high cholesterol, history of diabetes, current smoking, family history of hypertension, and physical activity, compared with optimal CBP with MHT participants, LVMI was significantly greater in PHT without MHT participants and in PHT with MHT participants.
Conclusions
In this community sample, there was substantial diagnostic overlap between MHT and PHT. The diagnosis of MHT using an ABP monitor may not be warranted for individuals with optimal CBP.
Keywords: ambulatory blood pressure monitoring, blood pressure, echocardiography, hypertension
In 2002, Dr Thomas Pickering and our group introduced the term masked hypertension (MHT)1 to describe individuals with normal clinic blood pressure (CBP) levels (<140/90 mm Hg) and ambulatory hypertension (awake ≥135/85 mm Hg). MHT is associated with increased left ventricular (LV) mass,2 a marker of cardiovascular end-organ damage, and an increased risk of cardiovascular disease (CVD) events, that is significantly more than in sustained normotension (clinic and ambulatory normotension).3,4,5,6,7 The confluence of increased CVD risk, a failure to be diagnosed by the conventional approach of blood pressure measurement in the clinic setting, and relatively high prevalence8,9,10,11 makes MHT a public health concern.
Epidemiologic studies have shown that CBP in the prehypertension (PHT) range (i.e., mean systolic blood pressure (SBP) 120–139 mm Hg or mean diastolic blood pressure (DBP) 80–89 mm Hg) confer an increased CVD risk.12 PHT is associated with higher levels of LV mass13 and also a higher risk of CVD events,12 compared to optimal blood pressure levels (<120/80 mm Hg).
Recent evidence suggests that CBP levels are significantly higher among individuals with MHT compared to individuals with sustained normotension,9 despite both groups having CBP levels in the normal range (<140/90 mm Hg). These findings suggest that the prevalence of PHT may be disproportionally higher in MHT than in sustained normotension, or alternatively that the prevalence of MHT may be higher in PHT than in those with optimal CBP. These hypotheses have not been directly examined in previous studies, particularly when out-of-office blood pressure is determined by an ambulatory blood pressure (ABP) monitoring. Furthermore, the relative contributions of MHT and PHT to CVD risk are also unclear. The primary aim of this study was to evaluate the degree of diagnostic overlap between MHT and PHT in a large community sample, and to secondarily investigate their interrelations with LV mass, a marker of cardiovascular end-organ damage.
Methods
Study population. The Masked Hypertension Study, an ongoing population-based study of the prevalence, predictors, and prognosis of MHT, is comprised of employees recruited from Stony Brook University, University Hospital at Stony Brook, Columbia University Medical Center, and a private hedge fund management organization in New York. The current analysis includes 813 participants, enrolled between February 2005 and August 2010; 2,381 were screened during this period. Participants were excluded if they were <18 years of age (n = 176); taking antihypertensive or other medications that are known to affect blood pressure (n = 431); had a history of CVD or major arrhythmias including atrial fibrillation (n = 17); had evidence of secondary hypertension other than a history of pregnancy-induced hypertension, chronic renal failure (creatinine >1.6 mg/dl), liver disease, adrenal disease, or thyroid disease (n = 28); had a screening clinic SBP >160 mm Hg or DBP >105 mm Hg (n = 18); pregnant (n = 13); working <20 h a week (n = 32); non-English speaking (n = 5); had active substance abuse or a severe debilitating psychiatric disorder (n = 7); or were not interested (n = 508), not available (n = 52), or dropped out before starting the study (n = 118). For our analysis, another 163 participants were excluded due to pending study visits or had dropped out during the study, resulting in available data from 813 participants. The blood pressure eligibility criterion for this study was chosen to obtain a sample with a wide distribution of untreated blood pressures. For safety reasons, we referred participants immediately to their physicians for further management if their screening CBP was >160/105 mm Hg. Information about demographics, cardiovascular risk factors, and family history of hypertension were ascertained from participant interview. Written informed consent was obtained from all subjects. The study was approved by the Institutional Review Boards of Columbia University and Stony Brook University.
Study procedures. Participants attended five visits over a 4-week period. During the first 3 visits (visit 1–3), which occurred during a 3-week period, the participant was escorted into an examination room and asked to rest in the seated position for at least 5 min, after which a research nurse/technician obtained three CBP readings at 2-min intervals using a mercury sphygmomanometer and stethoscope.14 Arm circumference was measured, and appropriate-sized cuffs were utilized for blood pressure assessment.14 Thus, a total of nine CBP readings were available for each participant. On visit 3, the participant was fitted with an appropriate-sized arm cuff for a Spacelabs ABP monitor (ABPM) (Model 90207; Spacelabs, Redmond, WA). ABP measurements were taken at 28-min intervals throughout the subsequent 24-h monitoring period. The recording was analyzed to obtain average awake and sleep SBP and DBP levels, based on sleep and awake times defined by data obtained from an actigraphy monitor worn on the wrist (ActiWatch; Phillips Respironics, Murrayville, PA), supplemented by diary reports of the times subjects woke up and went to sleep. During the awake period, participants wore a second actigraphy monitor on the waist (Actical; Phillips Respironics) to determine the level of physical activity.15
At visit 5, fasting blood samples were drawn from participants for determining total cholesterol, triglycerides, and high-density lipoprotein cholesterol concentrations. The Friedewald equation was used to calculate low-density lipoprotein cholesterol. M-mode, and two-dimensional echocardiograms were also performed and stored in a DICOM digital format for off-line analysis. Echocardiographers blinded to patients' clinical characteristics and blood pressure levels performed LV measurements (LVIDd, LV internal diameter during diastole; IVSd, interventricular septal thickness during diastole; and PWTd, posterior wall thickness during diastole), according to the recommendations of the American Society of Echocardiography.16 LV mass was calculated using the corrected American Society of Echocardiography method: 0.8 × (1.04 × ((IVSd + LVIDd + PWTd)3 – LVIDd3)) + 0.6. LV mass index (LVMI) was calculated by dividing LV mass by estimated body surface area. Of the 813 participants, 784 (96.4%) underwent the echocardiography examination and had images of sufficient quality for LVMI determination. Compared to participants with available LVMI data (N = 784), participants without available LVMI data (N = 29) were younger (39.8 ± 11.6 years vs. 45.3 ± 10.3 years, P < 0.01) and had a greater body mass index (BMI) (36.6 ± 3.7 years vs. 27.5 ± 5.3 kg/m2, P < 0.01). There were no group differences in gender (P = 0.46), race (P = 0.40), and ethnicity (P = 0.97).
Hypertension categories defined by CBP and ABP. For the primary analysis, the nine CBP readings were used to estimate mean CBP. Clinic hypertension was defined as a mean SBP ≥140 mm Hg or mean DBP ≥90 mm Hg. Ambulatory hypertension, based on mean awake ABP, was defined as mean SBP ≥135 mm Hg or mean DBP ≥85 mm Hg.14 Participants without clinic hypertension were categorized either as having PHT, defined by mean SBP 120–139 mm Hg or mean DBP 80–89 mm Hg, or as having optimal blood pressure levels, defined by mean SBP <120 mm Hg and mean DBP <80 mm Hg.17 MHT was defined as having clinic normotension and ambulatory hypertension. Sustained hypertension was defined as having both clinic and ambulatory hypertension. Sustained normotension was defined by having both normal CBP and ABP levels. White coat hypertension was defined as having clinic hypertension without ambulatory hypertension.
The participants in whom LVMI was assessed were divided into three groups: optimal CBP and normal awake ABP, MHT, and/or PHT, and sustained hypertension. Participants in the MHT and/or PHT group were further divided into three subgroups: optimal CBP with MHT (mean CBP levels in the optimal range with ambulatory hypertension), PHT without MHT (i.e., mean CBP levels in the PHT range and ambulatory normotension), and PHT with MHT (mean CBP levels in the PHT range and ambulatory hypertension).
Statistical analyses. Results are expressed as numbers, percentages, mean ± s.d., and/or adjusted mean ± s.e. The number and percentage of clinic normotensive participants with PHT and MHT was determined as was the prevalence of PHT in participants with sustained normotension. To address the secondary aim of the study, one-way analysis of variance was first used to assess group differences in LVMI. Participants with white coat hypertension were excluded from these analyses. Analysis of covariance was also used to evaluate LVMI differences after adjusting for age, gender, BMI, race (African American or not), and ethnicity (Hispanic or not) (model 1). A second multivariable model (model 2) was estimated that additionally controlled for self-reported history of high cholesterol (diagnosed by a physician), self-reported history of diabetes (diagnosed by a physician), current smoking status, family history of hypertension (including 1st degree relatives and/or grandparents), and physical activity (determined by the Actical monitor). Since most studies assess CBP at only one visit, we performed sensitivity analyses in which the three CBP readings from visit 1 were used to estimate mean CBP levels. Statistical analyses were performed using SPSS v.18.0 (SPSS, Chicago, IL).
Results
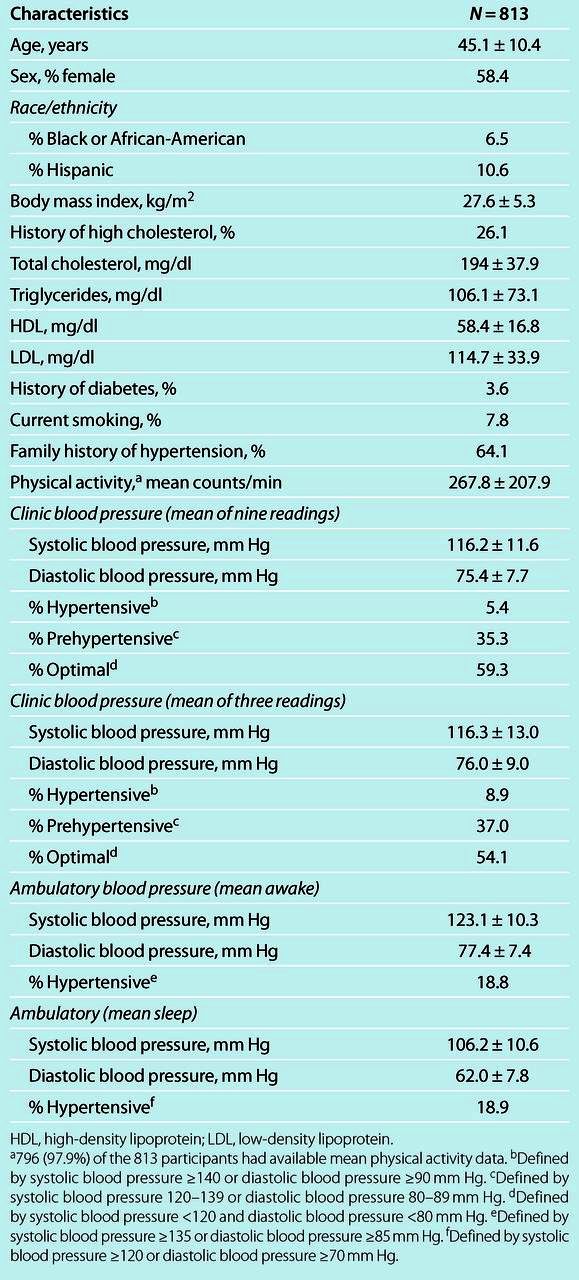
Table 1 shows the characteristics of the 813 study participants. Of the 44 participants with clinic hypertension based on the mean of 9 CBP readings, 36 (81.8%) had sustained hypertension and 8 (18.2%) had white coat hypertension. For both systolic and diastolic BP, CBP was significantly lower than awake ABP (P < 0.001).
Table 1.
Characteristics of the masked hypertension study participants
Diagnostic overlap between MHT and PHT in participants with normal CBP levels
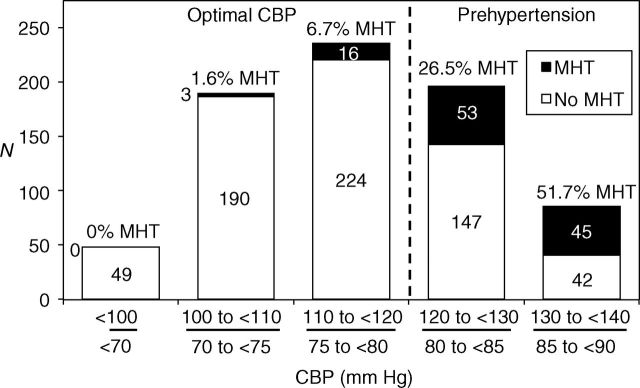
Based on the mean of nine CBP readings, the correlation coefficients between CBP and awake ABP were 0.75 (P < 0.001) and 0.64 (P < 0.001) for SBP and DBP, respectively. Of the 769 participants with normal CBP levels, 652 (84.8%) had sustained normotension and 117 (15.2%) had MHT; 287 (37.3%) had PHT. 98 participants had both MHT and PHT, constituting 83.8% (98/117) of those with MHT, and 34.1% (98/287) of those with PHT (Figure 1). The prevalence of PHT was higher among those with MHT (83.8%) than among those with sustained normotension (29.0% = 189/652). Figure 2 shows the number and proportion with MHT by categories of normal CBP. The prevalence of MHT was higher in participants with CBP in the PHT range (34.1%) compared to those with optimal CBP (3.9%). Although the number of participants with MHT was greater in the lower half of the PHT range (53 participants in the lower half vs. 45 participants in the upper half), the proportional risk of MHT was higher in the upper half of the PHT range (51.7% in the upper half vs. 26.5% in the lower half).
Figure 1. Diagnostic overlap between masked hypertension and prehypertension based on the mean of nine clinic blood pressure readings. Circle with solid line represent participants with masked hypertension. Circle with dotted line represent the participants with prehypertension. Of the 769 participants with normal clinic blood pressure, a total of 117 participants had masked hypertension and 287 participants had prehypertension. 98 participants had both masked hypertension (MHT) and prehypertension (PHT), constituting 83.8% (98/117) of those with MHT, and 34.1% (98/287) of those with PHT.

Figure 2. Distribution of masked hypertension across clinic blood pressure categories in the normal range (<140/90 mm Hg) based on the mean of nine readings. Clinic blood pressure levels in the normal range were categorized as follows: mean SBP ≥130 mm Hg or mean DBP ≥85 mm Hg (with mean SBP <140 mm Hg and mean DBP <90 mm Hg); mean SBP ≥120 mm Hg or mean DBP ≥80 mm Hg (with mean SBP <130 mm Hg and mean DBP <85 mm Hg); mean SBP ≥110 mm Hg or mean DBP ≥75 mm Hg (with mean SBP <120 mm Hg and mean DBP <80 mm Hg); mean SBP ≥100 mm Hg or mean DBP ≥70 mm Hg (with mean SBP <110 mm Hg and mean DBP <75 mm Hg); and mean SBP <100 mm Hg and mean DBP <70 mm Hg. Of the 769 participants with normal clinic blood pressure, a total of 287 participants had prehypertension and 482 had optimal clinic blood pressure levels. The risk of masked hypertension was disproportionally concentrated among those participants with prehypertension. CBP, clinic blood pressure; DBP, diastolic blood pressure; MHT, masked hypertension; SBP, systolic blood pressure.
Differences in LVMI across blood pressure groups
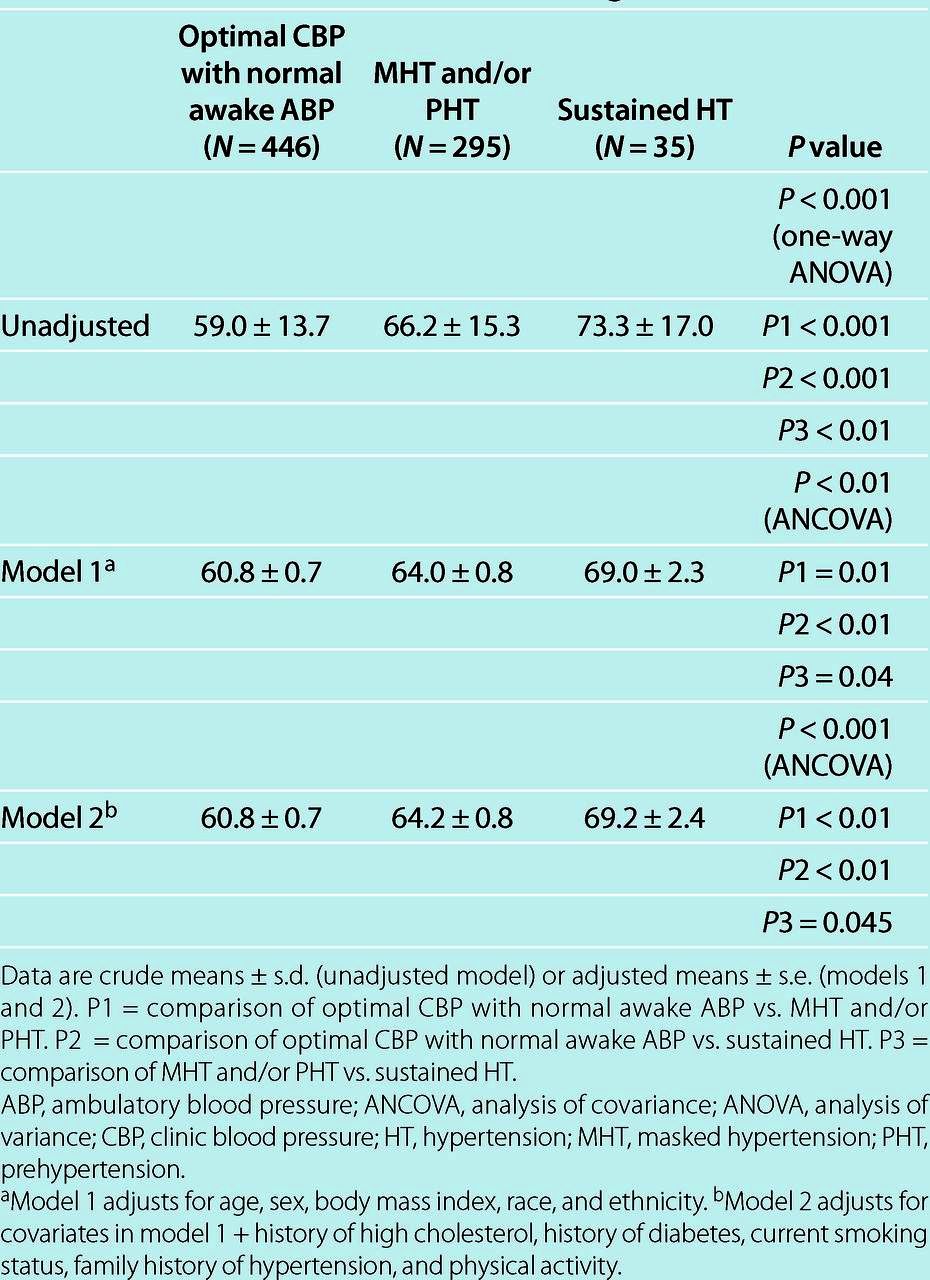
Based on the mean of 9 CBP readings, 446 participants had optimal CBP and normal awake ABP, 295 had MHT and/or PHT, and 35 had sustained hypertension. Group differences were seen in age, gender, Hispanic ethnicity, BMI, history of high cholesterol, total cholesterol, triglycerides, high-density lipoprotein, low-density lipoprotein, CBP, and awake and sleep ABP (see Supplementary Table S1 online). There were significant differences in LVMI across the three groups (Table 2, one-way analysis of variance, P < 0.001). Compared to participants with optimal CBP and normal awake ABP, LVMI was significantly greater in participants with MHT and/or PHT (P < 0.001) and in participants with sustained hypertension (P < 0.001). LVMI was also significantly greater in sustained hypertension participants compared to those with MHT and/or PHT (P < 0.01). These differences remained significant in adjusted models (models 1 and 2, Table 2).
Table 2.
Left ventricular mass index in participants with optimal CBP with normal awake ABP, MHT, and/or PHT, and sustained HT based on the mean of nine CBP readings
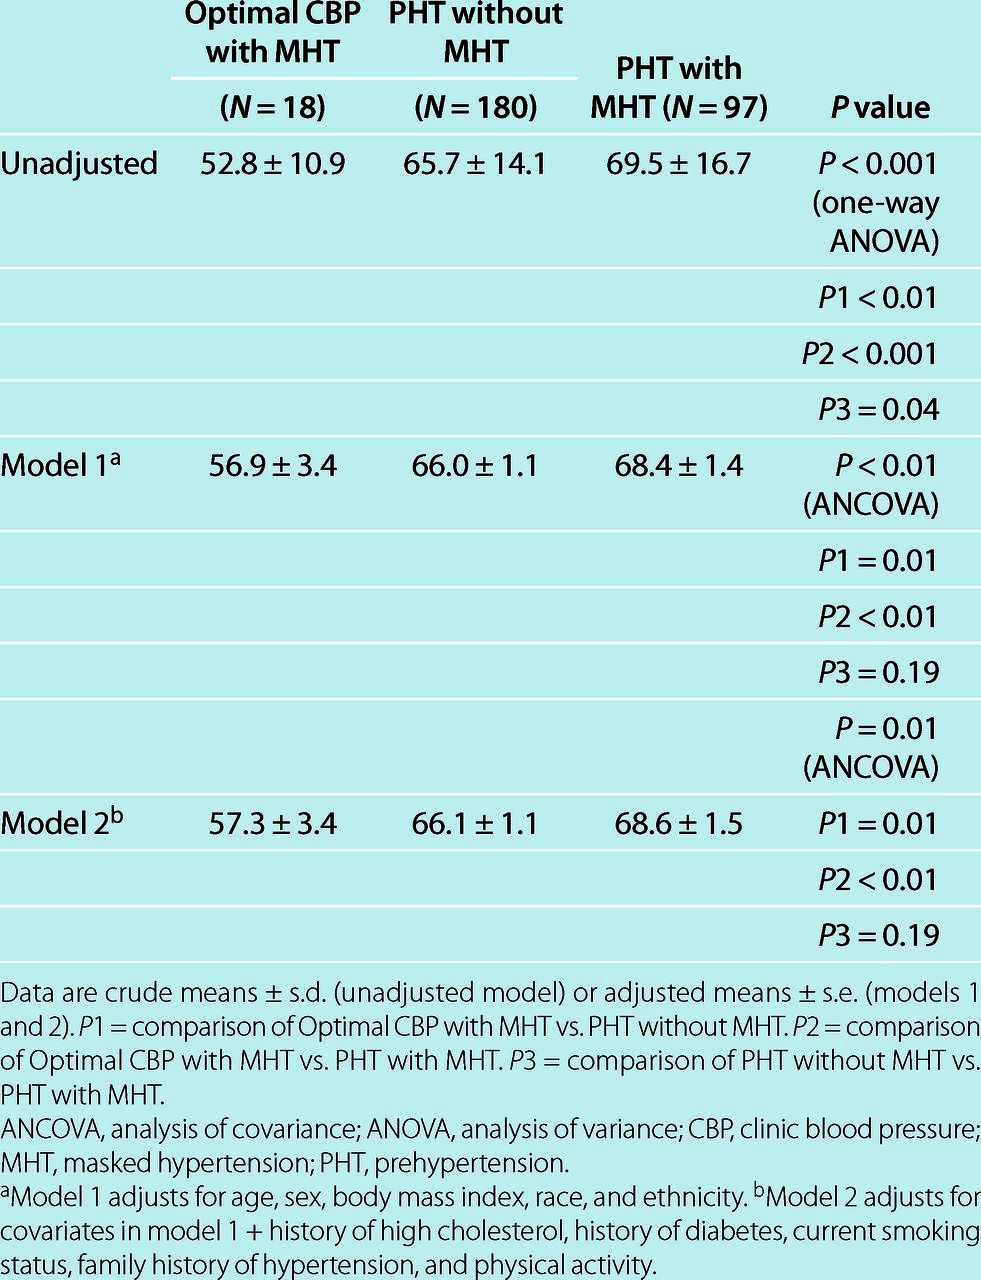
Of the 295 participants in the MHT and/or PHT group, 18 participants had optimal CBP with MHT, 180 had PHT without MHT, and 97 had PHT with MHT. Differences in gender, BMI, CBP, and awake and sleep ABP were seen across these subgroups (Table 3). There were significant group differences in LVMI (Table 4, one-way analysis of variance, P < 0.001). Compared with optimal CBP with MHT participants, LVMI was significantly greater in PHT without MHT participants (P < 0.01) and in PHT with MHT participants (P < 0.001). LVMI was also significantly greater in PHT with MHT participants compared to PHT without MHT participants (P = 0.04). After adjustment for age, gender, BMI, race and ethnicity (model 1, Table 4), there was no longer a significant difference in LVMI between participants with PHT without MHT and PHT with MHT (P = 0.19). All other group differences remained significant. Results were similar after adjustment for additional covariates (model 2, Table 4).
Table 3.
Characteristics of participants who underwent echocardiographic assessment of left ventricular mass index and were classified as having optimal CBP with MHT, PHT without MHT, and PHT with MHT based on the mean of nine CBP readings
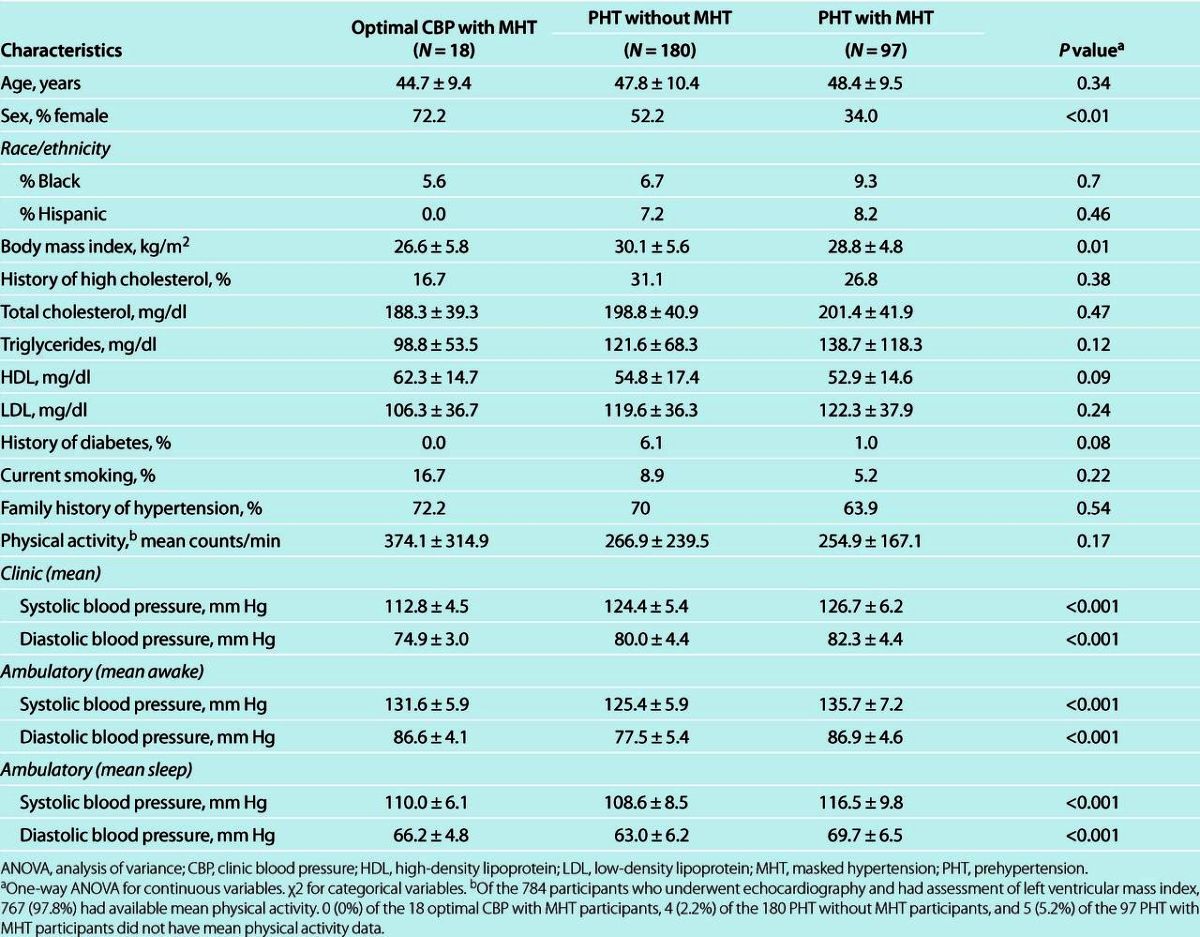
Table 4.
Left ventricular mass index in participants with optimal CBP with MHT, PHT without MHT, and PHT with MHT based on the mean of nine CBP readings
Sensitivity analyses
The pattern of results was similar when mean CBP was estimated from three readings. Of the 72 participants with clinic hypertension based on the mean of three CBP readings, 50 (69.4%) had sustained hypertension and 22 (30.6%) had white coat hypertension. For both systolic and diastolic BP, CBP was significantly lower than awake ABP (P < 0.001). Of the 741 participants with normal CBP levels, 638 (86.1%) had sustained normotension and 103 (13.9%) had MHT; 301 (40.6%) had PHT. Supplementary Figure S1 online shows substantial diagnostic overlap between MHT and PHT. Furthermore, the prevalence of PHT was higher among those with MHT (75.7%) than among those with sustained normotension (35.0% = 223/638). Supplementary Figure S2 online shows the number and proportion of MHT by categories of normal CBP. The prevalence of MHT was higher in participants with CBP in the PHT range (25.9%) compared to those with optimal CBP (5.7%).
Characteristics of participants with available LVMI by group (optimal CBP and normal awake ABP, MHT and/or PHT, and sustained hypertension) and subgroup (optimal CBP with MHT, PHT without MHT, and PHT with MHT) are presented in Supplementary Tables S2 and S3 online. Mean LVMI by group and subgroup are shown in Supplementary Tables S4 and S5 online.
Finally, as nocturnal hypertension is associated with increased CVD risk,18 additional analyses were performed in which nocturnal hypertension (mean sleep ABP ≥120/70 mm Hg) was added to model 2 for the analyses in which mean CBP was estimated from nine readings. The relations across groups remained unchanged (data not shown). Nocturnal hypertension also had no impact on the individual relations of PHT and MHT with LVMI (interaction P = 0.99 between nocturnal hypertension and PHT, interaction P = 0.13 between nocturnal hypertension and MHT).
Discussion
This study adds important information to the literature on MHT diagnosis. In our study, there were several principal findings. There was substantial diagnostic overlap between MHT and PHT in clinic normotensive participants. The prevalence of MHT was relatively high in participants with PHT and low in participants with optimal CBP. Furthermore, the prevalence of PHT was greater in MHT than in sustained normotension.
In the general population, especially in younger individuals with clinic normotension, awake ABP tends to be higher than CBP.19,20,21,22 We have hypothesized that as both CBP and ABP rise with aging, ABP first exceeds the threshold for a diagnosis of ambulatory hypertension while CBP increases but remains in the clinic normotensive range.20,23 As demonstrated by our study, a large proportion of these individuals have PHT. We posit that the CBP of these MHT individuals eventually crosses the threshold for clinic hypertension, leading to sustained hypertension. This is supported by increasing evidence that MHT is a precursor for sustained hypertension.24,25,26
Of the MHT participants in our study, those with PHT (i.e., PHT with MHT) had significantly higher levels of LVMI than those with optimal CBP (i.e., optimal CBP with MHT). Given that ABP has superior predictive value for CVD risk over CBP, one would also anticipate that PHT with MHT would be a higher CVD risk category than PHT without MHT. However, although there was a significant unadjusted difference in LVMI between PHT with MHT and PHT without MHT participants in our study, this difference was no longer significant in adjusted models. One possible explanation for this finding is the large number and high quality of CBP readings (average of nine readings taken on three separate occasions according to published guidelines14) that were obtained and used to define mean CBP. The correlations between CBP and ABP in our study are greater than what has been observed in some previous studies,27,28 which may have limited the ability to detect differences in LVMI between PHT participants with and without MHT. Presently, scarce data exist from prior studies as to whether MHT adds prognostic information in individuals with PHT. In what to our knowledge is the only published study to examine the predictive value of MHT for CVD events in participants with PHT, Pierdomenico et al.29 found that in participants with PHT, MHT was associated with a significantly higher rate of CVD events, compared to those participants without MHT (“true PHT”). This study was limited by a small number of events (18 events in MHT and PHT vs. 11 events in true PHT) and potentially incomplete examination of confounders such as male gender.29
Also, unexpectedly in our study, compared to participants with optimal CBP with MHT, LVMI was significantly greater in participants with PHT without MHT in adjusted models. In addition to the number and quality of CBP readings, which likely increased the predictive value of CBP, there are other plausible explanations for these findings. First, notably, as it is relatively rare for an individual with optimal CBP to have MHT, the sample size of the optimal CBP with MHT group was small. Additionally, variability in ABPM30 may have also allowed for some participants with optimal CBP and normal awake ABP to be incorrectly categorized as having optimal CBP and ambulatory hypertension, leading to a lower than expected LVMI in the optimal CBP with MHT group.
These issues have important clinical implications. If MHT is a high-risk subgroup of the larger PHT group, then it may be appropriate to recommend that individuals with PHT receive targeted screening for MHT using ABPM. Furthermore, if optimal CBP with MHT is a lower CVD risk group, then ABPM may not be indicated for individuals with optimal CBP levels, particularly as the prevalence of MHT is low in this group.
Whether our results on the diagnostic overlap between MHT and PHT can be extended to home blood pressure monitoring is unknown. Findings from the Self measurement of blood pressure at Home in the Elderly: Assessment and Follow-up (SHEAF) study31, the Japan Home vs. Office BP Measurement Evaluation (J-HOME) study32, and a substudy of the Three-City Study (3C)33 indicate that clinic SBP in the PHT range is associated with MHT, when determined by home blood pressure monitoring. These findings may not be directly comparable to the results of our study. In addition to the reliance on home blood pressure monitoring, these studies included treated hypertensive patients. Further, participants were older, and many had prevalent CVD.
There are several possible limitations to our study. First, as awake ABP was estimated from one 24-h monitoring period, we cannot exclude the possibility that the study results would have differed with the inclusion of additional 24-h period. Multiple, high quality readings were used in our study to estimate CBP. Nonetheless, this approach is consistent with published guidelines, which recommend the performance of measurements in this manner to estimate CBP.14 Finally, our sample consisted of adult employees who were generally healthy. Whether our results can be extended to other populations remains unknown.
Major strengths of the study include a large sample size, the inclusion of a large proportion of participants with normal CBP levels, the exclusion of participants on antihypertensive medications, and consideration of several possible confounding factors including physical activity. Further, echocardiography with the assessment of LVMI was successfully performed in almost all participants. Finally, as this is one of the first studies to directly examine the degree of diagnostic overlap between MHT and PHT in a community sample, and to investigate their respective relationships with a marker of cardiovascular end-organ damage, the current study provides valuable new information.
In conclusion, the results of the present study demonstrate that in an employed, community sample, there is substantial diagnostic overlap between MHT and PHT in individuals with clinic normotension. Furthermore, given the low prevalence of MHT in individuals with optimal CBP, our findings suggest that the diagnosis of MHT using an ABPM may not be warranted for individuals with optimal CBP. Future studies should confirm our findings, and additionally examine the relative contributions of PHT and MHT to CVD event risk.
Supplementary material is linked to the online version of the paper at http://www.nature.com/ajh
Supplementary Table S1
Supplementary Table S2
Supplementary Table S3
Supplementary Table S4
Supplementary Table S5
Supplementary Figure S1
Supplementary Figure S2
Acknowledgments
We are indebted to the study participants and research staff, without whose cooperation and dedication this study would not have been possible. The study was directly supported by P01-HL047540 (PI: J.E.S) and R24-HL076857 (PI: K.D.) from the National Heart, Lung, and Blood Institute at the National Institutes of Health (NIH). The research was also supported by T32-HL007854-15, MO1-RR10710 from the General Clinical Research Center (at Stony Brook University), and by UL1-RR024156 (at Columbia University) from the National Center for Research Resources (NCRR), a component of the NIH, and NIH Roadmap for Medical Research. The contents are solely the responsibility of the authors and do not necessarily represent the official view of NIH or NCRR.
Disclosure
The authors declared no conflict of interest.
References
- 1.Pickering TG, Davidson K, Gerin W, Schwartz JE. Masked hypertension. Hypertension 2002;40:795–796 [DOI] [PubMed] [Google Scholar]
- 2.Liu JE, Roman MJ, Pini R, Schwartz JE, Pickering TG, Devereux RB. Cardiac and arterial target organ damage in adults with elevated ambulatory and normal office blood pressure. Ann Intern Med 1999;131:564–572 [DOI] [PubMed] [Google Scholar]
- 3.Björklund K, Lind L, Zethelius B, Andrén B, Lithell H. Isolated ambulatory hypertension predicts cardiovascular morbidity in elderly men. Circulation 2003;107:1297–1302 [DOI] [PubMed] [Google Scholar]
- 4.Mancia G, Facchetti R, Bombelli M, Grassi G, Sega R. Long-term risk of mortality associated with selective and combined elevation in office, home, and ambulatory blood pressure. Hypertension 2006;47:846–853 [DOI] [PubMed] [Google Scholar]
- 5.Ohkubo T, Kikuya M, Metoki H, Asayama K, Obara T, Hashimoto J, Totsune K, Hoshi H, Satoh H, Imai Y. Prognosis of “masked” hypertension and “white-coat” hypertension detected by 24-h ambulatory blood pressure monitoring 10-year follow-up from the Ohasama study. J Am Coll Cardiol 2005;46:508–515 [DOI] [PubMed] [Google Scholar]
- 6.Angeli F, Reboldi G, Verdecchia P. Masked hypertension: evaluation, prognosis, and treatment. Am J Hypertens 2010;23:941–948 [DOI] [PubMed] [Google Scholar]
- 7.Pierdomenico SD, Cuccurullo F. Prognostic value of white-coat and masked hypertension diagnosed by ambulatory monitoring in initially untreated subjects: an updated meta analysis. Am J Hypertens 2011;24:52–58 [DOI] [PubMed] [Google Scholar]
- 8.Sega R, Trocino G, Lanzarotti A, Carugo S, Cesana G, Schiavina R, Valagussa F, Bombelli M, Giannattasio C, Zanchetti A, Mancia G. Alterations of cardiac structure in patients with isolated office, ambulatory, or home hypertension: Data from the general population (Pressione Arteriose Monitorate E Loro Associazioni [PAMELA] Study). Circulation 2001;104:1385–1392 [DOI] [PubMed] [Google Scholar]
- 9.Fagard RH, Cornelissen VA. Incidence of cardiovascular events in white-coat, masked and sustained hypertension versus true normotension: a meta-analysis. J Hypertens 2007;25:2193–2198 [DOI] [PubMed] [Google Scholar]
- 10.Bobrie G, Clerson P, Ménard J, Postel-Vinay N, Chatellier G, Plouin PF. Masked hypertension: a systematic review. J Hypertens 2008;26:1715–1725 [DOI] [PubMed] [Google Scholar]
- 11.Verberk WJ, Kessels AG, de Leeuw PW. Prevalence, causes, and consequences of masked hypertension: a meta-analysis. Am J Hypertens 2008;21:969–975 [DOI] [PubMed] [Google Scholar]
- 12.Vasan RS, Larson MG, Leip EP, Evans JC, O'Donnell CJ, Kannel WB, Levy D. Impact of high-normal blood pressure on the risk of cardiovascular disease. N Engl J Med 2001;345:1291–1297 [DOI] [PubMed] [Google Scholar]
- 13.Drukteinis JS, Roman MJ, Fabsitz RR, Lee ET, Best LG, Russell M, Devereux RB. Cardiac and systemic hemodynamic characteristics of hypertension and prehypertension in adolescents and young adults: the Strong Heart Study. Circulation 2007;115:221–227 [DOI] [PubMed] [Google Scholar]
- 14.Pickering TG, Hall JE, Appel LJ, Falkner BE, Graves J, Hill MN, Jones DW, Kurtz T, Sheps SG, Roccella EJ; Subcommittee of Professional and Public Education of the American Heart Association Council on High Blood Pressure Research Recommendations for blood pressure measurement in humans and experimental animals: Part 1: blood pressure measurement in humans: a statement for professionals from the Subcommittee of Professional and Public Education of the American Heart Association Council on High Blood Pressure Research. Hypertension 2005;45:142–161 [DOI] [PubMed] [Google Scholar]
- 15.Heil DP. Predicting activity energy expenditure using the Actical activity monitor. Res Q Exerc Sport 2006;77:64–80 [DOI] [PubMed] [Google Scholar]
- 16.Rudski LG, Lai WW, Afilalo J, Hua L, Handschumacher MD, Chandrasekaran K, Solomon SD, Louie EK, Schiller NB. Guidelines for the echocardiographic assessment of the right heart in adults: a report from the American Society of Echocardiography endorsed by the European Association of Echocardiography, a registered branch of the European Society of Cardiology, and the Canadian Society of Echocardiography. J Am Soc Echocardiogr 2010;23:685–713; quiz 786 [DOI] [PubMed] [Google Scholar]
- 17.Chobanian AV, Bakris GL, Black HR, Cushman WC, Green LA, Izzo JL, Jr, Jones DW, Materson BJ, Oparil S, Wright JT, Jr, Roccella EJ; National Heart, Lung, and Blood Institute Joint National Committee on Prevention, Detection, Evaluation, and Treatment of High Blood Pressure; National High Blood Pressure Education Program Coordinating Committee The Seventh Report of the Joint National Committee on Prevention, Detection, Evaluation, and Treatment of High Blood Pressure: the JNC 7 report. JAMA 2003;289:2560–2572 [DOI] [PubMed] [Google Scholar]
- 18.Fan HQ, Li Y, Thijs L, Hansen TW, Boggia J, Kikuya M, Björklund-Bodegård K, Richart T, Ohkubo T, Jeppesen J, Torp-Pedersen C, Dolan E, Kuznetsova T, Stolarz-Skrzypek K, Tikhonoff V, Malyutina S, Casiglia E, Nikitin Y, Lind L, Sandoya E, Kawecka-Jaszcz K, Imai Y, Ibsen H, O'Brien E, Wang J, Staessen JA; International Database on Ambulatory Blood Pressure In Relation to Cardiovascular Outcomes Investigators Prognostic value of isolated nocturnal hypertension on ambulatory measurement in 8711 individuals from 10 populations. J Hypertens 2010;28:2036–2045 [DOI] [PubMed] [Google Scholar]
- 19.Harshfield GA, Pickering TG, Kleinert HD, Blank S, Laragh JH. Situational variations of blood pressure in ambulatory hypertensive patients. Psychosom Med 1982;44:237–245 [DOI] [PubMed] [Google Scholar]
- 20.Pickering TG, Gerin W, Schwartz JE, Spruill TM, Davidson KW. Franz Volhard lecture: should doctors still measure blood pressure? The missing patients with masked hypertension. J Hypertens 2008;26:2259–2267 [DOI] [PMC free article] [PubMed] [Google Scholar]
- 21.Shimbo D, Kuruvilla S, Haas D, Pickering TG, Schwartz JE, Gerin W. Preventing misdiagnosis of ambulatory hypertension: algorithm using office and home blood pressures. J Hypertens 2009;27:1775–1783 [DOI] [PMC free article] [PubMed] [Google Scholar]
- 22.Verdecchia P, Schillaci G, Borgioni C, Ciucci A, Zampi I, Gattobigio R, Sacchi N, Porcellati C. White coat hypertension and white coat effect. Similarities and differences. Am J Hypertens 1995;8:790–798 [DOI] [PubMed] [Google Scholar]
- 23.Pickering TG. The natural history of hypertension: prehypertension or masked hypertension? J Clin Hypertens (Greenwich) 2007;9:807–810 [DOI] [PMC free article] [PubMed] [Google Scholar]
- 24.Palatini P, Winnicki M, Santonastaso M, Mos L, Longo D, Zaetta V, Dal Follo M, Biasion T, Pessina AC. Prevalence and clinical significance of isolated ambulatory hypertension in young subjects screened for stage 1 hypertension. Hypertension 2004;44:170–174 [DOI] [PubMed] [Google Scholar]
- 25.Lurbe E, Torro I, Alvarez V, Nawrot T, Paya R, Redon J, Staessen JA. Prevalence, persistence, and clinical significance of masked hypertension in youth. Hypertension 2005;45:493–498 [DOI] [PubMed] [Google Scholar]
- 26.Mancia G, Bombelli M, Facchetti R, Madotto F, Quarti-Trevano F, Polo Friz H, Grassi G, Sega R. Long-term risk of sustained hypertension in white-coat or masked hypertension. Hypertension 2009;54:226–232 [DOI] [PubMed] [Google Scholar]
- 27.Beckett L, Godwin M. The BpTRU automatic blood pressure monitor compared to 24 hour ambulatory blood pressure monitoring in the assessment of blood pressure in patients with hypertension. BMC Cardiovasc Disord 2005;5:18. [DOI] [PMC free article] [PubMed] [Google Scholar]
- 28.Little P, Barnett J, Barnsley L, Marjoram J, Fitzgerald-Barron A, Mant D. Comparison of agreement between different measures of blood pressure in primary care and daytime ambulatory blood pressure. BMJ 2002;325:254. [DOI] [PMC free article] [PubMed] [Google Scholar]
- 29.Pierdomenico SD, Pannarale G, Rabbia F, Lapenna D, Licitra R, Zito M, Campanella M, Gaudio C, Veglio F, Cuccurullo F. Prognostic relevance of masked hypertension in subjects with prehypertension. Am J Hypertens 2008;21:879–883 [DOI] [PubMed] [Google Scholar]
- 30.Palatini P. Reliability of ambulatory blood pressure monitoring. Blood Press Monit 2001;6:291–295 [DOI] [PubMed] [Google Scholar]
- 31.Mallion JM, Clerson P, Bobrie G, Genes N, Vaisse B, Chatellier G. Predictive factors for masked hypertension within a population of controlled hypertensives. J Hypertens 2006;24:2365–2370 [DOI] [PubMed] [Google Scholar]
- 32.Obara T, Ohkubo T, Funahashi J, Kikuya M, Asayama K, Metoki H, Oikawa T, Hashimoto J, Totsune K, Imai Y. Isolated uncontrolled hypertension at home and in the office among treated hypertensive patients from the J-HOME study. J Hypertens 2005;23:1653–1660 [DOI] [PubMed] [Google Scholar]
- 33.Cacciolati C, Hanon O, Alpérovitch A, Dufouil C, Tzourio C. Masked hypertension in the elderly: cross-sectional analysis of a population-based sample. Am J Hypertens 2011;24:674–680 [DOI] [PubMed] [Google Scholar]
Associated Data
This section collects any data citations, data availability statements, or supplementary materials included in this article.
Supplementary Materials
Supplementary Table S1
Supplementary Table S2
Supplementary Table S3
Supplementary Table S4
Supplementary Table S5
Supplementary Figure S1
Supplementary Figure S2