Abstract
Ovarian cancer is a leading cause of cancer death in women in the United States. While the majority of ovarian cancers are serous, some rarer subtypes (i.e. clear cell) are often associated with endometriosis, a benign gynecological disease. Iron is rich in the cyst fluid of endometriosis-associated ovarian cancers and induces persistent oxidative stress. The role of iron, an essential nutrient involved in multiple cellular functions, in normal ovarian cell survival and ovarian cancer remains unclear. Iron, presented as ferric ammonium citrate (FAC), dramatically inhibits cell survival in ovarian cancer cell types associated with Ras mutations, while it is without effect in immortalized normal ovarian surface epithelial (T80) and endometriotic epithelial cells (lacking Ras mutations). Interestingly, FAC induced changes in cytoplasmic vacuolation concurrently with increases in LC3-II levels (an autophagy marker); these changes occurred in an ATG5/ATG7-dependent, beclin-1/hVps34-independent, and Ras-independent manner. Knockdown of autophagy mediators in HEY ovarian cancer cells reversed FAC-induced LC3-II levels, but there was little effect on reversing the cell death response. Intriguingly, transmission electron microscopy of FAC-treated T80 cells demonstrated abundant lysosomes (confirmed using Lysotracker) rich in iron particles, which occurred in a Ras-independent manner. Although the mitogen-activated protein kinase (MAPK) inhibitor, U0126, reversed FAC-induced LC3-II/autophagic punctae and lysosomes in a Ras-independent manner, it was remarkable that U0126 reversed cell death in malignant ovarian cells associated with Ras mutations. Moreover, FAC increased heme oxygenase-1 expression in H-Ras-overexpressing T80 cells, which was associated with increased cell death when overexpressed in T80 cells. Disruption of intracellular iron levels, via chelation of intracellular iron (deferoxamine), was also detrimental to malignant ovarian cell survival; thus, homeostatic intracellular iron levels are essential for cell survival. Collectively, our results implicate iron in modulating cell death in a Ras- and MAPK-dependent manner in ovarian cancer cells.
Keywords: iron (ferric ammonium citrate), lysosomes, Ras, ovarian cancer, MAP kinase
Ovarian carcinoma is the fifth most common cancer for women in the United States and is usually diagnosed at an advanced stage when the cancer has already spread.1 Several ovarian cancer subtypes exist that elicit differential responses to chemotherapy. Clear cell ovarian carcinoma (CCC, a rare subtype) is more resistant to chemotherapy compared with serous epithelial ovarian cancers, the major epithelial ovarian carcinoma (EOC).2 Endometriotic cysts, considered a precursor to endometriosis-associated ovarian cancers, contain a high level of heme,3, 4 which can be broken down via the action of heme oxygenase-1 (HO-1) to release iron, biliverdin, and carbon monoxide; these products increase oxidative stress that alters cell survival and contribute to cancer development.3, 4 Treating normal ovarian surface epithelial cells with redox-active iron promotes acquisition of a CCC signature.5 Iron can also induce cell death in cell types associated with Ras mutations.6 Thus, iron may elicit dual functional roles in cancer development. Reactive oxygen species (ROS) can also be generated via hypoxia, correlated with elevated LC3A (a marker of autophagy) expression in CCC associated with hypoxic regions and poor patient outcome.7 Autophagy is a self-eating process where damaged and oxidized cellular material are sequestered in autophagosomes and then degraded within lysosomes.8 Autophagy elicits tumor suppressive effects in normal cells, while under conditions of oxidative stress, autophagy sustains survival of cancer cells. It is presently unknown whether oxidative stress induced by iron alters autophagy to modulate cell survival in normal and malignant ovarian cells.
Herein, we present data implicating iron in inhibiting cell survival in ovarian cancer cell types associated with Ras mutations. Iron elevates LC3-II levels in multiple cell types in an ATG5/ATG7-dependent and beclin-1/hVps34-independent fashion. However, knockdown of autophagy mediators resulted in only a modest reversal of cell death. Iron also induced an increase in lysosome numbers in a Ras-independent manner. Inhibition of the mitogen-activated protein kinase (MAPK) pathway in ovarian cancer cells dramatically reversed iron-induced LC3-II levels and lysosome numbers. Strikingly, this inhibitor reversed the cell death response in cell lines associated with Ras mutations. Iron also induced cell death via upregulation of HO-1 in a nuclear factor (erythoid-derived 2)-like 2 (NRF2)-independent but Ras-dependent manner. Modulation of intracellular levels of iron (via chelation with deferoxamine (DFO)) also disrupts cell survival, implicating a need to critically monitor and maintain appropriate levels of cellular iron for cell survival. Collectively, we demonstrate that iron modulates cell death in ovarian cancer cell types in a Ras- and MAPK-dependent manner.
Results
FAC modulates cell survival in ovarian cell types associated with Ras mutations
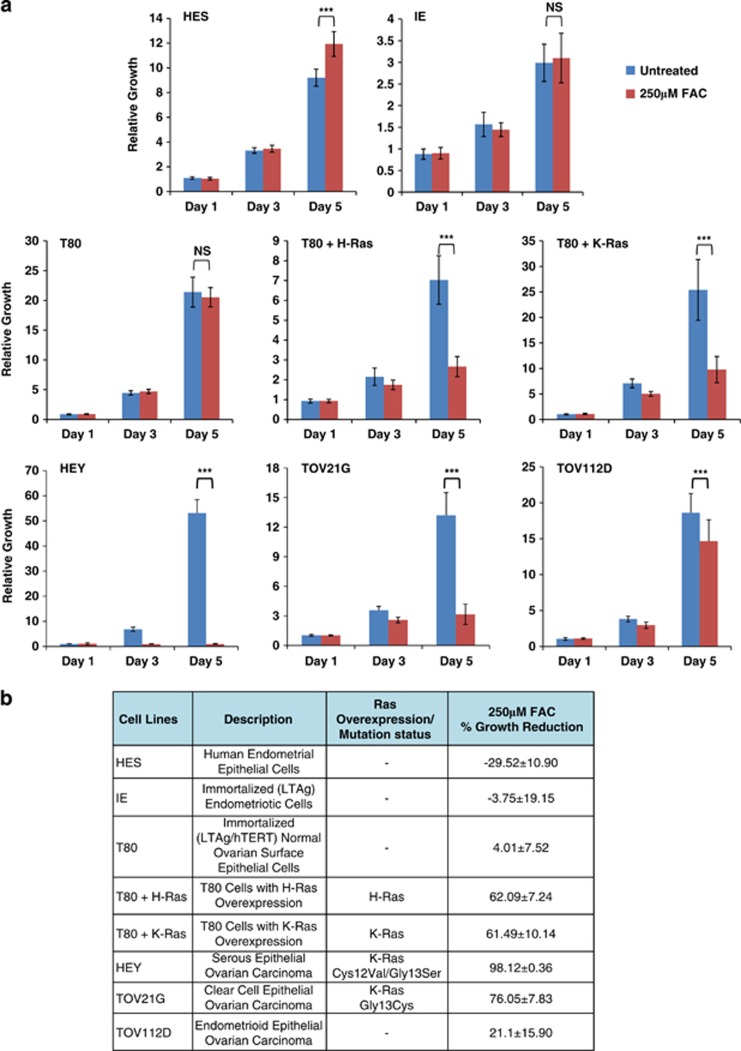
To determine the effect of long-term treatment with iron (presented as ferric ammonium citrate, FAC) on normal and ovarian carcinoma cell lines, we performed growth assays (Figure 1a and summarized in Figure 1b). As normal cells, we used T80 cells, which are immortalized (LTAg/hTERT) normal ovarian surface epithelial cells, from which the T80+H-Ras and T80+K-Ras cells were derived via the overexpression of Ras9 as well as human epithelial endometrial cells (HES), a normal endometrial epithelial cell line, recently reported to express markers of HeLa cells.10 Immortalized endometriotic (IE) are SV40 LTAg immortalized normal endometriotic cells developed from primary cells (Bello et al., unpublished work). Screening for mutations in PI3K catalytic subunit (PIK3CA) (exon 9 and 20) and K-Ras using IE genomic DNA failed to identify any mutated sequences, implicating normal features for this cell line. For epithelial ovarian cancer cell lines, we assessed HEY (a serous epithelial ovarian cancer cell line) and TOV21G cells (a clear cell epithelial ovarian cancer cell line) containing Ras mutations as well as TOV112D cells (an endometrioid epithelial ovarian cancer cell line), which has no Ras mutations thus far identified.11, 12 Surprisingly, we found that 250 μM FAC induced a marked growth inhibition in HEY and TOV21G ovarian cancer lines in contrast to a modest or no effect in the ‘normal' cell types (T80, HES, and IE). Although TOV112D displayed a reduction in cell growth with FAC, it was less dramatic compared with HEY and TOV21G. To determine whether Ras altered cellular responsiveness to iron, T80 cells overexpressing H-Ras and K-Ras were assessed.9 Ras-overexpressing T80 cells show a striking reduction in cell growth with FAC in contrast to parental T80 cells (Figures 1a and b). These results implicate increased iron-sensitivity in cancer cells associated with Ras mutations or in normal cells overexpressing Ras.
Figure 1.
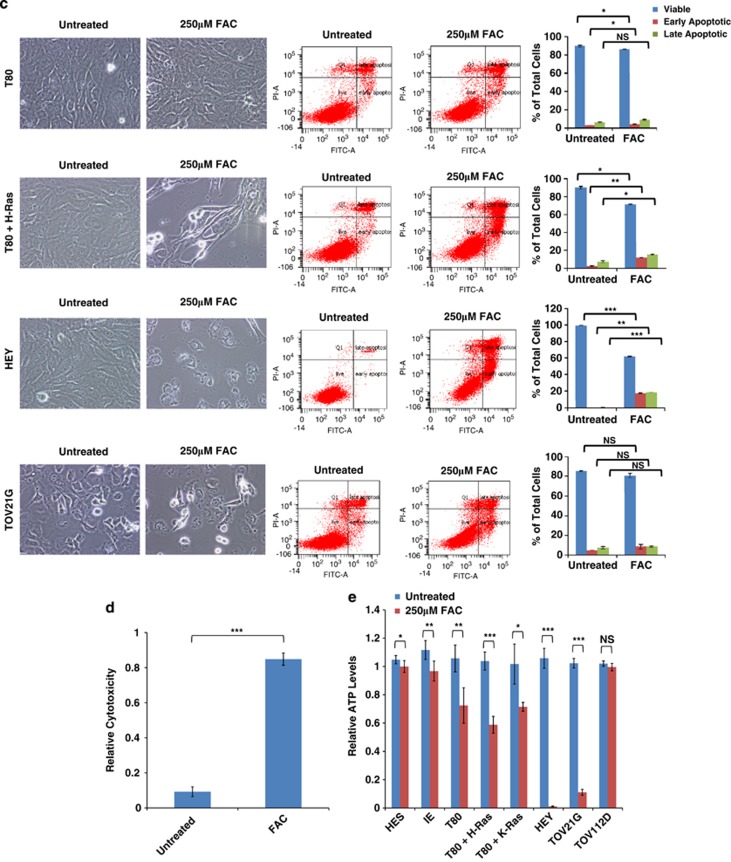
Effect of FAC on ‘normal' and malignant gynecological cell survival. (a) Growth assays were performed in IE, HES, T80, T80+H-Ras, T80+K-Ras, HEY, TOV21G, and TOV112D cells from Day 1 to Day 5 in the absence or presence of 250 μM FAC. Results are representative of three independent experiments. (b) Data presented in (a) are presented in tabular format as the percentage changes in growth for all the cell lines assessed. In addition, a cell line description and Ras overexpression/mutation status are summarized for each cell line used. (c) T80, T80+H-Ras, HEY, or TOV21G cells were treated with 250 μM FAC for 72 h, at which time both the floating and adherent cells were collected. Cells were stained with annexin V-FITC and propidium iodide (PI) followed by flow cytometric analysis. Light microscope images of these cells are shown in the left panels; raw data plots of apoptosis assays are shown in the middle panels; the percentages of viable and dead cells are shown in the right panels. Results are representative of two independent experiments. (d) HEY cells were treated with 250 μM FAC for 72 h followed by LDH cytotoxicity assay measurements. Results are representative of two independent experiments. (e) HES, IE, T80, T80+H-Ras, T80+K-Ras, HEY, TOV21G, and TOV112D cells were assessed for ATP levels following the treatment of the cells with 250 μM FAC. * refers to P<0.05
To obtain further insight into the nature of FAC-mediated growth reduction, we initially assessed whether FAC induced senescence. Although FAC-treated cells lacked markers of senescence (β-galactosidase staining) (results not shown), cell cycle analysis demonstrated a significant >7% increase in cells in G1 with a corresponding reduction of 3% of cells in S phase following 72 h FAC treatment (Supplementary Figure 1a). Similar increases in the percentage of G1 phase cells were obtained in HEY and TOV21G (results not presented). These results indicate that FAC induces accumulation of cells in the G1 phase. To assess apoptosis (via annexin V/PI staining (Figure 1c)), FAC-treated HEY and T80+H-Ras cells displayed a significant increase in the percentage of early and late apoptotic/necrotic cells. In contrast, FAC did not induce an apoptotic response in TOV21G, although marked changes in cellular morphology were observed via light microscopy (Figure 1c). Intriguingly, we observed that FAC induced a marked necrotic cell death response in HEY cells (Figure 1c) as observed via light microscopy/PI staining, and validated by measuring lactate dehydrogenase (LDH) activity (Figure 1d).
To determine whether FAC could modulate changes in cellular metabolic activity, we quantified ATP levels following 72 h FAC treatment in ‘normal' and malignant ovarian cells. A significant reduction in ATP levels was observed in HEY and TOV21G cells; however, there was no difference between T80 and T80+H-Ras cells, suggesting that FAC-mediated changes in ATP occur via a Ras-independent mechanism (Figure 1e). We further observed a dramatic effect on the inhibition of migration in all assessed cell types, (Supplementary Figure 1b) suggesting that FAC can mediate other functional effects in ovarian cells.
FAC alters autophagy in a Ras-independent manner, which contributes only a modest effect to the cell death response
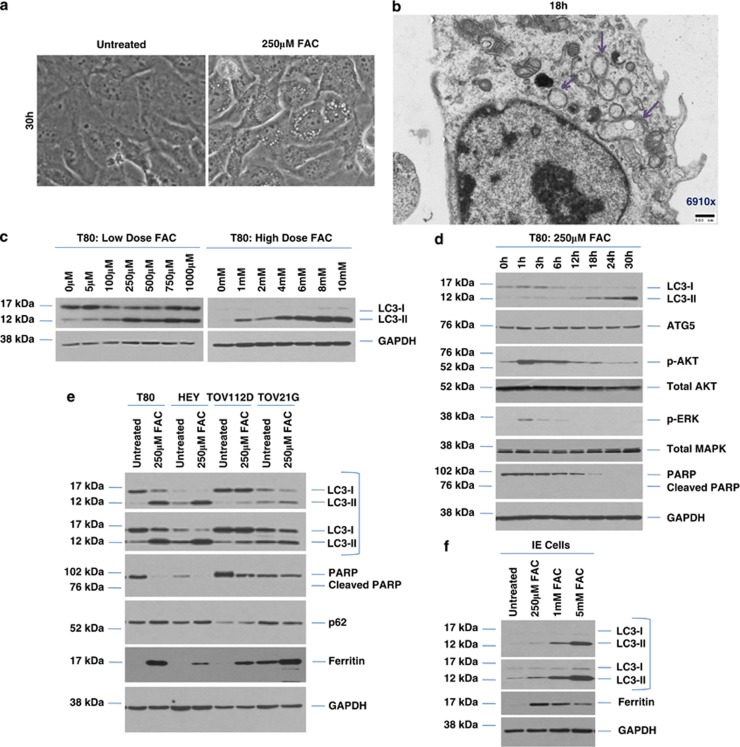
As we observed increased cytoplasmic vacuole formation (a feature of autophagy) with 250 μM FAC in T80 cells (Figure 2a), we next assessed whether FAC could alter levels of LC3-II, a marker of autophagy. Transmission electron microscopy (TEM) documented the presence of double-membrane autophagosomes (Figure 2b). We also noted a clear LC3-II increase in T80 cells with increasing doses of FAC (5 μM to 10 mM, Figure 2c). Moreover, we noted the activation of AKT and MAPK within 1 h of FAC treatment, suggesting changes in LC3-II could be mediated via the activation of these pathways (Figure 2d). We identified optimal FAC doses for the ovarian cancer cell lines used (HEY, TOV21G, and TOV112D) (Supplementary Figures 2a–d). Increases in LC3-II levels were also observed in ovarian cancer cell lines (HEY, TOV21G, and TOV112D), (Figure 2e) suggesting that FAC could alter the autophagic response in multiple gynecological cell types. Among the cancer cell lines, HEY elicited the most robust LC3-II response, while TOV112D was the least responsive. FAC treatment of IE cells induced a similar LC3-II response relative to T80 cells (Figure 2f). In all cell lines assessed, we noted that FAC increased ferritin levels (FTH, Figures 2e and f). FTH is known to bind free redox-active iron as a cytoprotective pathway. Thus, we assessed the expression level of genes involved in modulating cellular iron content, including the transferrin receptor (CD71) and FTH, which could mediate the observed differential cellular response of FAC. However, we did not identify any association between CD71, ferritin, and LC3-II under our conditions (Supplementary Figure 3).
Figure 2.
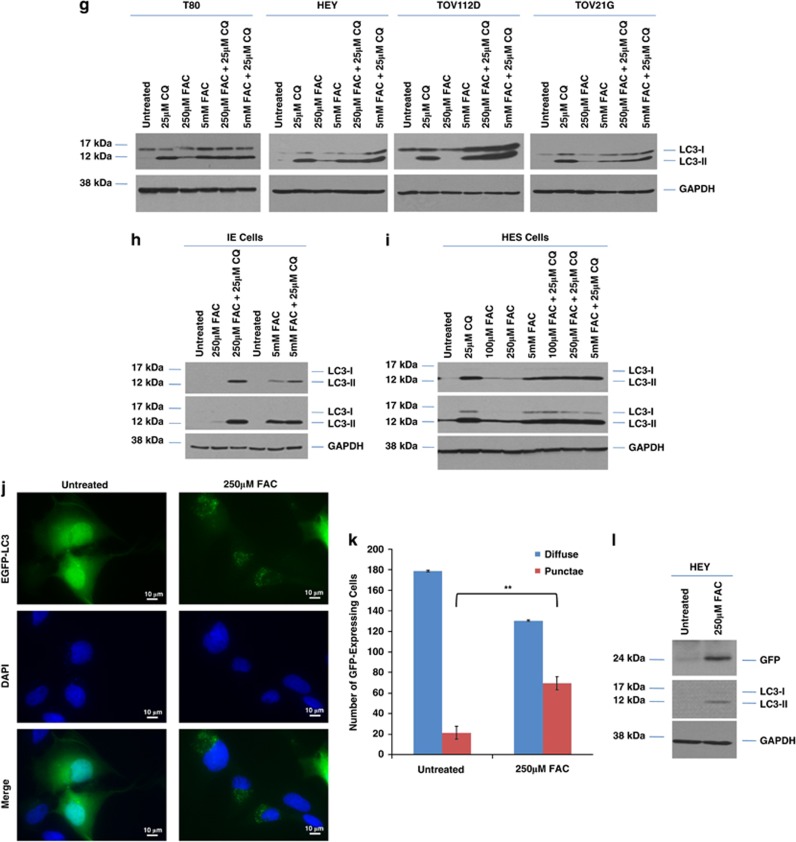
FAC alters autophagy in ‘normal' and malignant gynecological cells. (a) T80 cells were treated with 250 μM FAC for 30 h. Representative light microscope images were captured at × 40 magnification. (b) T80 cells treated for 18 h with 250 μM FAC were subjected to TEM, which identified double-membrane autophagosomes (purple arrows). (c) T80 cells were treated with increasing doses of FAC (5 μM–10mM). Cell lysates were harvested and analyzed by western blotting for the proteins indicated. Results are representative of two independent experiments. (d) T80 cells were treated with 250 μM FAC across various time points (1–30 h). Cell lysates were harvested and analyzed by western blotting for the proteins indicated. Results are representative of two independent experiments. (e) T80, HEY, TOV112D, and TOV21G cells were treated with 250 μM FAC for 18 h. Cell lysates were harvested and analyzed by western blotting for the proteins indicated. Results are representative of two independent experiments. (f) IE cells were treated with increasing doses of FAC (0.25–5mM) for 18 h. Cell lysates were harvested and analyzed by western blotting for the proteins indicated. Results are representative of two independent experiments. (g) T80, HEY, TOV112D, and TOV21G were treated with (1) 25 μM CQ, (2) 250 μM FAC, (3) 5mM FAC, (4) 250 μM FAC with 25 μM CQ, or (5) 5mM FAC with 25 μM CQ for 18 h. Cell lysates were harvested and western blotting performed for the proteins indicated. Results are representative of two independent experiments. (h) IE cells were treated with (1) 250 μM FAC, (2) 250 μM FAC with 25 μM CQ, (3) 5 mM FAC, or (4) 5 mM FAC with 25 μM CQ for 18 h. Cell lysates were harvested and western blotting performed for the proteins indicated. Results are representative of two independent experiments. (i) HES cells were treated with (1) 25 μM CQ, (2) 100 μM FAC, (3) 250 μM FAC, (4) 5 mM FAC, (5) 100 μM FAC with 25 μM CQ, or (6) 250 μM FAC with 25 μM CQ, (7) 5 mM FAC with 25 μM CQ for 18 h. Cell lysates were harvested and western blotting performed for the proteins indicated. Results are representative of two independent experiments. (j) T80 cells were transfected with EGFP–LC3 and treated with 250 μM FAC. EGFP–LC3 fluorescence was captured using an inverted fluorescence microscope. Representative images of experiments conducted in duplicate are shown. (k) Quantification of results shows in (a) The number of cells with punctae was quantified by counting cells with >20 punctae. (l) HEY cells were transfected with GFP–LC3. Following 18 h FAC treatment, western analyses were performed using the indicated antibodies. Results are representative of two independent experiments. * refers to P<0.05
We noted the basal level of LC3-II was highest in HEY and TOV21G, and moderate in TOV112D (Supplementary Figure 4a). Autophagic inhibition (using 25 μM chloroquine (CQ), an agent used to inhibit autophagosome–lysosome fusion) increased LC3-II levels and inhibited cell survival of both the normal and cancer-derived ovarian cell types, assessed via colony formation assays (Supplementary Figure 4b). These results implicate basal autophagy in mediating cell survival in multiple ovarian cell types. To determine whether the increase of LC3-II with FAC was due to autophagy induction or autophagosomal accumulation, cells were cotreated with CQ and FAC. CQ further increased the levels of LC3-II with 250 μM FAC (Figures 2g–i), suggesting this dose of FAC mediates autophagic induction (increased autophagic flux). In contrast, LC3-II did not further accumulate following 5 mM FAC in combination with CQ, suggestive of autophagosomal accumulation (decreased autophagic flux). p62 levels were variable in response to FAC in the different cell types as well as in response to different doses of FAC (Supplementary Figures 2a–d). Although increased p62 levels can be considered a marker of reduced autophagic flux, p62 has other functional roles.13, 14 To validate the induction of autophagy upon FAC treatment, we transfected T80 cells with enhanced green fluorescent protein (EGFP)–LC3 plasmid followed by 250 μM FAC treatment. The transition from diffuse to punctate GFP expression induced by FAC suggests LC3-II becomes associated with autophagosomal membranes (Figures 2j and k). To demonstrate that the changes in LC3-II were due to increased autophagic flux, we utilized the GFP–LC3 cleavage assay15 in HEY cells. We observed that FAC increased GFP cleavage, (Figure 2l) suggesting that FAC increases autophagic flux.
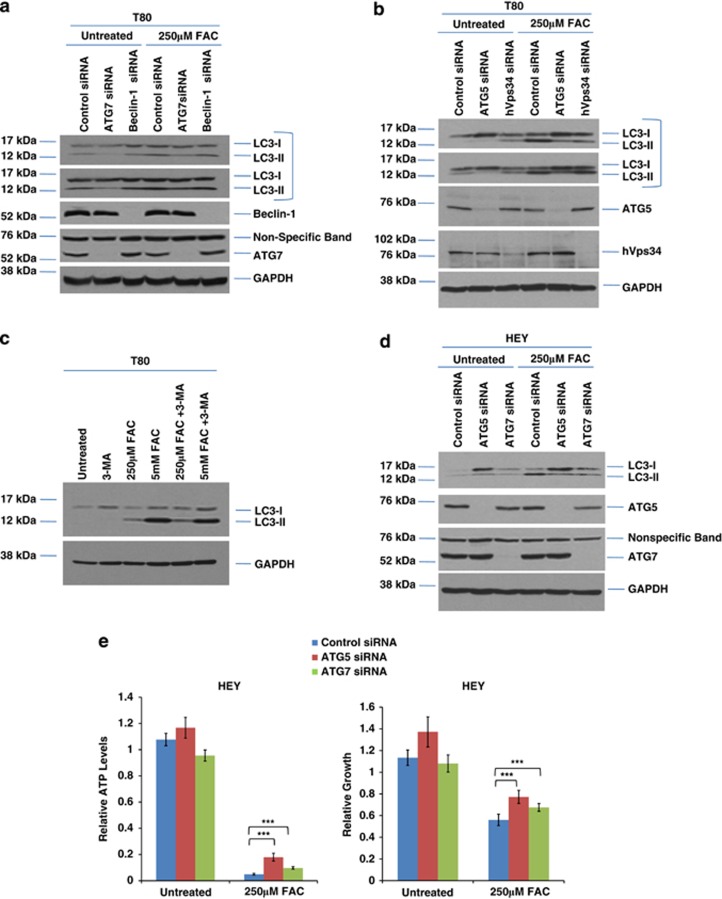
To assess whether knockdown of essential autophagy markers alters FAC-induced LC3-II formation, we utilized siRNA targeting ATG5, ATG7, beclin-1, and hVps34. Knockdown of these markers was very effective (>95% reduction in protein expression) in contrast to long-term short hairpin RNA (shRNA) ATG5 knockdown (Supplementary Figure 5a). Although reduction of LC3-II levels was marked with ATG5 and ATG7 knockdown in T80 cells, there was no effect with beclin-1 or hVps34 (Figures 3a and b). Cotreatment with 3-methyladenine (3-MA, inhibitor of hVps34 kinase activity) with FAC did not alter LC3-II levels (Figure 3c). These results indicate that the FAC-induced LC3-II increase is ATG5/ATG7-dependent and beclin-1/hVps34-independent. To assess whether knockdown of ATG5/ATG7 expression could hinder the FAC-induced cell death response (Figure 3d), we assessed cellular viability following ATG5 and ATG7 siRNA treatment in FAC-treated HEY cells. Although recovery was not complete, there was a modest but reproducible and significant increase in cellular viability and ATP levels (Figure 3e). Furthermore, no significant effect was noted upon ATG5/7 knockdown in both T80 and T80+H-Ras cells (Supplementary Figures 5b and c). This suggests that FAC alters autophagy in an ATG5/ATG7-dependent and a Ras-independent manner, which contributes only a modest effect to FAC-induced cell survival implicating other mechanisms in modulating FAC-induced cell death response.
Figure 3.
FAC alters autophagy in an ATG5/ATG7-dependent mechanism in normal and malignant ovarian cells. (a) T80 cells were transfected with non-targeting control, ATG7, and beclin-1 siRNA. Cell lysates were harvested and analyzed for the proteins indicated. (b) T80 cells were transfected with non-targeting control, ATG5, or hVps34 siRNA. Cell lysates were harvested and analyzed for the proteins indicated. (c) T80 cells were treated with (1) 2 mM 3-MA, (2) 250 μM FAC, (3) 5 mM FAC, (4) 250 μM FAC and 2 mM 3-MA, or (5) 5 mM FAC and 2 mM 3-MA. Cell lysates were harvested and analyzed for the proteins indicated. (d) HEY cells were transfected with non-targeting control, ATG5, or ATG7 siRNA. Cell lysates were harvested and analyzed for the proteins indicated. (e) HEY cells were transfected with non-targeting control, ATG5, or ATG7 siRNA. Cells were then assessed for ATP levels (left panel) or cell survival (right panel) following treatment of the cells with 250 μM FAC. * refers to P<0.05
FAC alters lysosome abundance in a Ras-independent manner
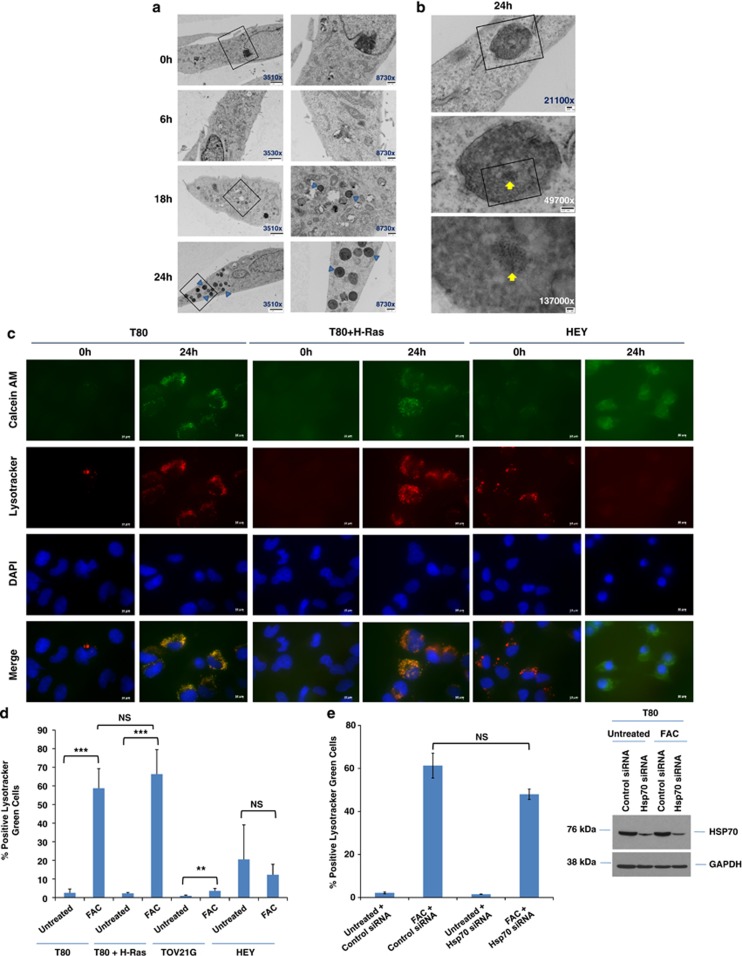
TEM analyses (Figure 4a) document increased numbers of lysosomes following 250 μM FAC treatment (24 h). The lysosomes could likely correspond to autophagolysosomes engaged in the degradation of iron-containing material. Higher magnification photographs of lysosomes (Figure 4b) demonstrate the presence of iron particles (1–3 nm), validated by the acquisition of TEM images of iron in liquid culture media (Supplementary Figure 6). We validated the presence of altered lysosome numbers via immunofluorescence (Figure 4c) and flow cytometry (Figure 4d). This demonstrates a dramatic increase in lysosome abundance in response to FAC in both T80 and T80+H-Ras cells. Although there was a small increase in lysosome numbers in TOV21G cells, the FAC-induced changes in HEY was variable (no statistically significant change). Assessment of intracellular iron was performed using calcein AM, which correlated closely to that of lysosomes. Collectively, these results implicate a Ras-independent mechanism in FAC-induced increase of lysosome numbers. As Hsp70 elicits protection against lysosomal membrane permeabillization upon cellular treatment with various agents,16 we assessed whether the reduction of Hsp70 expression via siRNA could modulate lysosome numbers in T80 cells. However, this led to only a subtle reduction in FAC-mediated increase in lysosome abundance, (Figure 4e) suggesting that Hsp70 does not have a major role in mediating FAC-induced changes in lysosome abundance in T80 cells.
Figure 4.
FAC increases lysosome abundance in a Ras-independent manner in T80 cells. (a) T80 cells were treated with 250 μM FAC from 6 to 24 h followed by TEM analyses. Images were captured at × 3530 and × 8730. Blue arrows identify lysosomes. (b) Additional TEM images are shown of T80 cells treated for 24 h, identifying iron particles within the lysosome (yellow arrows). (c) T80, T80+H-Ras, and HEY cells were seeded onto glass coverslips and exposed to a bolus dose of calcein AM followed by 250 μM FAC treatment for 24 h. During the last 1 h of treatment, cells were labeled with Lysotracker red. Cells were imaged using an inverted fluorescent microscope. Results are representative of two independent experiments. (d) T80, T80+H-Ras, TOV21G, and HEY cells were treated with 250 μM FAC for 24 h. During the last 1 h of treatment, cells were labeled with Lysotracker green. Cells were harvested and analyzed by flow cytometry. Data are expressed as the percentage of Lysotracker green-positive cells. Results are representative of two independent experiments. * refers to P<0.05. (e) T80 cells were treated with non-targeting control or Hsp70 siRNA followed by treatment with 250 μM FAC with Lysotracker green, and analyzed by flow (left panel). Protein lysates were also collected and analyzed by western blotting with the indicated antibodies (right panel). Results are representative of two independent experiments
FAC activates the MAPK pathway to modulate autophagy, lysosome abundance, and cell death response
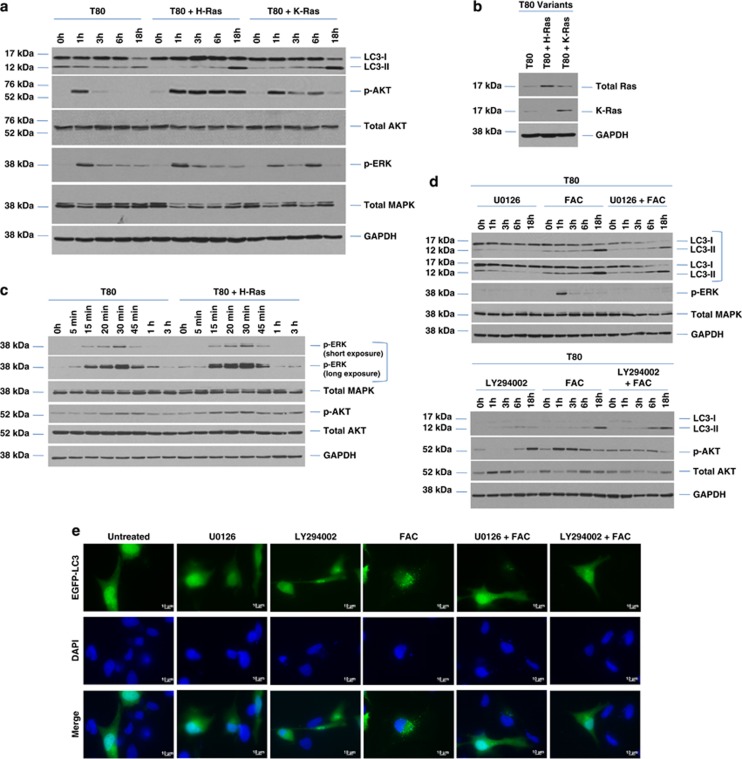
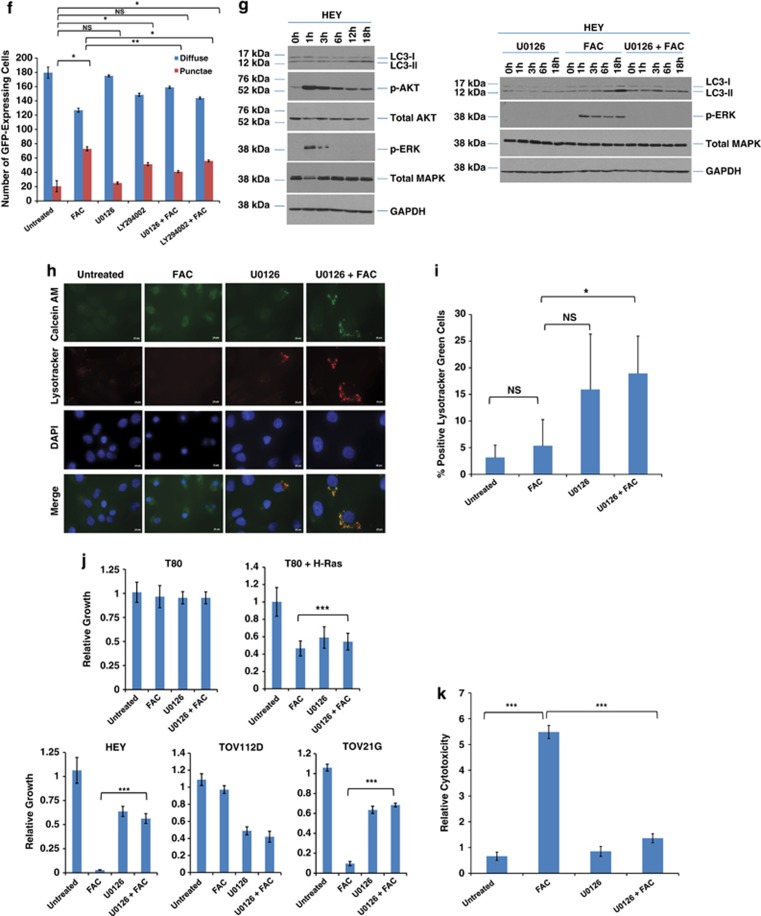
Treatment of T80 cells overexpressing H-Ras or K-Ras with 250 μM FAC demonstrates only a modest increase in the levels of LC3-II in comparison with parental T80 cells (Figures 5a and b). The induction of p-AKT and p-ERK appeared to be only subtly more sustained in the Ras-overexpressing cell lines in response to FAC, (Figures 5a and c) implicating a Ras-independent mechanism in the activation of the PI3K/MAPK signaling cascades. We investigated whether the PI3K/AKT and MAPK signaling cascades could mediate the observed changes in LC3-II expression by using the PI3K inhibitor, LY294002, and the MAPK inhibitor, U0126, in combination with FAC in parental T80 cells. Decreased LC3-II levels were noted following inhibition of the MAPK pathway with U0126 (Figure 5d). In contrast, there was little to no effect with the PI3K/AKT inhibitor in cells cotreated with FAC in contrast to cells treated with FAC alone. This suggests that activation of the MAPK signaling pathway lies upstream of changes in LC3-II expression. This was validated by EGFP–LC3 immunofluorescence (Figures 5e and f). FAC also dramatically activated the MAPK and PI3K pathways in HEY cells (Figure 5g). Inhibition of the MAPK pathway with U0126 altered LC3-II levels in HEY similar to T80 (Figure 5g, right panel). Interestingly, we noted that FAC in combination with U0126 led to a marked increase in lysosome numbers compared with either FAC or U0126 alone (together with increased calcein AM localization to lysosomes) (Figures 5h and i), in contrast to T80, which did not elicit marked changes in lysosome numbers upon cotreatment with U0126 (Supplementary Figure 7). These data implicate the MAPK signaling pathway (independent of Ras, based on data obtained in the T80 cells) in modulating LC3-II levels and lysosome abundance in HEY cells.
Figure 5.
FAC modulates autophagy, lysosome abundance, and cell survival in a MAPK-dependent manner. (a) T80, T80+H-Ras, and T80+K-Ras were treated with 250 μM FAC for the indicated time points (1–18 h). Cell lysates were collected and analyzed by western blotting for the proteins indicated. Results are representative of four independent experiments. (b) Cell lysates collected from T80, T80+H-Ras, and T80+K-Ras followed by western analyses for H-Ras and K-Ras expression. (c) T80 and T80+H-Ras cells were treated with 250 μM FAC for the indicated time points (5 min–3 h). Cell lysates were collected and analyzed by western blotting for the proteins indicated. Results are representative of four independent experiments. (d) Top panel, T80 cells were treated with (1) 10 μM U0126, (2) 250 μM FAC, or (3) 10 μM U0126 and 250 μM FAC for 1–18 h. Cell lysates were harvested and analyzed for the proteins indicated. Results are representative of three independent experiments. Bottom panel, T80 cells were treated with (1) 75 μM LY294002, (2) 250 μM FAC, or (3) 75 μM LY294002 and 250 μM FAC for 1–18 h. Cell lysates were harvested and analyzed for the proteins indicated. Results are representative of three independent experiments. (e) T80 cells were transfected with EGFP–LC3 and treated with (1) 10 μM U0126, (2) 75 μM LY294002, (3) 250 μM FAC, (4) 10 μM U0126 with 250 μM FAC, or (5) 75 μM LY294002 with 250 μM FAC for 18 h. EGFP–LC3 fluorescence was captured using an inverted fluorescence microscope at × 40 magnification. Representative images of experiments conducted in duplicate are shown. (f) results from (e) are shown as the number of cells with punctae quantified by counting 200 cells with >20 punctae. (g) HEY cells were treated with 250 μM FAC (left panel) or in combination with 10 μM U0126 (right panel) for the indicate times followed by western analyses. Results are representative of two independent experiments. (h) HEY cells were seeded onto glass coverslips and exposed to a bolus dose of calcein AM followed by 250 μM FAC treatment in the absence or presence of 10 μM U0126 for 24 h. During the last 1 h of treatment, cells were labeled with Lysotracker red. Cells were imaged using an inverted fluorescent microscope. Results are representative of two independent experiments. (i) HEY cells were treated with 250 μM FAC in the absence or presence of 10 μM U0126 for 24 h. During the last 1 h of treatment, cells were labeled with Lysotracker green. Cells were harvested and analyzed by flow cytometry. Data are expressed as the percentage of Lysotracker green-positive cells. Results are representative of two independent experiments. (j) T80, T80+H-Ras, HEY, TOV112D, and TOV21G cells were treated in combination with 10 μM U0126 and 250 μM FAC compared with either 10 μM U0126 or 250 μM FAC alone. Cell growth was assessed and results shown are representative of two independent experiments. (k) HEY cells were treated with 250 μM FAC in the absence or presence of 10 μM U0126 for 72 h followed by measurement of LDH activity. Results are representative of two independent experiments. * refers to P<0.05
Remarkably, U0126 was able to reverse the cell death effect of FAC in the Ras-overexpressing/mutated cell lines (T80+H-Ras, HEY, and TOV21G but not T80 or TOV112D cells) as assessed in cell viability assays (Figure 5j) and LDH cytotoxicity assays in HEY cells (Figure 5k). These results suggest that the MAPK signaling pathway is essential in modulating cell survival in response to FAC in a Ras-dependent manner.
Involvement of Ras in FAC-induced HO-1 induction and modulation of cell survival
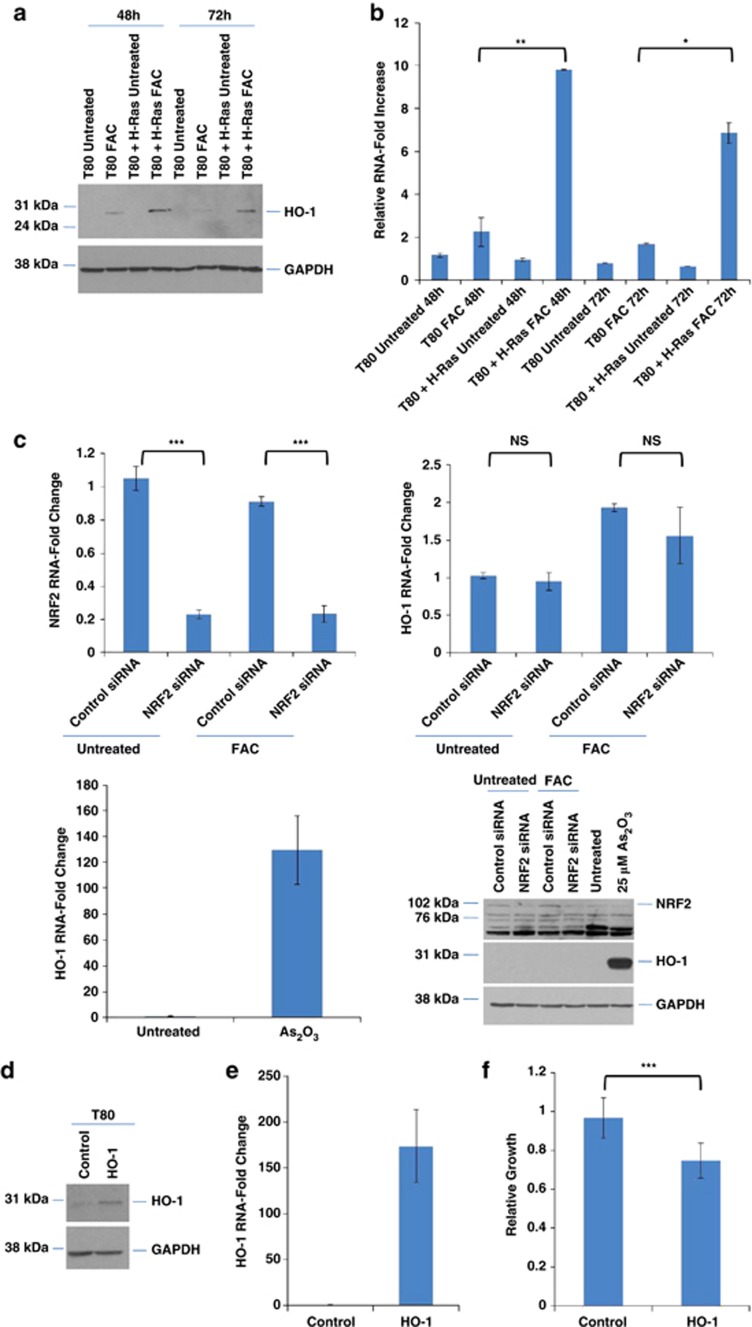
As HO-1 is the rate limiting enzyme that breaks down heme to free iron, we assessed whether HO-1 expression was altered with FAC. When iron was added concurrently upon cell seeding, we observed elevated HO-1 mRNA and protein relative to untreated T80 cells. Further, in T80 cells overexpressing H-Ras, HO-1 induction (mRNA and protein) was significantly greater 48 h post-FAC treatment compared with T80 parental cells (Figures 6a and b). A positive control of arsenic trioxide-treated T80 cells was used to positively identify HO-1 by real-time PCR and western analyses (Figure 6c). As NRF2, a regulator of antioxidant activity, can induce HO-1 expression,17 we next determined whether HO-1 induction via FAC occurred in an NRF2-dependent manner via knockdown of NRF2 in FAC-treated T80 cells. Using real-time PCR, we observed that NRF2 siRNA (knockdown >80% at mRNA and protein level) did not alter FAC-induced activation of HO-1 (Figure 6c). This suggests that the mechanism of HO-1 induction mediated by FAC is dependent on Ras and independent of NRF2.
Figure 6.
FAC modulates HO-1 expression and survival in T80 cells. (a) T80 and T80+H-Ras cells were treated with 250 μM FAC concurrently upon seeding. Cell lysates were harvested 72 h post-seeding and analyzed by western blotting for the proteins indicated. (b) T80 and T80+H-Ras cells were treated with 250 μM FAC concurrently with seeding. RNA was harvested 72 h post-seeding and analyzed by real-time PCR for HO-1 expression. (c) T80 cells were transfected with NRF2 siRNA followed by treatment with 250 μM FAC performed concurrently upon seeding. RNA was isolated and quantified for NRF2 and HO-1 RNA transcripts (top panels). In the lower panels, T80 cells were treated with 10 μM As2O3, RNA isolated following 72 h treatment, and analyzed by real-time PCR for HO-1. Western analysis of NRF2 knockdown is shown in the bottom right panel. Results are representative of four independent experiments. (d) HO-1 retroviral stable cell lines were generated in T80 cells. Cell lysates were harvested and analyzed for HO-1 expression with GAPDH as a loading control. (e) RNA was isolated from T80 retroviral stable cells overexpressing HO-1. Real-time PCR was performed to quantify HO-1 mRNA levels. (f) Both HO-1 and vector control retroviral stable T80 cells were assessed for relative growth. Results shown are representative of four independent experiments. * refers to P<0.05
To understand the functional role elicited by HO-1 induction, we generated retroviral stable cell lines overexpressing HO-1 in T80 cells (Figures 6d and e). Although adhesion assays did not show significant changes in cell attachment or in PXDN (marker of cell adhesion) upon HO-1 overexpression in T80 cells (results not shown), growth assays implicated HO-1 in inhibition of cell survival (Figure 6f).
Imbalance of intracellular iron levels mediates cell death responses
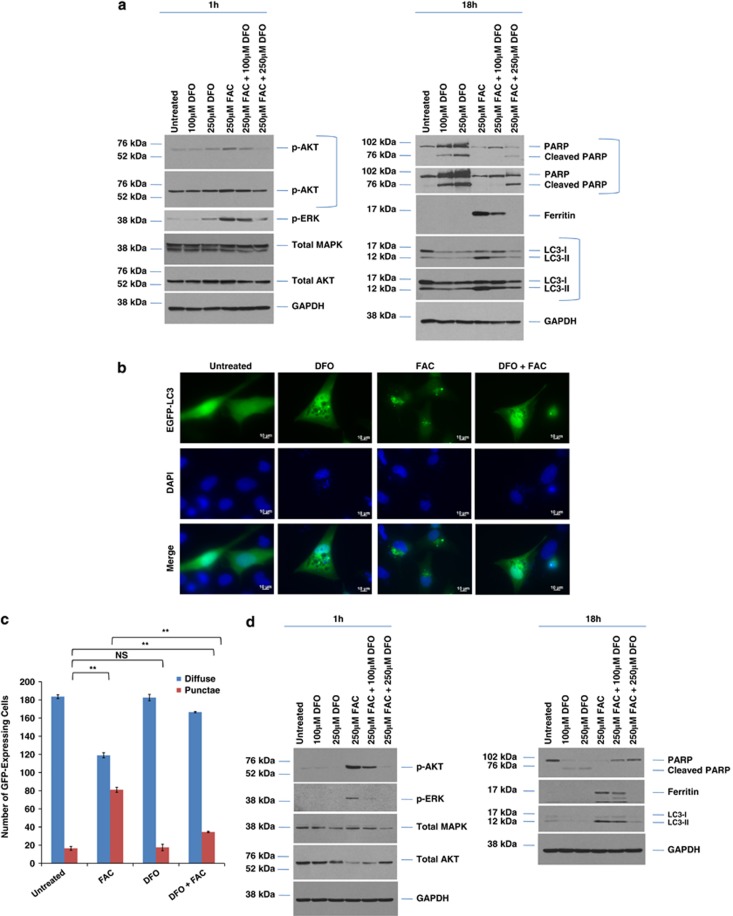
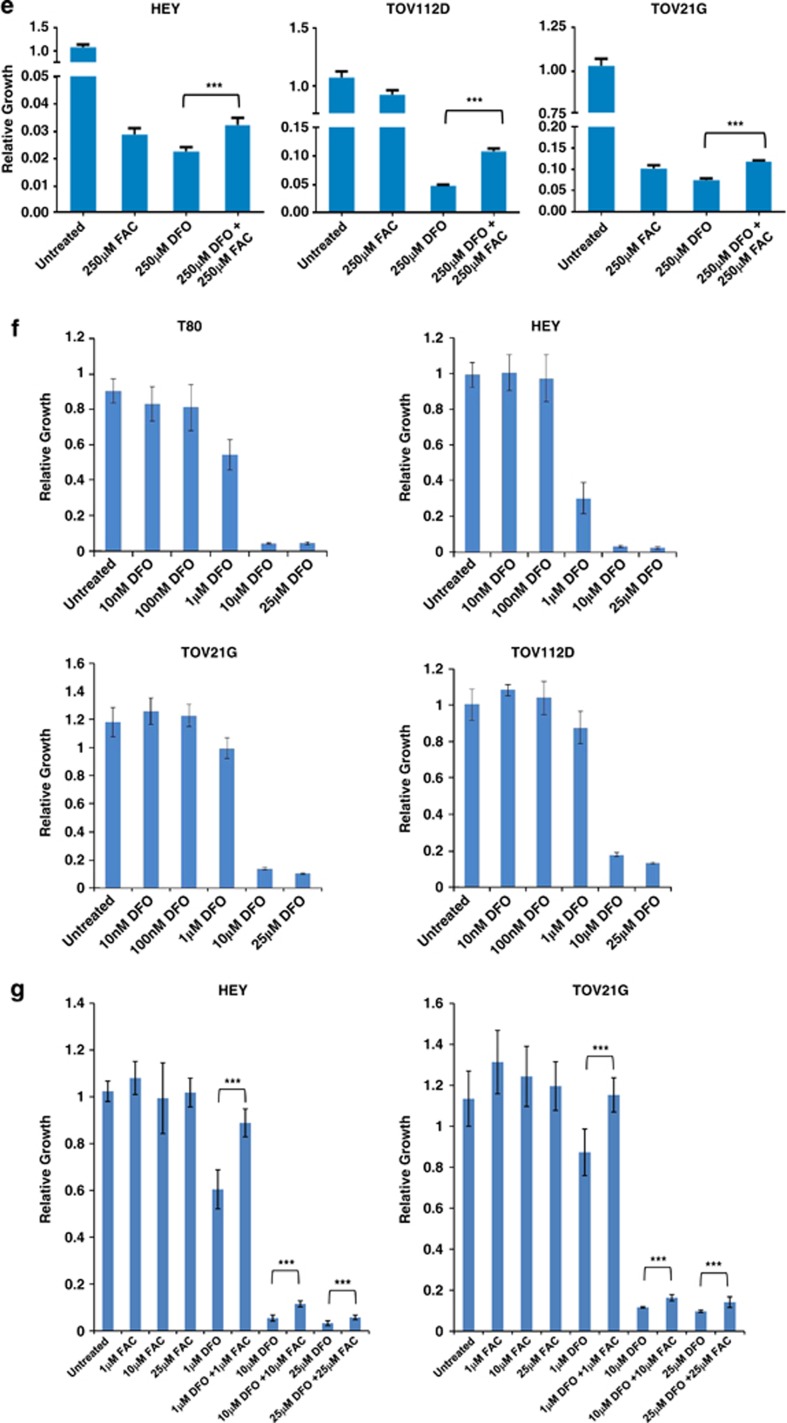
Maintaining appropriate cellular iron balance (cellular elimination and absorption18) is essential to prevent toxicity due to its excessive accumulation. To determine whether disruption of intracellular iron levels leads to altered cell survival, we utilized DFO (a membrane permeable iron chelator) to inhibit the activity of iron. We found that DFO reversed FAC-induced increase in LC3-II at 18 h and early activation of p-AKT (1 h) (Figure 7a). The cellular morphology reverted to normal when DFO was utilized at a 1 : 1 ratio with FAC. Although we noted a marked reduction in cleaved poly ADP-ribose polymerase (PARP) when DFO (Figure 7a) was added concurrently with FAC, there was only a subtle change in overall cell survival in T80 cells (Supplementary Figure 8). We validated these LC3-II changes by EGFP–LC3 immunofluorescence (Figures 7b and c). The data shows that DFO reverses punctae formation induced by FAC. Like the T80 results presented in Figure 7a, changes in LC3-II, p-AKT, and p-ERK were similarly observed in HEY in response to DFO in the absence/presence of FAC (Figure 7d). Strikingly, DFO markedly affected cell survival in multiple ovarian cancer cell lines (Figures 7e–g). Collectively, these results suggest that disruption of intracellular iron is detrimental to cell survival; further, the addition of equimolar equivalents of FAC to DFO can partially oppose the cell death-inducing effect of the iron chelating agent.
Figure 7.
FAC antagonizes the reduction in cell survival induced by DFO, an iron chelating agent, in ovarian cancer cells. (a) T80 cells were treated with (1) 100 μM DFO, (2) 250 μM DFO, (3) 250 μM FAC, (4) 250 μM FAC with 100 μM DFO, or (5) 250 μM FAC with 250 μM DFO for 1 or 18 h. Cell lysates were harvested and analyzed by western blotting for the indicated proteins. Results are representative of two independent experiments. (b) T80 cells were transfected with EGFP–LC3 and treated with (1) 250 μM DFO, (2) 250 μM FAC, or (3) 250 μM DFO with 250 μM FAC for 18 h. EGFP–LC3 fluorescence was captured using an inverted fluorescence microscope at × 40 magnification. Representative images of experiments conducted in duplicate are shown. (c) Results from (b) are shown as the number of cells with punctae quantified by counting 200 cells with >20 punctae. (d) HEY cells were treated with (1) 100 μM DFO, (2) 250 μM DFO, (3) 250 μM FAC, (4) 250 μM FAC with 100 μM DFO, or (5) 250 μM FAC with 250 μM DFO for 1 or 18 h. Cell lysates were harvested and analyzed by western blotting for the indicated proteins. Results are representative of two independent experiments. (e) HEY, TOV112D, and TOV21G cells were treated with (1) 250 μM DFO alone, (2) 250 μM FAC alone, or (3) 250 μM DFO and 250 μM FAC. Cell growth was assessed. Results are representative of two independent experiments. (f) T80, HEY, TOV21G, and TOV112D cells were treated with increasing doses of DFO (1 nM–25 μM). Cellular survival was assessed and results are shown as relative growth. Results are representative of two independent experiments. (g) HEY and TOV21G cells were treated in combination with 1–25 μM DFO and 1–25 μM FAC compared with either 1–25 μM DFO or 1–25 μM FAC alone. Cell growth was assessed. Results shown are representative of two independent experiments. * refers to P<0.05
Discussion
Iron is an essential element needed to modulate multiple cellular functions to sustain tumor growth. This important nutrient is elevated in cystic fluid of endometriosis-associated ovarian cancers, a potential cause of clear cell cancer development via persistent oxidative stress.3, 4 Although reports indicate that cancer cell lines respond to iron with increased proliferative indices, we demonstrate that iron is detrimental to the survival of ovarian cancer cells associated with Ras mutations (Figure 8). Although the frequency of Ras mutations in ovarian cancers is variable owing to the heterogeneity of this disease, we propose that cellular sensitivity towards iron may be a novel targeting strategy. Maintaining appropriate cellular iron levels is critical; indeed, the use of DFO, an iron chelating agent, induces apoptotic cell death in ovarian cells similar to that reported.19
Figure 8.
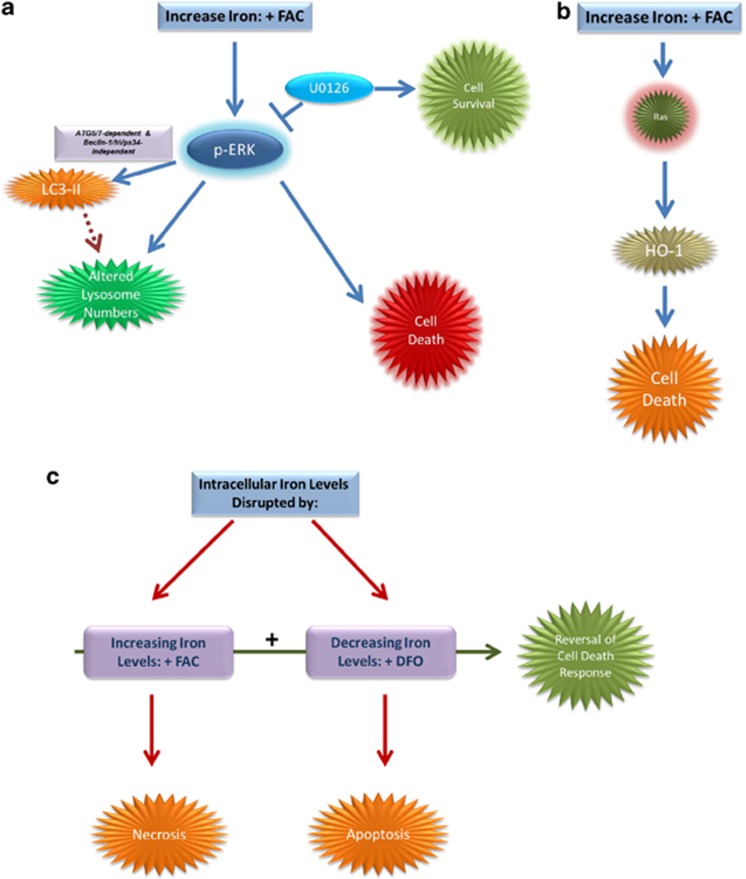
Proposed model of iron-induced effects in gynecological cells. (a) FAC treatment leads to the activation of MAPK through which it mediates effects on LC3-II/autophagy in an ATG5/7-dependent, beclin-1/hVps34-independent, and Ras-independent manner. In addition, FAC modulates lysosome abundance in a Ras-independent pathway. Further, reduction of the cell death response was altered by U0126, an inhibitor of MAPK. (b) Ras-dependent changes in HO-1 were observed in T80 cells treated with FAC. HO-1 overexpression leads to decreased cell survival in T80 cells. (c) In HEY cells, DFO (an iron chelating agent) leads to induction of apoptosis, whereas FAC induces a necrotic cell death response. Increased cell survival was observed upon cotreatment of FAC and DFO in HEY, TOV21G, and TOV112D cells
The nature of the reduced survival induced by FAC in the sensitive cell lines appeared diverse. Although FAC induced necrosis in HEY, the nature of the reduced survival in TOV21G needs further investigation. In this respect, it is interesting that ferroptosis (a novel regulated cell death mechanism induced by erastin that targets iron-regulatory protein 2, which controls the translation of mRNAs involved in iron homeostasis)6 selectively kills cells expressing oncogenic mutants of Ras. Ferroptosis is dependent on iron, ROS, NADPH-dependent oxidases, lipid peroxidation, and presence of electron-dense mitochondria, whereas it is independent of caspase activation.6 Although our results with ferrostatin-1, an inhibitor of ferroptosis, indicate a modest effect on LC3-II levels and EGFP–LC3 punctae formation (Supplementary Figure 9a-9c), it remains to be determined whether this pathway modulates FAC-induced cell death response in ovarian cells.
We demonstrate that the MAPK signaling pathway is essential in modulating FAC-induced cell survival response in Ras-overexpressing/mutated cell lines. HEY and TOV21G have reduced p66 Shc levels (and activating Ras mutations and high basal LC3-II levels (Supplementary Figure 4)) in contrast to TOV112D, T80, and IE cells (Supplementary Figure 3). Upstream of MAPK, p66 Shc opposes the activity of Ras to control proliferation and anchorage-dependent responsiveness.20 Although Shc siRNA did not alter LC3-II levels or cell survival in T80 cells (results not shown), Ras hyperactivation via mutation or overexpression in T80 cells leads to increased cell death similar to that observed in tetracycline-inducible H-RasV12 HOSE cells.21
In addition, we report altered autophagic flux and lysosome numbers, occurring in a Ras-independent manner, in response to FAC. The marked increase in lysosome abundance in T80 and T80+H-Ras cells, but not in HEY/TOV21G cells could implicate an aberration in the lysosomal membranes of HEY/TOV21G cells. HEY are particularly vulnerable to FAC (necrotic response). Entry of ferritin into lysosomes may occur in an autophagy-dependent manner leading to the accumulation of redox-active iron within lysosomes.22 If lysosomes become destabilized, membrane damage and release of redox-active iron into the cytosol may ensue, leading to cellular damage via Fenton-type reactions, and thus cell death. However, knockdown of Hsp70 in T80 did not significantly reduce lysosome numbers without any effect on survival potential in response to iron. As there was only a modest reversal effect on FAC-induced cell death in HEY when ATG5/ATG7 expression was reduced, other mechanisms could compensate for the reduction in macroautophagy including chaperone-mediated autophagy or microautophagy for the movement of iron into the lysosomal compartment.
We also identified that HO-1 was elevated with FAC in T80 cells with H-Ras overexpression relative to parental T80 and that HO-1 overexpression in T80 reduces growth potential. These results support findings in the lung cancer A549 and kidney LLC-PK1 cells.23, 24 We further demonstrate that transcriptional regulation of HO-1 expression occurs via an NRF2-independent manner similar to human keratinocytes.25 Although HO-1 overexpression in BeWo choriocarcinoma cells increased tumor cell adhesion and expression of PXDN,26 we did not observe marked changes in PXDN or adhesion function with HO-1 overexpression in T80 cells.
The results presented herein can be classified into four major categories: (1) Ras-dependent, (2) Ras-independent, (3) MAPK-dependent, and (4) Ras- and MAPK-dependent (Supplementary Figure 10). In support of the discordance in our results between Ras and the MAPK signaling cascade, there are reports of Ras-independent activation of MAP kinase: (1) calcium-induced differentiation of keratinocytes mediated via Ras-independent activation of the Raf/MEK/ERK pathway,27 (2) Ras-independent activation of the MAPK signaling pathway during cardiomyocyte stretch response,28 and (3) leukotriene D4 Ras-independent/PKCɛ-dependent activation of MAPK in intestinal epithelial cells.29 Both HEY and TOV21G are reported to have Ras mutations; however, these cell lines (and TOV112D) are likely to contain mutations in additional oncogenes (including PI3K) that may have a role in FAC-mediated cellular responses. Thus, although our studies focus on Ras/MAPK signaling, other cascades may likely contribute to FAC-induced responses. This is currently being investigated using a proteomic profiling (reverse phase protein array) approach (Bauckman et al., unpublished observations).
Materials and Methods
Cell lines
HEY ovarian carcinoma cells and T80 immortalized (LTAg/hTERT) normal ovarian surface epithelial cells (kindly provided by Dr. Gordon Mills, MD Anderson Cancer Center, Houston, TX, USA) were maintained in RPMI 1640 supplemented in 8% FBS and penicillin/streptomycin. T80 cells overexpressing H-Ras or K-Ras (kindly provided by Dr. Jinsong Liu (MD Anderson Cancer Center), and Dr. Gordon Mills (MD Anderson Cancer Center)) were maintained in RPMI 1640 in 8% FBS and penicillin/streptomycin. TOV112D endometrioid ovarian carcinoma cells (obtained from ATCC, Manassas, VA, USA) and TOV21G CCC cells (kindly provided by Dr. Jonathan Lancaster, Moffitt Cancer Center, Tampa, FL, USA) were maintained in MCDB131:Medium 199 (1 : 1 ratio) supplemented with 8% FBS and penicillin/streptomycin. HES normal endometrial epithelial cell line (kindly provided by Dr. Douglas Kniss, Ohio State University Medical Center, Columbus, OH, USA) was maintained in DMEM (high glucose) supplemented in 8% FBS and penicillin/streptomycin. The HES cell line, although considered a normal endometrial line, has recently been identified to express markers present in HeLa cells.10 All cell lines were tested to be mycoplasma negative before use in the studies reported herein.
Immortalization of primary endometriotic cells
Primary endometriotic cells derived from endometriotic lesions were obtained from Dr. Idhaliz Flores (PSMHS, Ponce, Puerto Rico) and grown in MCDB131:Medium 199 (1 : 1 ratio) supplemented with 8% FBS, penicillin/streptomycin, and insulin/transferrin/selenium (ITS) (Bello et al., unpublished data). To generate SV40 LTAg immortalized endometriotic (IE) cell lines, we obtained the LTAg-pBABE-puro vector (Addgene, Cambridge, MA, USA). We generated retroviral particles using HEK293T packaging cells transfected with this vector in combination with pCGP and pVSVG vectors. Forty-eight and 72 h post-transfection, retroviral particles were collected and used to infect the primary cells. Infected primary cells were then treated with puromycin-containing media (2.5 μg/ml) to select for resistant colonies. These colonies developed ∼1 month following puromycin selection. Six clones were isolated, expanded, and validated. The IE were maintained in MCDB131:Medium 199 (1 : 1 ratio) supplemented with 8% FBS and penicillin/streptomycin. The characteristics of the primary and immortalized IE cells were validated by western blotting for LTAg and by immunocytochemical staining for cytokeratin 18 (positive) and for vimentin (negative) (Bello et al., unpublished data).
Isolation of genomic DNA from IE cells
IE cells were grown to confluence (P=3 following immortalization) in a T25 flask from which genomic DNA was isolated. The genomic DNA DNeasy Blood and Tissue kit from Qiagen (Valencia, CA, USA) was utilized.
Detection of mutations in PIK3CA and K-Ras in IE cells by genomic PCR-sequencing
PCR conditions were as follows: 94 °C for 2 min, 40 cycles of 94 °C for 1 min, 45 °C for 1 min, 68 °C for 1 min, and final extension at 72 °C for 10 min. PCR products were run on a 1.5% agarose gel and appropriate bands were gel purified (Qiagen) and sequenced (Moffitt Cancer Center, Molecular Biology Core).
PIK3CA exon 20 forward: 5′-TTGATGACATTGCATACATTCG-3′
PIK3CA exon 20 reverse: 5′-AATTGTGTGGAAGATCCAATCC-3′
PIK3CA exon 9 forward: 5′-GAATCCAGAGGGGAAAAA-3′
PIK3CA exon 9 reverse: 5′-CCATTTTAGCACTTACCTGTG-3′
K-Ras forward primer: 5′-GCCTGCTGAAAATGACTGAA-3′
K-Ras reverse primer: 5′-GTTGGATCATATTCGTCCACA-3′
Cloning of HO-1
RNA from T80 cells was isolated using the RNeasy kit (Qiagen) and quantified using Nanodrop. PCR was performed using the following forward and reverse primers:
Forward primer: 5′-GGAATTCACCATGGAGCGTCCGCAAC-3′
Reverse primer: 5′-GGAATTCTCACATGGCATAAAGC-3′
PCR conditions were as follows: 48 °C for 30 min, 94 °C for 2 min, 40 cycles of denaturation at 94 °C for 1 min, annealing at 60 °C for 1 min, extension at 68 °C for 5 min, and final extension at 72 °C for 15 min. The PCR product was cloned into the pTOPO vector (Invitrogen, Carlsbad, CA, USA), positive clones selected by restriction enzyme digestion with EcoRI, and sequenced using M13 Forward and M13 Reverse primers (Moffitt Cancer Center, Molecular Biology Core). Once a positive clone was identified, the insert was digested overnight with EcoRI together with empty pBABE-puro plasmid. Insert was gel purified whereas the vector was dephosphorylated using Antarctic Acid Phosphatase (NEB, Ipswich, MA, USA). Insert was then ligated to the dephosphorylated vector using T4 Quick DNA Ligase (NEB). Positive clones were selected by restriction enzyme digestion and sequencing. High quality plasmid was obtained by Maxi Large Plasmid Preparation (Qiagen).
Generation of HO-1 overexpression and ATG5 shRNA retroviral stable cell lines
HO-1 retroviral stable cell lines were generated in T80 cells. HEK293T packaging cells were utilized to generate replication defective viruses. pSUPER control and ATG5 shRNA (two distinct shRNAi targeting ATG5: H2 and H7) retroviral plasmid constructs were generously provided by Xiao-Feng Zhu (State Key Laboratory of Oncology in South China, Guangzhou, China). ATG5 shRNA was utilized to attempt knockdown of endogenous ATG5 in HEY, T80, TOV112D, and TOV21G cell lines. Using HEK293T packaging cells, ATG5 shRNA was transfected together with pCGP and pVSVG vectors using Fugene HD (Roche, Indianapolis, IN, USA). Forty-eight and 72 h post-transfection, retroviral particles were collected and used to infect the ovarian cells. Infected cells were then treated with puromycin-containing media (2 μg/ml for HEY, 1 μg/ml for T80, 2 μg/ml for TOV112D, and 2 μg/ml for TOV21G) to obtain retroviral parental cell populations. Positive knockdown of ATG5 protein expression was validated by western analyses. HO-1 overexpression was validated by both real-time PCR and western analyses.
Cellular treatments with inhibitors
Chloroquine (Fisher Scientific, Pittsburgh, PA, USA)(12.5 or 25 μM) was dissolved in tissue culture-grade water. Ferric ammonium citrate (Fisher Scientific) was utilized between 5μM to 10mM and dissolved in tissue culture-grade water. Deferoxamine mesylate (Sigma-Aldrich, St. Louis, MO, USA) was used between 1 nM to 250 μM, and dissolved in tissue culture-grade water. Ferrostatin (no. 9065366, C15H22N2O2, ChemBridge, San Diego, CA, USA) was used at 100 μM and dissolved in dimethylsulfoxide (DMSO). U0126 and LY294002 were obtained from Cell Signaling Technology (Danvers, MA, USA) and used at doses of 10 μM and 75 μM, respectively (dissolved in DMSO).
Cellular treatments with siRNA
T80 cells were seeded at 325 000 cells per well in a 6-well plate. Following overnight adherence, cells were transfected with siRNA targeting NRF2 (L-003755-00), ATG6/beclin-1 (L-010552-22), ATG7 (L-020112-00), hVps34 (L-005250-00), H-Ras (L-004142-00), K-Ras (L-005069-00), Hsp70 (L-021084-01), or non-targeting ON-TargetPLUS control (D-001810-10) with Dharmafect I (ThermoScientific, Pittsburgh, PA, USA) using methods previously described. ShcA p66 siRNA was custom designed based on a published sequence towards its CH2 domain.30 The sense sequence is 5′-GAAUGAGUCUCUGUCAUCGUU-3′ and antisense sequence is 5′-CGAUGACAGAGACUCAUUCUU-3′. The siRNA transfection method was followed according to our previously published studies.31 For NRF2 siRNA studies, cells were trypsinized and reseeded in media containing FAC (250 μM) and cultured for 48 h before RNA and protein harvest for quantitative polymerase chain reaction (qPCR) and western analyses, respectively.
Protein isolation, SDS-PAGE, and western blot analyses
Protein isolation and western blot analyses were performed according to previously published methods.31 Primary antibodies were used at the following dilutions. LC3B rabbit polyclonal (no. 2775, 1 : 1000), p-AKT (Ser473) rabbit polyclonal (no. 4060, 1 : 1000), p-ERK 1/2 rabbit polyclonal (no. 9101, 1 : 1000), total AKT rabbit polyclonal (no. 4685, 1 : 1000), total MAPK rabbit polyclonal (no. 4695, 1 : 1000), ATG5 rabbit polyclonal (no. 2630, 1 : 1000), HO-1 rabbit polyclonal (no. 5061, 1 : 100), GAPDH rabbit polyclonal (no. 2118, 1 : 4000), FTH1 (ferritin) rabbit polyclonal (no. 3998, 1 : 1000), NRF2 rabbit monoclonal (no. 8882, 1 : 1000), total Ras rabbit monoclonal (no. 3339, 1 : 1000), PARP rabbit polyclonal (no. 9542, 1 : 1000), LAMP-1 rabbit monoclonal (no. 9091, 1 : 1000), Beclin-1 rabbit polyclonal (no. 3738, 1 : 1000), and hVps34 rabbit polyclonal (no. 3358, 1 : 1000) antibodies were obtained from Cell Signaling Technology. Shc rabbit polyclonal (no. 06-203, 1 : 1000) antibody was obtained from Millipore (Billerica, MA, USA). CD71 mouse monoclonal antibody (2B6, transferrin receptor, sc-51829, 1 : 1000) and K-Ras mouse monoclonal (F234, sc-30, 1 : 100) antibodies were obtained from Santa Cruz Biotechnology (Santa Cruz, CA, USA). ATG7 rabbit polyclonal (1 : 1000) antibody was obtained from MBL International (Woburn, MA, USA). p62 mouse monoclonal (1 : 1000) antibody was obtained from BD Biosciences (San Jose, CA, USA). Hsp70 mouse monoclonal (SMC-100, 1 : 1000) antibody was obtained from StressMarq (Victoria, BC, Canada).
RNA isolation and quantitative polymerase chain reaction
Total RNA was isolated using the RNeasy Mini Kit (Qiagen). HO-1 (HMOX, Hs01110250_m1) or NRF2 (NFE2L2, Hs00975961_g1) and One-step master mix (Applied Biosystems, Foster City, CA, USA) was used in qPCR using previously described PCR conditions.31 Results were analyzed by the comparative method using untreated cells as the reference sample and β-actin for normalization. RNA-fold changes were calculated using the following formula: 2−ΔΔCT.
Direct and indirect immunofluorescence
Cells were seeded onto coverslips and allowed to adhere following overnight incubation. Cells were then transfected with EGFP–LC3 (Addgene, Cambridge, MA, USA) and prepared for direct immunofluorescence according to previously published methods.31 The cells were viewed under a Zeiss inverted fluorescence microscope (Carl Zeiss Incorporated, Thornwood, NY, USA) at the Microscopy Core at the Moffitt Cancer Center. Quantification of EGFP–LC3 expressing cells was performed by counting the number of cells expressing a punctate pattern in a total of 200 EGFP–LC3-positive cells (at least 20 punctae).
Transmission electron microscopy
Matched cultures of control and experimental cells grown to confluence, exposed to FAC at 0, 6, 18, and 24 h, were submitted for TEM. The samples were fixed in 0.1 M phosphate buffered 2.5% glutaraldehyde overnight, post-fixed for 1 h in buffered 1% osmium tetroxide, dehydrated in a graded series of acetone, and embedded in LX 112 epoxy resin. Following polymerization, thin sections obtained from blocks of the samples were stained with 8% aqueous uranyl acetate and Reynold's lead citrate, then observed and photographed on an FEI Morgagni 268D (FEI Company, Inc, Hillsboro, OR, USA) TEM at various magnifications.
Cell cycle analysis
Cell cycle analysis was performed utilizing propidium iodide with 0.01% Triton X-100 and 2 mg of DNAse-free RNAse A followed by analysis by flow cytometry (College of Medicine, University of South Florida, Tampa, FL, USA).
Intracellular ATP measurements
For Cell Titer Glo assays, cells were seeded at 5000 cells/well (IE, HES, and TOV112D, and TOV21G) or 2500 cells/well (T80, HEY, and H460) in white opaque 96-well plates followed by cellular treatment with 250 μM FAC. ATP levels were measured according to manufacturer's instructions (Promega, Madison, WI, USA).
Wound healing assays
This assay was performed using the CytoSelect 24-well plate (Cell Biolabs, San Diego, CA, USA). Briefly, cells were seeded at 250 000 (T80), 500 000 (TOV112D, TOV21G, and T80+H-Ras), 400 000 (T80+K-Ras), and 200 000 (HEY) cells. Following cellular adherence and scratching of the monolayer, the cells were then treated with 250 μM FAC for 18 h followed by cell staining and image analyses.
Growth assays
For colony formation assays, cells were seeded at 500 cells/well in a 6-well plate. Following cell adherence, cells were treated in the presence or absence of 25 μM CQ. Plates were then stained with crystal violet following an ∼2 week period.
For standard growth assays, cells were seeded at 5000 cells/well (IE, HES, TOV112D, and TOV21G) or 2500 cells/well (T80 and HEY) in 96-well plates. Following cell adherence, cells were treated appropriately. Plates were stained at appropriate selected times with crystal violet and quantified at 570 nm upon dissolution in Sorenson's buffer.
Calcein AM
This protocol was followed according to published methods with modifications.32 Briefly, before cellular treatment with FAC, the media was removed and 1 ml of a 0.15 μM Calcein AM (Invitrogen, Grand Island, NY, USA) prepared in 1 mg/ml BSA, 20 mM Hepes, and phosphate-buffered saline (PBS) was added to cells grown in six-well plates. Cells were then treated for 15 min at 37 °C. Cells were washed and then treated with FAC for the desired time period. BD LSRII set at a 488 nm excitation and 530/30 emission wavelength was utilized with BD FacsDiva 6.1.3 software for recording and analysis.
Quantification of lysosomes
For immunofluorescence staining, cells were seeded onto glass coverslips, allowed to adhere, and then treated with 250 μM FAC for 24 h. Lysotracker red (Invitrogen) was added (75 nM) 1 h before completion of FAC treatment. For flow analysis, cells were plated into 6-well plates, allowed to adhere, followed by FAC treatment. At 1 h before completion, media was removed and replaced with warm media containing a 75 nM of Lysotracker green (Invitrogen). Cells were then trypsinized and resuspended in PBS followed by flow cytometry. BD LSRII with 488 nm excitation and 530/30 emission were used together with software for recording and analysis (BD FacsDiva 6.1.3).
LDH assays
Cells were plated in 96-well plates at a cell density of 2500 in 1% FBS-containing media. The day following seeding, cells were overlayed with media containing 250 μM FAC in 1% FBS-containing media. After 72 h treatment, plates were spun down, followed by removal of 100 μl of culture media from each well, which was transferred to a new 96-well plate, to which 100 μl of LDH reaction mixture (Fisher Scientific) was added. Samples were then incubated for 30 min followed by acquisition of LDH measurements at 490 nm. Relative cytotoxicity measurements were determined by subtracting the background (1% FBS media only) from each experimental sample.
Annexin V/PI apoptosis assays
Annexin V/PI staining (Calbiochem, San Diego, CA, USA) was performed according to our previous publication.31 The samples were analyzed by flow cytometry at the University of South Florida Health—College of Medicine FACS Core Facility.
Senescence assays
Measurement of β-galactosidase senescence activity was performed according to manufacturer's protocol (Cell Signaling Technology).
Statistical analyses
Experimental replicates were conducted as indicated in each figure legend presented. Error bars displayed on the bar graphs represent S.D. P-values were calculated using Prism (standard Student's t-test). NS refers to not significant P-values (P>0.05); * refers to P<0.05; ** refers to P<0.01; *** refers to P<0.0001.
Acknowledgments
This work was supported by funds from the National Institute of Health RO1 CA 123219, University of South Florida Start-up Funds, a Marsha Rivkin Pilot Project Award, and the Braverman/Rudnick Family Grant in Ovarian Cancer Research to Meera Nanjundan. This work has also been supported in part by the Flow Cytometry Core Facility at the College of Medicine, University of South Florida. We thank Stephanie Rockfield for assistance with the cloning of HO-1, figure preparation, and for critical reading of the manuscript. In addition, we thank Katherine Allen for assistance in figure preparation.
Glossary
- LC3
microtubule associated light chain 1
- FAC
ferric ammonium citrate
- HO-1
heme oxygenase-1
- DFO
deferoxamine
- ROS
reactive oxygen species
- T80
immortalized normal ovarian surface epithelial cells
- IE
immortalized endometriotic epithelial cells
- CQ
chloroquine
- HES
human epithelial endometrial cells
- EGFP
enhanced green fluorescent protein
- TEM
transmission electron microscopy
- Ferr-1
ferrostatin-1
- PARP
poly ADP-ribose polymerase
- NRF2
nuclear factor (erythoid-derived 2) like 2
- LTAg
Large T antigen
- PIK3CA
PI3K catalytic subunit
- IRB2
iron-regulatory protein 2
- MAPK
mitogen-activated protein kinase
The authors declare no conflict of interest.
Footnotes
Supplementary Information accompanies this paper on Cell Death and Disease website (http://www.nature.com/cddis)
Edited by G Raschella
Supplementary Material
References
- Bast RC, Jr., Hennessy B, Mills GB. The biology of ovarian cancer: new opportunities for translation. Nat Rev Cancer. 2009;9:415–428. doi: 10.1038/nrc2644. [DOI] [PMC free article] [PubMed] [Google Scholar]
- Gibson SB. Autophagy in clear cell ovarian cancer, a potential marker for hypoxia and poor prognosis. J Pathol. 2012;228:434–436. doi: 10.1002/path.4100. [DOI] [PubMed] [Google Scholar]
- Yamaguchi K, Mandai M, Toyokuni S, Hamanishi J, Higuchi T, Takakura K, et al. Contents of endometriotic cysts, especially the high concentration of free iron, are a possible cause of carcinogenesis in the cysts through the iron-induced persistent oxidative stress. Clin Cancer Res. 2008;14:32–40. doi: 10.1158/1078-0432.CCR-07-1614. [DOI] [PubMed] [Google Scholar]
- Yamada Y, Shigetomi H, Onogi A, Haruta S, Kawaguchi R, Yoshida S, et al. Redox-active iron-induced oxidative stress in the pathogenesis of clear cell carcinoma of the ovary. Int J Gynecol Cancer. 2011;21:1200–1207. doi: 10.1097/IGC.0b013e318222cfdd. [DOI] [PubMed] [Google Scholar]
- Yamaguchi K, Mandai M, Oura T, Matsumura N, Hamanishi J, Baba T, et al. Identification of an ovarian clear cell carcinoma gene signature that reflects inherent disease biology and the carcinogenic processes. Oncogene. 2010;29:1741–1752. doi: 10.1038/onc.2009.470. [DOI] [PubMed] [Google Scholar]
- Dixon SJ, Lemberg KM, Lamprecht MR, Skouta R, Zaitsev EM, Gleason CE, et al. Ferroptosis: an iron-dependent form of nonapoptotic cell death. Cell. 2012;149:1060–1072. doi: 10.1016/j.cell.2012.03.042. [DOI] [PMC free article] [PubMed] [Google Scholar]
- Spowart JE, Townsend KN, Huwait H, Eshragh S, West NR, Ries JN, et al. The autophagy protein LC3A correlates with hypoxia and is a prognostic marker of patient survival in clear cell ovarian cancer. J Pathol. 2012;228:437–447. doi: 10.1002/path.4090. [DOI] [PubMed] [Google Scholar]
- Chen Y, Klionsky DJ. The regulation of autophagy—unanswered questions. J Cell Sci. 2011;124 (Pt 2:161–170. doi: 10.1242/jcs.064576. [DOI] [PMC free article] [PubMed] [Google Scholar]
- Liu J, Yang G, Thompson-Lanza JA, Glassman A, Hayes K, Patterson A, et al. A genetically defined model for human ovarian cancer. Cancer Res. 2004;64:1655–1663. doi: 10.1158/0008-5472.can-03-3380. [DOI] [PubMed] [Google Scholar]
- Korch C, Spillman MA, Jackson TA, Jacobsen BM, Murphy SK, Lessey BA, et al. DNA profiling analysis of endometrial and ovarian cell lines reveals misidentification, redundancy and contamination. Gynecol Oncol. 2012;127:241–248. doi: 10.1016/j.ygyno.2012.06.017. [DOI] [PMC free article] [PubMed] [Google Scholar]
- Samouelian V, Maugard CM, Jolicoeur M, Bertrand R, Arcand SL, Tonin PN, et al. Chemosensitivity and radiosensitivity profiles of four new human epithelial ovarian cancer cell lines exhibiting genetic alterations in BRCA2, TGFbeta-RII, KRAS2, TP53 and/or CDNK2A. Cancer Chemother Pharmacol. 2004;54:497–504. doi: 10.1007/s00280-004-0843-9. [DOI] [PubMed] [Google Scholar]
- Liu G, Yang G, Chang B, Mercado-Uribe I, Huang M, Zheng J, et al. Stanniocalcin 1 and ovarian tumorigenesis. J Natl Cancer Inst. 2010;102:812–827. doi: 10.1093/jnci/djq127. [DOI] [PMC free article] [PubMed] [Google Scholar]
- Moscat J, Diaz-Meco MT. p62: a versatile multitasker takes on cancer. Trends Biochem Sci. 2012;37:230–236. doi: 10.1016/j.tibs.2012.02.008. [DOI] [PMC free article] [PubMed] [Google Scholar]
- Komatsu M, Kageyama S, Ichimura Y. p62/SQSTM1/A170: physiology and pathology. Pharmacol Res. 2012;66:457–462. doi: 10.1016/j.phrs.2012.07.004. [DOI] [PubMed] [Google Scholar]
- Ni HM, Bockus A, Wozniak AL, Jones K, Weinman S, Yin XM, et al. Dissecting the dynamic turnover of GFP-LC3 in the autolysosome. Autophagy. 2011;7:188–204. doi: 10.4161/auto.7.2.14181. [DOI] [PMC free article] [PubMed] [Google Scholar]
- Nylandsted J, Gyrd-Hansen M, Danielewicz A, Fehrenbacher N, Lademann U, Hoyer-Hansen M, et al. Heat shock protein 70 promotes cell survival by inhibiting lysosomal membrane permeabilization. J Exp Med. 2004;200:425–435. doi: 10.1084/jem.20040531. [DOI] [PMC free article] [PubMed] [Google Scholar]
- Banerjee P, Basu A, Datta D, Gasser M, Waaga-Gasser AM, Pal S. The heme oxygenase-1 protein is overexpressed in human renal cancer cells following activation of the Ras-Raf-ERK pathway and mediates anti-apoptotic signal. J Biol Chem. 2011;286:33580–33590. doi: 10.1074/jbc.M111.248401. [DOI] [PMC free article] [PubMed] [Google Scholar]
- Nadadur SS, Srirama K, Mudipalli A. Iron transport & homeostasis mechanisms: their role in health & disease. Indian J Med Res. 2008;128:533–544. [PubMed] [Google Scholar]
- Sun X, Ge R, Cai Z, Sun H, He QY. Iron depletion decreases proliferation and induces apoptosis in a human colonic adenocarcinoma cell line, Caco2. J Inorg Biochem. 2009;103:1074–1081. doi: 10.1016/j.jinorgbio.2009.05.004. [DOI] [PubMed] [Google Scholar]
- Ma Z, Liu Z, Wu RF, Terada LS. p66(Shc) restrains Ras hyperactivation and suppresses metastatic behavior. Oncogene. 2010;29:5559–5567. doi: 10.1038/onc.2010.326. [DOI] [PMC free article] [PubMed] [Google Scholar]
- Elgendy M, Sheridan C, Brumatti G, Martin SJ. Oncogenic Ras-induced expression of Noxa and Beclin-1 promotes autophagic cell death and limits clonogenic survival. Mol Cell. 2011;42:23–35. doi: 10.1016/j.molcel.2011.02.009. [DOI] [PubMed] [Google Scholar]
- Kurz T, Eaton JW, Brunk UT. The role of lysosomes in iron metabolism and recycling. Int J Biochem Cell Biol. 2011;43:1686–1697. doi: 10.1016/j.biocel.2011.08.016. [DOI] [PubMed] [Google Scholar]
- Lee PJ, Alam J, Wiegand GW, Choi AM. Overexpression of heme oxygenase-1 in human pulmonary epithelial cells results in cell growth arrest and increased resistance to hyperoxia. Proc Natl Acad Sci USA. 1996;93:10393–10398. doi: 10.1073/pnas.93.19.10393. [DOI] [PMC free article] [PubMed] [Google Scholar]
- Inguaggiato P, Gonzalez-Michaca L, Croatt AJ, Haggard JJ, Alam J, Nath KA. Cellular overexpression of heme oxygenase-1 up-regulates p21 and confers resistance to apoptosis. Kidney Int. 2001;60:2181–2191. doi: 10.1046/j.1523-1755.2001.00046.x. [DOI] [PubMed] [Google Scholar]
- Piao MS, Park JJ, Choi JY, Lee DH, Yun SJ, Lee JB, et al. Nrf2-dependent and Nrf2-independent induction of phase 2 detoxifying and antioxidant enzymes during keratinocyte differentiation. Arch Dermatol Res. 2012;304:387–395. doi: 10.1007/s00403-012-1215-7. [DOI] [PubMed] [Google Scholar]
- Tauber S, Jais A, Jeitler M, Haider S, Husa J, Lindroos J, et al. Transcriptome analysis of human cancer reveals a functional role of heme oxygenase-1 in tumor cell adhesion. Mol Cancer. 2010;9:200. doi: 10.1186/1476-4598-9-200. [DOI] [PMC free article] [PubMed] [Google Scholar]
- Schmidt M, Goebeler M, Posern G, Feller SM, Seitz CS, Brocker EB, et al. Ras-independent activation of the Raf/MEK/ERK pathway upon calcium-induced differentiation of keratinocytes. J Biol Chem. 2000;275:41011–41017. doi: 10.1074/jbc.M003716200. [DOI] [PubMed] [Google Scholar]
- Duquesnes N, Vincent F, Morel E, Lezoualc'h F, Crozatier B. The EGF receptor activates ERK but not JNK Ras-dependently in basal conditions but ERK and JNK activation pathways are predominantly Ras-independent during cardiomyocyte stretch. Int J Biochem Cell Biol. 2009;41:1173–1181. doi: 10.1016/j.biocel.2008.09.032. [DOI] [PubMed] [Google Scholar]
- Paruchuri S, Hallberg B, Juhas M, Larsson C, Sjolander A. Leukotriene D(4) activates MAPK through a Ras-independent but PKCepsilon-dependent pathway in intestinal epithelial cells. J Cell Sci. 2002;115 (Pt 9:1883–1893. doi: 10.1242/jcs.115.9.1883. [DOI] [PubMed] [Google Scholar]
- Xi G, Shen X, Clemmons DR. p66shc negatively regulates insulin-like growth factor I signal transduction via inhibition of p52shc binding to Src homology 2 domain-containing protein tyrosine phosphatase substrate-1 leading to impaired growth factor receptor-bound protein-2 membrane recruitment. Mol Endocrinol. 2008;22:2162–2175. doi: 10.1210/me.2008-0079. [DOI] [PMC free article] [PubMed] [Google Scholar]
- Smith DM, Patel S, Raffoul F, Haller E, Mills GB, Nanjundan M. Arsenic trioxide induces a beclin-1-independent autophagic pathway via modulation of SnoN/SkiL expression in ovarian carcinoma cells. Cell Death Differ. 2010;17:1867–1881. doi: 10.1038/cdd.2010.53. [DOI] [PMC free article] [PubMed] [Google Scholar]
- Tenopoulou M, Kurz T, Doulias PT, Galaris D, Brunk UT. Does the calcein-AM method assay the total cellular 'labile iron pool' or only a fraction of it. Biochem J. 2007;403:261–266. doi: 10.1042/BJ20061840. [DOI] [PMC free article] [PubMed] [Google Scholar]
Associated Data
This section collects any data citations, data availability statements, or supplementary materials included in this article.


