

Background: The male mouse-specific peptide pheromone ESP1 is recognized by a specific G-protein-coupled receptor (GPCR) and enhances female sexual receptive behavior.
Results: The structural and functional domain of ESP1 was defined, and its structure and receptor-binding site were revealed.
Conclusion: Electrostatic interactions determine the specific binding of ESP1 to its receptor.
Significance: This study provides a basis for the narrowly tuned sensing of mammalian peptide pheromones.
Keywords: Cell Signaling, G-protein-coupled Receptor (GPCR), Neuroscience, NMR, Pheromone, Protein Structure, Protein-Protein Interactions, Structural Biology, Chemoreception, Molecular Recognition
Abstract
Exocrine gland-secreting peptide 1 (ESP1) is a sex pheromone that is released in male mouse tear fluids and enhances female sexual receptive behavior. ESP1 is selectively recognized by a specific class C G-protein-coupled receptor (GPCR), V2Rp5, among the hundreds of receptors expressed in vomeronasal sensory neurons (VSNs). The specific sensing mechanism of the mammalian peptide pheromone by the class C GPCR remains to be elucidated. Here we identified the minimal functional region needed to retain VSN-stimulating activity in ESP1 and determined its three-dimensional structure, which adopts a helical fold stabilized by an intramolecular disulfide bridge with extensive charged patches. We then identified the amino acids involved in the activation of VSNs by a structure-based mutational analysis, revealing that the highly charged surface is crucial for the ESP1 activity. We also demonstrated that ESP1 specifically bound to an extracellular region of V2Rp5 by an in vitro pulldown assay. Based on homology modeling of V2Rp5 using the structure of the metabotropic glutamate receptor, we constructed a docking model of the ESP1-V2Rp5 complex in which the binding interface exhibited good electrostatic complementarity. These experimental results, supported by the molecular docking simulations, reveal that charge-charge interactions determine the specificity of ESP1 binding to V2Rp5 in the large extracellular region characteristic of class C GPCRs. The present study provides insights into the structural basis for the narrowly tuned sensing of mammalian peptide pheromones by class C GPCRs.
Introduction
Animals communicate using pheromones, which are species-specific chemicals that confer sexual or social information (1–3). For terrestrial organisms, including insects and mammals, many pheromones are small volatile substances that are diffused in the air and thus mediate long distance communication between individuals (1–4). In contrast, pheromones utilized in organisms such as bacteria, protists, fungi, mollusks, and amphibians are usually nonvolatile substances that work over shorter distances in an aquatic environment (2, 3, 5, 6). Mammals also use nonvolatile peptide or protein pheromones that remain on the body surface or at a marking spot and are transmitted to other individuals by direct contact (2, 3, 5–8).
In mice, nonvolatile pheromones are released via the urine or secreted from exocrine glands in the form of tears, saliva, and sweat (1, 3, 4, 6–8). Among secreted pheromones, exocrine gland-secreting peptide 1 (ESP1)3 is a male-specific pheromone released into tear fluids and enhances female sexual receptive behavior upon male mounting, which is called lordosis (9, 10). Sexual dimorphism and strain differences in expression of ESP family peptides suggest that they may convey information about sex and individual identity in rodent species (11). ESP family peptides, however, share no sequence similarity with known proteins, and thus three-dimensional structural information should provide a clue as to the evolutionary origin of the family.
The ESP peptides, including ESP1, are detected by the vomeronasal organ (VNO), which is located beneath the nasal septum (11). Among the hundreds of vomeronasal receptors, ESP1 is recognized by only one specific vomeronasal type 2 receptor (V2R), V2Rp5 (10, 12, 13), which belongs to the class C G-protein-coupled receptor (GPCR) (14). The ESP1 signal received by V2Rp5 in the female VNO is transmitted to the accessory olfactory bulb (AOB) and to the brain, where it elicits lordosis behavior (10). ESP1-V2Rp5 is the only peptide pheromone-receptor pair identified thus far in mammals.
To determine the origin of ESP1 and the ESP family and how specific pheromone recognition is established, we attempted to solve the three-dimensional structure of ESP1 and thereby obtain information regarding the structural basis for the ESP1-V2Rp5 interactions. We herein report the NMR structure of ESP1 and the identification of amino acids involved in receptor recognition. We also describe the specific binding of ESP1 to the extracellular region of V2Rp5. Based on these experimental results, we propose a ligand-receptor binding model of ESP1 and V2Rp5 in which the charged amino acids provide the interactions determining specificity. To our knowledge, this is the first report to demonstrate a direct interaction between a mammalian peptide pheromone and its receptor. The structural information obtained in this study may allow us to develop agonists or antagonists to regulate the specific recognition of ESP1 by V2Rp5 and thus control sexual behavior in mice.
EXPERIMENTAL PROCEDURES
Protein Preparation
To create the expression vector for the ESP1(22–102) protein, the ESP1 gene (exon 3) encoding ESP1(24–102) of BALB/c mice was subcloned into the NdeI–EcoRI sites of the pET-28a vector (Merck), and the NdeI sequence encoding His-Met on the 5′ side of the ESP1(24–102) gene was changed using site-directed mutagenesis to encode Gly-Arg to correspond to ESP1(22–23). To prepare the vector for the ESP1(48–102) protein, we deleted the sequence encoding the His-Met and ESP1(24–47) using site-directed mutagenesis. To obtain vectors for ESP1(36–99) point mutants or deletion mutants of ESP1(36–X), site-directed mutagenesis was performed with the original expression vector (9). To generate the other ESP1(X–99) deletion mutants, DNA fragments of the truncated ESP1 genes were inserted into the pCold TF vector (Takara Bio).
All ESP1 proteins were expressed in Escherichia coli BL21(DE3). For expression of unlabeled protein, transformed cells were grown in Luria-Bertani medium. For NMR analyses, we prepared uniformly 13C/15N- and 15N-labeled ESP1(22–102) and ESP1(48–102) proteins by growing the E. coli in M9 medium containing 15NH4Cl (CIL) and CELTONE-CN or -N (CIL) with [U-13C]glucose (Isotec) or unlabeled glucose. The ESP1(22–102) and (48–102) proteins were purified using Ni-Sepharose 6 Fast Flow (GE Healthcare) columns, and thrombin protease (GE Healthcare or ILS Inc.) was used to remove His tags. These proteins were purified further with a second round of Ni-affinity chromatography followed by sequential anion exchange (Q-Sepharose Fast Flow (GE Healthcare)), size exclusion (Superdex 75 (GE Healthcare)), and reversed-phase (Symmetry300 C4 (Waters Corp.)) chromatography. The ESP1(36–99 or 36–X) proteins were purified using reversed-phase chromatography (PEGASIL-300 C4P (Senshu Scientific)). The other ESP1(X–99) deletion mutants were purified with His·Bind Resin (Merck), cleaved by Factor Xa (Merck), and then subjected to reversed-phase chromatography (PEGASIL-300 C4P). The identity and integrity of all purified proteins were confirmed using MALDI/TOF MS and SDS-PAGE.
c-Fos Induction Assay in the Vomeronasal System
c-Fos-inducing activity in the vomeronasal sensory neurons (VSNs) and AOB neurons was assayed as described previously (9, 10). A piece of cotton (30 mg) was transfused with PBS (pH 7.4) containing 5 μg of ESP1 proteins, dried in a MicroVac vacuum-centrifugal evaporator, and placed into a mouse cage for a 90-min exposure to a BALB/c female mouse. ESP1(36–99), which is the major form of ESP1 in male extraorbital lacrimal gland, was used as a positive control (9, 10). A mixture containing multiple forms of ESP1(22–102) obtained after the second Ni-affinity step and ESP1 monomers, dimers, and tetramers obtained after additional anion exchange, size exclusion, and reversed-phase chromatography were used in the biological assay and for SDS-PAGE analysis. The anti-c-Fos antibodies ab7963 (Abcam) and Ab-5 (Merck) were used to stain VNO and AOB sections, respectively. Experiments were performed in accordance with the animal experimentation protocols approved by the Animal Care and Use Committee at the University of Tokyo.
AMS Modification Analysis
Purified ESP1(22–102) monomers were incubated with or without 9 mm DTT in 18 mm Tris-HCl (pH 7.4) at room temperature for 30 min. Subsequently, all samples were precipitated with trichloroacetic acid, washed with ethanol, and dissolved in 1% SDS and 100 mm Tris-HCl (pH 7.0) with or without 10 mm AMS (Invitrogen). All samples were incubated at 37 °C for 10 min in darkness and then fractionated on an 18% SDS-PAGE under nonreducing conditions.
NMR Spectroscopy
For NMR studies, purified ESP1(22–102) and (48–102) monomers were concentrated to 150 μm in an H2O/D2O (0.9/0.1 or 0.95/0.05, v/v) or D2O solution (pH 4.0, direct pH meter reading). NMR measurements were performed at 35 °C on a Bruker Avance 700 or Avance 600 spectrometer with a cryogenic probe. Sequence-specific assignments of 1H, 13C, and 15N in ESP1(22–102) and (48–102) were achieved primarily by through-bond heteronuclear correlations along the backbone and side chains with the following 1H, 13C, and 15N triple resonance spectra: three-dimensional HNCO, CBCA(CO)NH, HNCACB, HBHA(CBCACO)NH, H(CCO)NH, C(CO)NH, and HC(C)H total correlation spectroscopy (15), recorded on the 13C/15N-labeled sample. Information regarding the distance between protons was obtained from three-dimensional 15N- and 13C-edited NOESY (15), recorded with mixing times of 150 and 300 ms on the 15N- or 13C/15N-labeled sample. The φ dihedral angle information was obtained from three-dimensional HNHA (16), recorded on the 15N-labeled sample. The {1H}–15N NOE measurements (17) were performed on the Bruker Avance 700 spectrometer at a 700 MHz 1H frequency with a 1H saturation time of 3.0 s, during the relaxation delay recorded on the 15N-labeled sample.
Structure Determination
The NMRPipe software suite (18) was used to process NMR data and to pick the resonance peaks. Olivia software (M. Yokochi, S. Sekiguchi, and F. Inagaki, Hokkaido University, Sapporo, Japan) was used to assign the resonance peaks semiautomatically. The NOE peak assignments and the structure calculations were performed with the CYANA program (19, 20). The φ dihedral angle restraints were applied, based on the analysis of the three-dimensional HNHA spectrum (15). The ψ and φ dihedral angle restraints that were not obtained from the HNHA spectrum were determined from a chemical shift analysis using the program TALOS (21). The restraints on the disulfide bridge were applied between Cys63 and Cys95. The restraint range was 2.0–2.1 Å for the Sγ–Sγ pair and 3.0–3.1 Å for the Sγ–Cβ pairs. A total of 100 structures were obtained after structure calculations based on the manual and 6-cycle-iterative NOE peak assignments and the dihedral angle restraints and disulfide bridge restraints. The 20 structures of ESP1(48–102) with the lowest CYANA target function were analyzed (Table 1).
TABLE 1.
NMR and refinement statistics for the structure determination of ESP1(48–102)
| Parameters | Values |
|---|---|
| NOE distance constraints | |
| Total | 1014 |
| Short range |i–j| ≤ 1 | 799 |
| Medium range 1 < |i–j| < 5 | 152 |
| Long range |i–j| ≥ 5 | 63 |
| Dihedral angle constraints | |
| φ | 17 |
| ψ | 10 |
| Disulfide bridge constraints | 3 (1 disulfide bridge) |
| CYANA target function (Å2) | 0.52 ± 0.12 |
| Residual NOE violations | |
| Number > 0.30 Å | 7 (0.35/structure) |
| Residual angle violations | |
| Number > 3.0° | 0 |
| Ramachandran statistics (%) | |
| Residues in most favored regions | 66.4 |
| Residues in additional allowed regions | 33.4 |
| Residues in generously allowed regions | 0.2 |
| Residues in disallowed regions | 0.0 |
| Structural coordinates r.m.s.d.a (Å) (residues 50–63, 68–76, 86–90) | |
| Backbone atoms for the final ensemble | 0.67 |
| All heavy atoms for the final ensemble | 1.23 |
a Root mean square deviation.
Fig. 3A involving 20 superimposed structures was generated with the program MOLMOL (22). Schematic diagrams and molecular surface representations were generated with the program PyMOL (PyMOL Molecular Graphics System, Schrödinger, L.L.C.).
FIGURE 3.

Structure of the core domain of ESP1. A, stereo pair representation of the 20 NMR structures of ESP1(48–102) with the lowest CYANA target function superimposed on the helical regions (green). The residue numbers of helix termini are indicated. B, ribbon representation of the ESP1(48–102) structure. Each helix is labeled as H1, H2, or H3 and is colored green. The N and C termini are marked with N and C, respectively. Disulfide bridges are depicted by yellow balls and sticks, and the cysteine residue numbers are indicated. The view of the structure is the same as in A. C, amino acid sequence of ESP1(48–102). The secondary structure and the numbers of ESP1 residues are shown above the sequence. Positively and negatively charged residues are colored blue and red, respectively. Cysteine residues are tinted yellow. The mutated residues for the c-Fos induction assay are marked with #, with the same color scheme as in Fig. 4E. D, electrostatic potentials on the molecular surface of ESP1(48–102). Positive and negative surface potentials are represented in blue and red, respectively. The numbers of charged residues are indicated. The structure on the left is represented from the same viewpoint as A. The three views are related by 120° rotations around the vertical axis. E, superposition of the far-UV CD spectra of ESP1 and its mutants, using the same color scheme and line style as in the right panel.
CD Spectroscopy
Purified cysteine mutants (C63S, C95S, and C63S/C95S) of ESP1(36–99), ESP1(51–99), ESP1(48–102) wild type and its mutant monomer proteins were concentrated to 20 μm in PBS (pH 7.4) for CD studies. As for C63S and C95S, 1 mm DTT was added to prevent the formation of intermolecular disulfide bridges. CD measurements were performed at room temperature on a JASCO J-820 spectropolarimeter.
Pulldown Assay
A recombinant protein comprising the extracellular region of V2Rp5 (amino acids 19–584) and a C-terminal FLAG tag was produced by CellFree Sciences Co., Ltd., using purified wheat embryos and the cell-free protein synthesis system (23). The preparation of the ESP4 monomers will be described elsewhere.4 Both ESP1 and ESP4 were covalently attached to Affi-Gel 10 beads (Bio-Rad) using the standard amine coupling conditions according to the manufacturer's instructions. The ESP1-attached beads were incubated with V2Rp5 in 30 mm HEPES-KOH (pH 7.8) buffer containing 0.1% digitonin (Merck), then washed with the same buffer containing 100 mm NaCl. The bound V2Rp5 was eluted with buffer containing 560 μm free ESP1 or ESP4. Aliquots of each fraction were subjected to a 10% SDS-PAGE and analyzed by immunoblotting with anti-FLAG antibody M2 (Sigma-Aldrich). In a separate experiment, the ESP1- and ESP4-attached beads, as well as unattached beads, were incubated with V2Rp5 and washed with 30 mm HEPES-KOH (pH 7.8) buffer containing 0.1% digitonin and 100 mm NaCl. The bound V2Rp5 was eluted with the same buffer containing 0.1% digitonin and 500 mm NaCl. Aliquots of each fraction were analyzed as described above.
Model Construction
Each of the V2Rp5 homology models in active and resting states was constructed with MOE (Chemical Computing Group Inc.) using the structures of the metabotropic glutamate receptor 1 (mGluR1) (PDB codes 1EWK and 1EWT) (24) as model building templates. The model of V2Rp5 complexed with ESP1 was constructed by manual fitting of the ESP1 structure onto the cleft of the V2Rp5 model in the active state and was energy-minimized using MOE.
RESULTS
ESP1 Monomers Containing an Intramolecular Disulfide Bridge Possess Biological Activity
A recombinant ESP1 protein without the signal sequence predicted by SignalP 3.0 (25) was expressed in E. coli and purified as described under “Experimental Procedures.” This protein is hereafter referred to as ESP1(22–102) (Fig. 1A). ESP1(22–102) was resolved as a multiband protein by SDS-PAGE under nonreducing conditions (Fig. 1B, lane 1, Mix). Under reducing conditions, it was resolved as a single band, corresponding to the molecular mass of the monomer (9,150 Da) (lane 5), which indicated that different oligomers exist. Mix and purified monomers (lane 2, M) induced c-Fos expression in female VSNs at the same level as ESP1(36–99) (Fig. 1A), which is one of the native forms in male extraorbital lacrimal gland (9), whereas purified dimers (lane 3, D) and tetramers (lane 4, T) barely induced c-Fos expression (Fig. 1C). These results suggest that ESP1 monomers induce the vomeronasal neural activation.
FIGURE 1.
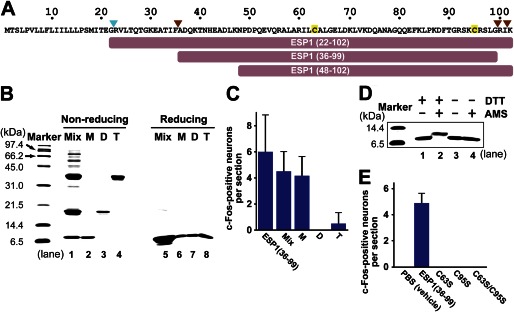
Characterization of ESP1 oligomerization and disulfide bridge formation. A, amino acid sequence of ESP1. The signal cleavage site is indicated by a cyan arrowhead, and the cleavage sites in the extraorbital lacrimal gland (9) are indicated by brown arrowheads. Cysteine residues are tinted yellow. The truncated constructs used in this study are shown as bars. B, SDS-PAGE analysis of the ESP1 oligomers under nonreducing and reducing conditions. The monomers (M), dimers (D), and tetramers (T) of ESP1 were purified to high homogeneity from a crude mixture of oligomers (Mix). Samples were subjected to an 18% SDS-PAGE under nonreducing (lanes 1–4) or reducing (lanes 5–8) conditions. C, analysis of the c-Fos-inducing activity of the ESP1 oligomers. The numbers of c-Fos-positive VNO neurons in BALB/c female mice stimulated by ESP1(36–99), Mix, M, D, or T were counted. The average values were obtained from slice sections of the mouse VNO (n = 6). Error bars represent S.D. D, analysis of intramolecular disulfide bridge formation using AMS. Preparations of the ESP1 monomers, either reduced with DTT (lanes 1 and 2) or nonreduced (lanes 3 and 4), were reacted with AMS (lanes 2 and 4). Samples were subjected to an 18% SDS-PAGE under nonreducing conditions. E, analysis of the c-Fos-inducing activity of the cysteine-to-serine mutants of ESP1. The numbers of c-Fos-positive VNO neurons in BALB/c female mice stimulated by PBS (vehicle), ESP1(36–99), or the mutant (C63S, C95S, or C63S/C95S) were counted. The average values were obtained from the mouse VNO (n = 6 slices, n = 3 mice).
ESP1(22–102) contains two cysteines (Cys63 and Cys95) (Fig. 1A). Under reducing conditions, ESP1 monomers were modified by the thiol-alkylating agent AMS (26), and the electrophoretic migration was retarded (Fig. 1D, lane 2), although they were not modified and the migration did not change under nonreducing conditions (lane 4), compared with those without the AMS treatment (lanes 1 and 3). These results indicate that the monomers contain an intramolecular disulfide bridge. None of cysteine mutants (C63S, C95S, and C63S/C95S) induced c-Fos expression, highlighting the importance of the disulfide bridge to the biological activity of ESP1 (Fig. 1E).
Identification of the Structural and Functional Region of ESP1
To obtain structural information regarding ESP1, backbone mobility was investigated by NMR (17) (Fig. 2A). Negative {1H}–15N NOE indicated that residues 22–48 and 99–102 have a higher mobility, whereas positive NOE indicated that residues 50–98 have a lower mobility. A comparison of the 1H–15N HSQC spectra of ESP1(48–102), lacking the N-terminal mobile region (Fig. 1A), and ESP1(22–102) revealed that the signals derived from the same residues 52–102 are superimposable (Fig. 2B). Consequently, ESP1 includes both a flexible region (residues 22–48) and a structural region (residues 50–98), and these two regions do not interact with each other. The structural region is referred to as the “core domain.”
FIGURE 2.

Identification of the structural and functional regions of ESP1. A, analysis of the backbone mobility of ESP1(22–102) using {1H}–15N NOE. Histogram shows the {1H}–15N heteronuclear NOE data obtained for the backbone 15N nuclei of ESP1(22–102) as a function of residue number. Proline residues are indicated as P. B, comparison of the 1H–15N HSQC spectra of ESP1(22–102) and ESP1(48–102). The 1H–15N HSQC spectra of ESP1(22–102) (black) and ESP1(48–102) (red) are overlaid. Overlapping NMR signals derived from the same ESP1(22–102) and ESP1(48–102) residues are labeled in green, whereas the remaining signals are shown with black residue labels. Nonoverlapping signals from the same ESP1(22–102) and ESP1(48–102) residues are represented by dashed lines between the two peaks. The serine signals derived from the thrombin cleavage site on the N-terminal side of ESP1 are indicated as S*. C, analysis of the c-Fos-inducing activity of the ESP1 deletion mutants. The number of c-Fos-positive VNO neurons was counted in BALB/c female mice stimulated with ESP1(36–99), the N-terminal deletion mutant (ΔN mutant), or the C-terminal deletion mutant (ΔC mutant). The average values were obtained from slice sections of the mouse VNO (n = 6 slices, n = 3 mice).
Deletion analysis was performed to define the functional region of ESP1 using the c-Fos induction assay (Fig. 2C). Two N-terminal deletion mutants, ESP1(51–99) and ESP1(52–99), both of which lack residue Asp50, exhibited markedly impaired c-Fos-inducing activity, whereas the other N-terminal deletion mutants bearing Asp50 retained activity. The C-terminal deletion mutant ESP1(36–94), which lacks residue Cys95, lost activity, whereas the C-terminal deletion mutants bearing Cys95 did not. Based on these results, we conclude that the residues Asp50–Cys95 are the minimal functional region. This region approximately coincides with the core domain (Asp50–Leu98) defined by NMR. Therefore, it is clear that the structural integrity of the core domain, but not the unstructured N-terminal region, is necessary for c-Fos-inducing activity of ESP1.
Determination of the Three-dimensional Structure of ESP1
Structure of ESP1(48–102), containing the core domain, was determined using NMR to establish the structural basis for the pheromone activity of ESP1 (Fig. 3, A and B, and Table 1). ESP1 consists of three helices: two α-helices, H1 (residues 51–61) and H2 (residues 68–78), and one 310-helix, H3 (residues 86–90) (Fig. 3, B and C). The N-terminal residue Asp50 of the minimal functional region (Asp50–Cys95) is involved in the interaction between the N terminus of the H1 helix and the loop connecting the H2 and H3 helices, whereas the C-terminal residue Cys95 forms the intramolecular disulfide bridge to bring the H3 helix in close proximity to the H1 and H2 helices (Fig. 3B). The molecular surface of ESP1, depicted on the left in Fig. 3D, is rich in positive charges, with Arg56 and Arg60 in H1 and Lys84, Arg92, Lys94, and Arg96 in the neighboring region of H3. The surface depicted in the middle of Fig. 3D has an abundance of negative charges, represented by Asp50 and Glu53 in H1 and Glu67, Asp69, and Asp74 in H2. Compared with the two surfaces, the surface depicted on the right has no such electrostatic properties. By using CD spectroscopy we found that the cysteine mutants (C63S, C95S, and C63S/C95S) and the N-terminal deletion mutant ESP1(51–99), which both exhibited markedly impaired c-Fos-inducing activity (Figs. 1E and 2C), retained the helical structures (Fig. 3E). These findings suggested that the intramolecular disulfide bridge and Asp50 are not crucial for the global helical structure but are required for the maintenance of the local electrostatic surface for receptor binding.
Identification of the Amino Acids Necessary for ESP1 Receptor Activation
To identify the residues involved in receptor activation, we examined the c-Fos-inducing activity of various substitution mutants: Q52R/E53N (mutations in H1), R56E/R60E (mutations in H1), E67Q/D69K/K70M (mutations in H2), and D88R/R92E/R96E (mutations in H3 and its C-terminal region) (Fig. 3, C and D). The assays revealed that R56E/R60E, E67Q/D69K/K70M, and D88R/R92E/R96E lost activity in the VNO, whereas Q52R/E53N did not (Fig. 4A). The c-Fos-inducing activity of R56E/R60E, E67Q/D69K/K70M, and D88R/R92E/R96E was markedly reduced in the AOB, the primary center of the vomeronasal system (Fig. 4B). We confirmed that these three mutants retained helical structures using CD spectroscopy (Fig. 3E). These results indicate that some of the charged residues are involved in receptor recognition (Fig. 3, C and D).
FIGURE 4.

Identification of the amino acids crucial for the c-Fos-inducing activity of ESP1. The number of c-Fos-positive VSNs was counted in BALB/c female mice stimulated with ESP1(36–99) and the multiple (A) and single mutants (C). The average values were obtained from six slice sections of the mouse VNO (n = 3 mice). The total number of c-Fos-positive AOB neurons was counted in juxtaglomerular cells (blue), mitral/tufted cells (red), and granule cells (green) stimulated with ESP1(36–99), the multiple mutants (B), or the single mutants (D) (n = 3 mice). Error bars represent S.D. E, mapping of the residues involved in the c-Fos-inducing activity of ESP1. The mutated residues for the c-Fos induction assay are colored on the ESP1 surface, where the residue crucially involved in the c-Fos inducing activity is purple, the other involved residues are orange, and the uninvolved residues are black. The two views are represented in the same manner as the left and middle panels in Fig. 3D.
To further narrow down the residues essential for the activity, we constructed single substitution mutants involving eight residues (R56E, R60E, E67R, E67Q, D69R, K70E, D88R, R92E, and R96E). The substitution at Glu67 (E67R) resulted in a loss of activity in the VNO (Fig. 4C) and a marked reduction of activity in the AOB (Fig. 4D). The activity of the more conservative substitution mutant, E67Q, was reduced to the same extent as the charge reversal mutant, E67R. We also confirmed that both the Glu67 mutants retained helical structures (Fig. 3E). Some reduction of activity in the VNO was observed with single mutations of Arg56, Arg60, Asp69, Lys70, Asp88, Arg92, and Arg96 (Fig. 4C), but activity in the AOB was not affected by these mutations (Fig. 4D). We speculate that the weaker ESP1 signals in VSNs converge onto the glomleruli in the AOB, resulting in the same level of c-Fos-inducing activity in the AOB. Fig. 4E summarizes the mutagenesis results in which we mapped Glu67 and the other charged residues that exhibited significant effects on the activity when mutated.
Direct Interaction of ESP1 with an Extracellular Region of V2Rp5
The ESP1 receptor, V2Rp5, contains a long extracellular N-terminal region, which is characteristic of the class C GPCRs (14). To determine whether direct binding occurs between ESP1 and the extracellular region of V2Rp5, we performed an in vitro pulldown assay (Fig. 5). A recombinant protein comprising the extracellular region of V2Rp5 (amino acids 19–584) was produced, using the wheat embryo cell-free protein synthesis system (23). The soluble extracellular V2Rp5 protein was incubated with ESP1 that had been covalently attached to agarose beads, and the beads were eluted with free ESP1 or ESP4. ESP4 is expected to bind to a different receptor than V2Rp5, despite the closest ESP family member to ESP1 (10). Immunoblot analysis of the pulldown product revealed that the bound V2Rp5 protein could be eluted with free ESP1 (Fig. 5A, lane 3), but not with ESP4 (lane 4). These results indicate that ESP1 specifically binds to the extracellular region of V2Rp5. Soluble V2Rp5 was incubated with either ESP1 or ESP4 attached to beads or with unattached beads, and the beads were eluted with 500 mm NaCl (Fig. 5B). In the case of ESP1, V2Rp5 was eluted (lane 3), whereas in the cases of ESP4 and the unattached beads, V2Rp5 did not bind and flowed through (lanes 4, 6, 7, and 9). The interaction between ESP1 and V2Rp5 was disrupted by high salt, demonstrating that electrostatic charge-charge interactions contribute to the ESP1-V2Rp5 binding.
FIGURE 5.

In vitro pulldown analysis of the ESP1-V2Rp5 interaction. A, specific interaction of ESP1 with the extracellular region of V2Rp5. Agarose beads covalently attached to ESP1 were incubated with V2Rp5 consisting of the extracellular region and a FLAG tag. After washing with 100 mm NaCl (lane 2), the bound protein was eluted with free ESP1 (lane 3) or ESP4 (lane 4). Aliquots of each fraction were subjected to a 10% SDS-PAGE and immunoblotting with an anti-FLAG antibody. B, charge-dependent interaction between ESP1 and V2Rp5. Agarose beads covalently attached to ESP1 (lanes 1–3) or ESP4 (lanes 4–6) and unattached beads (—) (lanes 7–9) were incubated with V2Rp5 then washed with buffer containing 100 mm NaCl (lanes 2, 5, and 8). Bound protein was eluted with 500 mm NaCl (lanes 3, 6, and 9). All fractions were analyzed as described in A.
DISCUSSION
In this study, we identified the minimal functional region needed to retain VSN-stimulating activity in the sex peptide pheromone ESP1 (Figs. 1 and 2) and determined its three-dimensional structure (Fig. 3). ESP1 adopts a compact structure with a helical fold stabilized by an intramolecular disulfide bridge. Structure-based mutational analyses revealed that the residues located on the charged surfaces of ESP1 are involved in the activation of VSNs (Fig. 4). The specific binding of ESP1 to its receptor V2Rp5 was reconstituted in an in vitro pulldown assay, which demonstrated that ESP1 bound to the extracellular region of V2Rp5 in a charge-dependent manner (Fig. 5).
To predict the receptor binding mode of ESP1, we attempted to build a homology model for the extracellular region of V2Rp5 in an active state, based on the structure of mGluR1 (PDB code 1EWK) (24), a well known member of the class C GPCRs. mGluR1 functions as a dimer, and its glove-like ligand binding domain in each subunit shifts back and forth between the open and closed forms (24). The binding of glutamate ligands to the open binding clefts leads to the equilibrium shift to the active state, in which one subunit adopts the closed form and the other remains in the open form, for induction of the signal transduction cascade (24). A constructed active state model of V2Rp5 revealed an abundance of negative charges in the open cleft (left in Fig. 6A), which electrostatically complements the V2Rp5-binding surface of ESP1 (Figs. 3D and 4E). Therefore, we docked ESP1 onto the cleft of V2Rp5 in a manner facilitating the complementary electrostatic interactions (Fig. 6A). The volume of the V2Rp5 cleft (approximately 5,800 Å3) appears to match the molecular size of ESP1 (approximately 5,600 Å3) (Fig. 6B), whereas the cleft volumes of a V2Rp5 model based on a resting state structure of mGluR1 (PDB code 1EWT) (24), in which both subunits adopt the open forms (approximately 5,300 and 5,100 Å3), are smaller than that of ESP1 (data not shown). This suggested that ESP1 can be accommodated by the V2Rp5 cleft in the active state but not in the resting state. Our docking model supports the experimental results that charge-charge interactions are involved in the ESP1-V2Rp5 binding (Fig. 5B). The in vitro pulldown assay revealed that V2Rp5 binds ESP1, but not ESP4 (Fig. 5A). The ESP1 residues involved in receptor recognition (Fig. 4E) are different from the corresponding residues in ESP4 (Fig. 6C). These observations suggested that the charge distribution on the binding interface is unique in each ESP and provides the receptor binding specificity.
FIGURE 6.

Structural model of the ESP1-V2Rp5 complex. A, putative binding surface of a docking model of ESP1 and the extracellular region of V2Rp5, shown as an open-book representation. The positive and negative surface potentials of the open subunit of V2Rp5 (left) and ESP1 (middle) are colored blue and red, respectively. The molecular surface of the closed subunit of V2Rp5 (left) is colored gray. ESP1, represented by the green ribbon model on the right, is shown from the same viewpoint as the electrostatic surface model in the middle, corresponding to a 40° rotation about the horizontal axis and a 180° rotation in-plane of the view in Fig. 3B. B, binding model of the ESP1-V2Rp5 complex. The molecular surface model of the ESP1-V2Rp5 complex is shown together with its schematic diagram. The view on the right is a 90° rotation about the vertical axis of the view on the left. The positive and negative surface potentials of the open subunit of V2Rp5 are colored blue and red. The molecular surfaces of ESP1 and the closed subunit of V2Rp5 are colored green and gray. In the schematic diagram, the open and closed subunits of V2Rp5 and ESP1 are colored orange, gray, and green, respectively. C, sequence alignment of ESP1 and ESP4. The sequence alignment corresponding to the core domain of ESP1 is shown for ESP1 and ESP4. Residues that are not type-conserved are tinted light purple. The secondary structure and the numbers of ESP1 residues are shown above the sequence. The ESP1 residues mutated for the c-Fos induction assay in Fig. 4 are marked with #, with the same color scheme as in Fig. 4E.
Low molecular mass sweeteners and sweet-tasting proteins are commonly recognized by the T1R2-T1R3 heterodimer, which also belongs to the class C GPCRs (27). Most of the low molecular mass sweeteners are considered to bind to an open cleft of the extracellular region of T1R2, leading to receptor activation in a similar manner to the glutamate binding to mGluRs (28). As for the sweet-tasting proteins, several receptor-binding models have been proposed. The overall three-dimensional structures of the sweet-tasting proteins are so different that parts of the structures referred to as “sweet fingers,” such as protruding loop regions, were proposed to mimic the low molecular mass sweeteners (29). However, the cyclic peptides derived from the loop regions do not retain the activity, weakening the support for the sweet finger model (30). A more plausible model was proposed, in which the sweet-tasting protein wedges into an open cleft of T1R3 and keeps the sweet taste receptor in an active state (T1R3 open, T1R2 closed) (31, 32). The V2Rp5 binding sites of ESP1 are not located on a simple loop region, but on a surface of the structural domain, including the helical region (Fig. 4E). Therefore, the ESP1-V2Rp5 binding mode does not appear to fit the former “sweet finger model,” but instead to coincide with the latter “wedge model.” These observations may indicate a common receptor activation mechanism for pheromone and taste perception.
In a manner similar to the ESP1-V2Rp5 interaction, the charge-charge interactions are a driving force for the recognition of a negatively charged glutamate ligand by a positively charged cleft of mGluRs (24). Modeling studies suggested that positively charged sweet-tasting proteins bind to a putative negatively charged cleft of the sweet taste receptor T1R2-T1R3 (31, 32). Therefore, electrostatic interactions appear to be the common molecular basis for the interactions between class C GPCRs and their ligands.
Peptide pheromones are utilized by a wide range of terrestrial and aquatic organisms (1–8). Despite the lack of sequence homology, ESP1 and two peptide pheromones from sea hare mollusks (attractin) (33) and unicellular marine ciliates (Er-1) (34, 35) have a similar topology bearing three helices (Fig. 7A), which indicates that they share a common superfold, called α-up-down (36). The peptide pheromones with the α-up-down superfold may have evolved from an early evolutionary origin. The α-up-down structure is quite distinct from the β-barrel structure observed so far in mammalian pheromones, such as MUPs (37), α2u-globulin (37), and aphrodisin (38) (Fig. 7B).
FIGURE 7.

Comparison of the structures of the peptide pheromones. A, structures of ESP1 (left), attractin (PDB code 1T50) (middle), and Er-1 (PDB code 2ERL) (right) are shown as green, magenta, and cyan ribbon representations, respectively. Each helix is labeled as H1, H2, or H3. The N- and C termini are marked with N and C, respectively. Disulfide bridges are depicted by yellow balls and sticks. The view of the structures in the lower panel is a 90° rotation of the view of the structures in the upper panel around the horizontal axis. Although the H3 helix of attractin is described as a short α-helix in the PDB, this was not mentioned in published reports (33). B, structures of mammalian peptide pheromones with β-barrel topology. Structures of MUP (PDB code 1MUP) (left), α2u-globulin (PDB code 2A2U, chain A) (middle), and aphrodisin (PDB code 1E5P, chain A) (right), are shown as blue, beige, and orange ribbon representations, respectively. The N and C termini and the disulfide bridges are depicted with the same color scheme used in A.
In summary, we determined the NMR structure of ESP1 and identified the amino acid residues involved in the interaction with its receptor. We also demonstrated the specific binding of ESP1 to the extracellular region of the receptor, V2Rp5. The structural model of the ESP1-V2Rp5 complex provides insights into the molecular recognition mechanisms of peptide ligands by class C GPCRs. Using the obtained structural information, antagonists and agonists for V2Rp5 might be developed for regulating sexual behavior in mice. Because wild-derived male mice secrete robust levels of ESP1 in tear fluid, unlike laboratory mice, including inbred strains and closed colonies (10), designed antagonists could control reproduction in wild mice to solve the global public health and food safety problems they cause. Designed agonists in turn could be utilized to enhance reproduction of genetically manipulated mice, which are often difficult to breed, for use in research and development in the medical and pharmaceutical fields.
Acknowledgments
We thank Tomomi Kimura for protein preparation; Koji Nagata and Masaru Tanokura for optimization of the solution conditions for ESP1; Takashi Saitoh, Daisuke Kohda, and Takumi Ueda for NMR measurements; and Masashi Yokochi and Fuyuhiko Inagaki for NMR analyses.
This work was supported by the Targeted Proteins Research Program (to S. Y., K. T., and H. T.) and Grant-in-aid for Scientific Research on Priority Areas 19036022 (to S. Y., K. T., and H. T.) from the Ministry of Education, Culture, Sports, Science, and Technology, Japan, by ERATO Touhara Chemosensory Signal Project from JST (to K. T.), by Grant-in-aid for Young Scientists (B) 24780104 (to S. Y.) from the Japan Society for the Promotion of Science, by the KUMAYAKU Alumni Research Fund (to S. Y.), and by the Cooperative Research Project Program of the Medical Institute of Bioregulation, Kyushu University (to H. T.).
The atomic coordinates and structure factors (code 2LMK) have been deposited in the Protein Data Bank (http://wwpdb.org/).
M. Taniguchi, S. Yoshinaga, S. Haga-Yamanaka, K. Touhara, and H. Terasawa, unpublished data.
- ESP1
- exocrine gland-secreting peptide 1
- AMS
- 4-acetamido-4′-maleimidyl-stilbene-2,2′-disulfonic acid
- AOB
- accessory olfactory bulb
- GPCR
- G-protein-coupled receptor
- HSQC
- heteronuclear single quantum coherence
- mGluR
- metabotropic glutamate receptor
- PDB
- Protein Data Bank
- V2R
- vomeronasal type 2 receptor
- VNO
- vomeronasal organ
- VSN
- vomeronasal sensory neuron.
REFERENCES
- 1. Dulac C., Torello A. (2003) Molecular detection of pheromone signals in mammals: from genes to behaviour. Nat. Rev. Neurosci. 4, 551–562 [DOI] [PubMed] [Google Scholar]
- 2. Brennan P. A., Zufall F. (2006) Pheromonal communication in vertebrates. Nature 444, 308–315 [DOI] [PubMed] [Google Scholar]
- 3. Touhara K. (2007) Molecular biology of peptide pheromone production and reception in mice. Adv. Genet. 59, 147–171 [DOI] [PubMed] [Google Scholar]
- 4. Novotny M. (2003) Pheromones, binding proteins and receptor responses in rodents. Biochem. Soc. Trans. 31, 117–122 [DOI] [PubMed] [Google Scholar]
- 5. Swaney W. T., Keverne E. B. (2009) The evolution of pheromonal communication. Behav. Brain Res. 200, 239–247 [DOI] [PubMed] [Google Scholar]
- 6. Touhara K. (2008) Sexual communication via peptide and protein pheromones. Curr. Opin. Pharmacol. 8, 759–764 [DOI] [PubMed] [Google Scholar]
- 7. Hurst J. L. (2009) Female recognition and assessment of males through scent. Behav. Brain Res. 200, 295–303 [DOI] [PubMed] [Google Scholar]
- 8. Stowers L., Logan D. W. (2010) Sexual dimorphism in olfactory signaling. Curr. Opin. Neurobiol. 20, 770–775 [DOI] [PMC free article] [PubMed] [Google Scholar]
- 9. Kimoto H., Haga S., Sato K., Touhara K. (2005) Sex-specific peptides from exocrine glands stimulate mouse vomeronasal sensory neurons. Nature 437, 898–901 [DOI] [PubMed] [Google Scholar]
- 10. Haga S., Hattori T., Sato T., Sato K., Matsuda S., Kobayakawa R., Sakano H., Yoshihara Y., Kikusui T., Touhara K. (2010) The male mouse pheromone ESP1 enhances female sexual receptive behaviour through a specific vomeronasal receptor. Nature 466, 118–122 [DOI] [PubMed] [Google Scholar]
- 11. Kimoto H., Sato K., Nodari F., Haga S., Holy T. E., Touhara K. (2007) Sex- and strain-specific expression and vomeronasal activity of mouse ESP family peptides. Curr. Biol. 17, 1879–1884 [DOI] [PubMed] [Google Scholar]
- 12. Haga S., Kimoto H., Touhara K. (2007) Molecular characterization of vomeronasal sensory neurons responding to a male-specific peptide in tear fluid: sexual communication in mice. Pure Appl. Chem. 79, 775–784 [Google Scholar]
- 13. Touhara K., Vosshall L. (2009) Sensing odorants and pheromones with chemosensory receptors. Annu. Rev. Physiol. 71, 307–332 [DOI] [PubMed] [Google Scholar]
- 14. Pin J. P., Galvez T., Prézeau L. (2003) Evolution, structure, and activation mechanism of family 3/C G-protein-coupled receptors. Pharmacol. Ther. 98, 325–354 [DOI] [PubMed] [Google Scholar]
- 15. Cavanagh J., Fairbrother W., Palmer A., 3rd, Skelton N., Rance M. (2007) Protein NMR Spectroscopy: Principles and Practice, 2nd Ed., Academic Press, San Diego [Google Scholar]
- 16. Vuister G. W., Bax A. (1993) Quantitative J correlation: a new approach for measuring homonuclear three-bond J(HNHα) coupling constants in 15N-enriched proteins. J. Am. Chem. Soc. 115, 7772–7777 [Google Scholar]
- 17. Farrow N. A., Muhandiram R., Singer A. U., Pascal S. M., Kay C. M., Gish G., Shoelson S. E., Pawson T., Forman-Kay J. D., Kay L. E. (1994) Backbone dynamics of a free and phosphopeptide-complexed Src homology 2 domain studied by 15N NMR relaxation. Biochemistry 33, 5984–6003 [DOI] [PubMed] [Google Scholar]
- 18. Delaglio F., Grzesiek S., Vuister G. W., Zhu G., Pfeifer J., Bax A. (1995) NMRPipe: a multidimensional spectral processing system based on UNIX pipes. J. Biomol. NMR 6, 277–293 [DOI] [PubMed] [Google Scholar]
- 19. Güntert P., Mumenthaler C., Wüthrich K. (1997) Torsion angle dynamics for NMR structure calculation with the new program DYANA. J. Mol. Biol. 273, 283–298 [DOI] [PubMed] [Google Scholar]
- 20. Herrmann T., Güntert P., Wüthrich K. (2002) Protein NMR structure determination with automated NOE assignment using the new software CANDID and the torsion angle dynamics algorithm DYANA. J. Mol. Biol. 319, 209–227 [DOI] [PubMed] [Google Scholar]
- 21. Cornilescu G., Delaglio F., Bax A. (1999) Protein backbone angle restraints from searching a database for chemical shift and sequence homology. J. Biomol. NMR 13, 289–302 [DOI] [PubMed] [Google Scholar]
- 22. Koradi R., Billeter M., Wüthrich K. (1996) MOLMOL: a program for display and analysis of macromolecular structures. J. Mol. Graph. 14, 51–55, 29–32 [DOI] [PubMed] [Google Scholar]
- 23. Takai K., Sawasaki T., Endo Y. (2010) Practical cell-free protein synthesis system using purified wheat embryos. Nat. Protoc. 5, 227–238 [DOI] [PubMed] [Google Scholar]
- 24. Kunishima N., Shimada Y., Tsuji Y., Sato T., Yamamoto M., Kumasaka T., Nakanishi S., Jingami H., Morikawa K. (2000) Structural basis of glutamate recognition by a dimeric metabotropic glutamate receptor. Nature 407, 971–977 [DOI] [PubMed] [Google Scholar]
- 25. Emanuelsson O., Brunak S., von Heijne G., Nielsen H. (2007) Locating proteins in the cell using TargetP, SignalP and related tools. Nat. Protoc. 2, 953–971 [DOI] [PubMed] [Google Scholar]
- 26. Vestweber D., Schatz G. (1988) Mitochondria can import artificial precursor proteins containing a branched polypeptide chain or a carboxy-terminal stilbene disulfonate. J. Cell Biol. 107, 2045–2049 [DOI] [PMC free article] [PubMed] [Google Scholar]
- 27. Li X., Staszewski L., Xu H., Durick K., Zoller M., Adler E. (2002) Human receptors for sweet and umami taste. Proc. Natl. Acad. Sci. U.S.A. 99, 4692–4696 [DOI] [PMC free article] [PubMed] [Google Scholar]
- 28. Masuda K., Koizumi A., Nakajima K., Tanaka T., Abe K., Misaka T., Ishiguro M. (2012) Characterization of the modes of binding between human sweet taste receptor and low-molecular-weight sweet compounds. PLoS One 7, e35380. [DOI] [PMC free article] [PubMed] [Google Scholar]
- 29. Temussi P., Lelj F., Tancredi T. (1991) in Sweeteners: Discovery, Molecular Design, and Chemoreception (Walters D., Orthoefer F., DuBois G., eds) pp. 143–161, American Chemical Society, Washington, D. C [Google Scholar]
- 30. Tancredi T., Pastore A., Salvadori S., Esposito V., Temussi P. A. (2004) Interaction of sweet proteins with their receptor: a conformational study of peptides corresponding to loops of brazzein, monellin and thaumatin. Eur. J. Biochem. 271, 2231–2240 [DOI] [PubMed] [Google Scholar]
- 31. Temussi P. (2002) Why are sweet proteins sweet? Interaction of brazzein, monellin and thaumatin with the T1R2-T1R3 receptor. FEBS Lett. 526, 1–4 [DOI] [PubMed] [Google Scholar]
- 32. Morini G., Bassoli A., Temussi P. (2005) From small sweeteners to sweet proteins: anatomy of the binding sites of the human T1R2_T1R3 receptor. J. Med. Chem. 48, 5520–5529 [DOI] [PubMed] [Google Scholar]
- 33. Garimella R., Xu Y., Schein C. H., Rajarathnam K., Nagle G. T., Painter S. D., Braun W. (2003) NMR solution structure of attractin, a water-borne protein pheromone from the mollusk Aplysia californica. Biochemistry 42, 9970–9979 [DOI] [PubMed] [Google Scholar]
- 34. Mronga S., Luginbühl P., Brown L. R., Ortenzi C., Luporini P., Bradshaw R. A., Wüthrich K. (1994) The NMR solution structure of the pheromone Er-1 from the ciliated protozoan Euplotes raikovi. Protein Sci. 3, 1527–1536 [DOI] [PMC free article] [PubMed] [Google Scholar]
- 35. Weiss M. S., Anderson D. H., Raffioni S., Bradshaw R.A., Ortenzi C., Luporini P., Eisenberg D. (1995) A cooperative model for receptor recognition and cell adhesion: evidence from the molecular packing in the 1.6-Å crystal structure of the pheromone Er-1 from the ciliated protozoan Euplotes raikovi. Proc. Natl. Acad. Sci. U.S.A. 92, 10172–10176 [DOI] [PMC free article] [PubMed] [Google Scholar]
- 36. Orengo C. A., Jones D. T., Thornton J. M. (1994) Protein superfamilies and domain superfolds. Nature 372, 631–634 [DOI] [PubMed] [Google Scholar]
- 37. Böcskei Z., Groom C. R., Flower D. R., Wright C. E., Phillips S. E., Cavaggioni A., Findlay J. B., North A. C. (1992) Pheromone binding to two rodent urinary proteins revealed by x-ray crystallography. Nature 360, 186–188 [DOI] [PubMed] [Google Scholar]
- 38. Vincent F., Löbel D., Brown K., Spinelli S., Grote P., Breer H., Cambillau C., Tegoni M. (2001) Crystal structure of aphrodisin, a sex pheromone from female hamster. J. Mol. Biol. 305, 459–469 [DOI] [PubMed] [Google Scholar]