

Abstract
Background
The degree of agreement between patient- and clinician-rated scales of depressive severity varies widely. This study analyzed agreement between commonly used depression rating scales in the Prevention of Recurrent Episodes of Depression with Venlafaxine Extended Release (ER) for Two Years (PREVENT) trial.
Methods
The PREVENT trial was a multiphase, randomized, double-blind study of patients with recurrent major depressive disorder. This secondary analysis evaluated acute (10 weeks) and continuation phase (6 months) data. Pearson correlation coefficients at each acute-phase (weekly) and continuation-phase (monthly) visit were calculated for patient-rated (30-item Inventory of Depressive Symptomatology-Self-Rated [IDS-SR30] and clinician-rated (17-item Hamilton Rating Scale for Depression [HAM-D17] and Clinical Global Impressions-Severity [CGI-S]) measures and for response and remission.
Results
Data from 1,047 patients were analyzed. The respective correlation coefficients at baseline, week 10, and month 6 were: IDS-SR30: HAM-D17: 0.46, 0.75, 0.70; and for IDS-SR30: CGI-S 0.28, 0.67, 0.65. Agreement between IDS-SR30- and HAM-D17-defined remission and response was relatively poor: week 10, 0.52 and 0.34, respectively; month 6, 0.45 and 0.32, respectively.
Conclusions
These findings suggest that patient-rated measures of depression severity do not correspond strongly with clinician ratings, and are particularly poor prior to the initiation of treatment.
Keywords: Major depressive disorder, Antidepressants, Outcomes assessment, Psychiatric status rating scales, Ratings, Clinical trials as a topic, Inventory of depressive symptoms
1. Introduction
Accurate measurement of depression severity is of fundamental importance to the design and conduct of clinical trials of treatments for major depressive disorder (MDD). Depression severity is used to determine eligibility for trial participation and to assess response to treatment. In addition, regulatory agencies typically require a clinician-administered rating scale be used as the primary outcome measure of studies of new treatments for psychiatric disorders. Replacing clinician-rated measures of depression severity with self-reported measures offers the promise of reducing both the cost of clinical trials and the time burden for patients who participate in trials. However, the question of whether self-reports are sufficiently accurate to measure depression severity and improvement remains unresolved.
The 17-item Hamilton Rating Scale for Depression (HAM-D17) (Hamilton, 1960) and the 10-item Montgomery Åsberg Depression Rating Scale (MADRS) (Montgomery and Åsberg, 1979) are the most widely used clinician-administered depression rating scales in clinical trials. In addition, the Clinical Global Impressions—Severity (CGI-S) (Guy, 1976) and Clinical Global Impressions—Change (CGI-C) (Guy, 1976), which use a single score to represent the investigator's overall assessment of the patient's illness and improvement since starting treatment, are validated and commonly employed secondary outcome measures.
The most commonly used self-report measures in studies of major depression are the Beck Depression Inventory (Beck et al., 1961) and the Inventory of Depressive Symptomatology, which comes in 2 forms: a 30-item version (Inventory of Depressive Symptomatology—Self-Report [IDS-SR30]) and a shorter, 16-item version (Quick Inventory of Depressive Symptomatology—Self-Report [QIDS-SR16]) (Rush et al., 1996; Rush et al., 2003). In addition, interactive voice response system versions of the MADRS, HAM-D17, and QIDS-SR16 have a growing role in clinical trials of MDD (Mundt et al., 2006; Rush et al., 2006a,b). The increasing importance of self-reported measures was recently demonstrated in the published results of the Sequenced Treatment Alternatives to Relieve Depression (STAR*D) study, which used the QIDS-SR16 as an outcome measure for response and remission (Trivedi et al., 2006).
Historically, clinician-rated scales have been considered to have greater validity in assessing depression severity than patient-rated scales (Rush et al., 2005). However, some have argued that the validity of clinicians' ratings is jeopardized when raters assess both efficacy and side effects, due to unmasking effects that occur through detecting subtle cues that reveal which patients are on active medication or placebo (Greenberg et al., 1992). Support for this argument derives from the finding that in some studies only clinician-rated outcomes, not self-reports, demonstrated superiority of active treatment over placebo (Lambert et al., 1986). Such findings pose uncertainty about which problem is greater: the potential for bias in clinician ratings arising from possible unblinding or the inconsistency and insensitivity to change in patient ratings.
Previous studies exploring the correlation between clinician and patient-rated scales of depression severity have reached differing conclusions about the level of agreement between scales, with correlation coefficients ranging from 0.12 to 0.93 (Corruble et al., 1999; Domken et al., 1994; Dorz et al., 2004; Faravelli et al., 1986; Rush et al., 2005; Rush et al., 2006a; Senra and Polaino, 1993). Sources of this variability include differences in the specific self- and clinician-rated scales employed, the point in treatment when the scales were administered (i.e., baseline versus end point), type and severity of depressive illness, demographic characteristics of the patients, presence of comorbid illnesses, and order of scale completion (clinician first or patient first). “Rater inflation” is another potential source of scale disagreement, particularly at the screening and baseline visits of a trial. Rater inflation refers to the process whereby clinicians, incentivized to enroll patients into studies, may artificially elevate their ratings in order to get a patient over a set severity threshold (Landin et al., 2000). Given the growing role of self-reported measures as inclusion criteria and outcome measures in MDD trials, there is an urgent need to more thoroughly assess the relationships between patient- and clinician-rated measures.
In order to further explore these questions, we conducted a secondary analysis of data from the Prevention of Recurrent Episodes of Depression with Venlafaxine for Two Years (PREVENT) trial. The acute and continuation phases of the PREVENT trial compared the efficacy and safety of venlafaxine extended release (ER) with fluoxetine in outpatients with recurrent unipolar depression. We hypothesized that correlations between the patient- and clinician-rated measures of depression severity would be lower at study entry than have been reported to date in the literature, and that these correlations at the acute and continuation phase endpoints would improved and be similar to findings from previous reports. Herein we examine correlations between in patients enrolled in the PREVENT trial and measure the effects of time on these correlations. In addition, we determine concordance between patient- and clinician-rated assessments of depression remission and response.
2. Methods
Data for this secondary analysis were derived from the acute and continuation phases of the PREVENT study (Keller et al., 2007b). The study enrolled patients from 29 sites in the United States and was conducted in accordance with the Declaration of Helsinki and its amendments.
2.1. PREVENT design
The PREVENT study was a multiphase, multicenter, randomized, double-blind clinical trial designed to assess the efficacy of long-term venlafaxine ER maintenance treatment in outpatients with recurrent MDD. Details of the PREVENT design and baseline demographics of the participants are detailed elsewhere (Keller et al., 2007b). Briefly, PREVENT began with a 10-week, acute-treatment phase during which patients received double-blind venlafaxine ER or fluoxetine; this was followed by a 6-month continuation phase and 2 consecutive 12-month maintenance phases (Keller et al., 2007a; Keller et al., 2007b). This analysis uses data only from the acute and continuation phases of the study.
The patient population consisted of men and women at least 18 years of age with recurrent depression who met Diagnostic and Statistical Manual of Mental Disorders, Fourth Edition (American Psychiatric Association, 1994) diagnostic criteria for MDD for at least 1 month prior to the start of the study (Keller et al., 2007b). Recurrent depression was defined as a history of at least 3 episodes of major depression, with 2 or more episodes (including the current episode) occurring in the past 5 years, and an interval of at least 2 months between the end of the previous episode and the beginning of the current episode (Keller et al., 2007b). Eligible patients had a total score of at least 20 on the HAM-D17 at screening and at least 18 at randomization 1 week later (Keller et al., 2007b).
2.2. Assessments
Screening evaluations were performed by qualified site personnel, which in some cases may have been the clinician who served as blinded rater for the patient through the trial. The primary efficacy assessment was the HAM-D17, which was administered by blinded, certified raters. Other clinician-rated efficacy instruments were the CGI-S and the CGI-C scales (Keller et al., 2007b). The patient-rated instrument was the IDS-SR30 (Keller et al., 2007b), from which the QIDS-SR16 was extracted. The order of administration of the scales was usually for the patient to complete IDS-SR30 first, followed by the HAM-D17 and then the physician-administered CGI. However, the order was not required by the protocol, nor systematically varied across subjects. A patient global impression rating scale was not collected as part of this study protocol. Outcome assessments were administered at screening and baseline visits, at weeks 1, 2, 3, 4, 6, 8, and 10 during the acute phase, and once monthly for each of the 6 months of the continuation phase (Keller et al., 2007b).
2.3. Rater certification
The blinded raters at each site were required to have been regularly administering the HAM-D17 for at least 1 year prior to the start of the study. All such identified raters submitted to Quintiles (a clinical research organization) their scoring of a videotaped interview of the HAM-D17, which was evaluated by an independent reviewer to ensure that the rater met a minimum acceptability rating. After certification, inter-rater reliability sessions were held at each site every 6 months until study completion.
2.4. Statistical analysis
Data were analyzed from the intent-to-treat (ITT) populations for both the acute (N=1047) and continuation (N=715) phases. The ITT population consisted of patients who had a baseline evaluation, at least one post-baseline dose of study medication, and one or more HAM-D17 evaluations after the first dose of study medication (Keller et al., 2007b). For purposes of comparing changes on clinician-rated assessments with changes on the IDS-SR30 and QIDS-SR16, response for this secondary analysis was defined as (1) a CGI-C score≤2, (2) a CGI-S score≤3, (3) a ≥50% reduction from baseline on HAM-D17 total score,(4) a ≥50% reduction from baseline on IDS-SR30 total score or (5) a ≥50% reduction from baseline on QIDS-SR16 total score. Remission was defined as (1) CGI-S score≤2, (2) HAM-D17 total score≤7, (3) IDS-SR30 total score≤14, or (4) QIDS-SR16 score≤5. Qualitative data (e.g., sex, depression severity, and rates of response/remission) are reported as raw values and percentages. Quantitative data are described as means plus standard deviations. The level of statistical significance was established at P<0.05 for all analyses (Keller et al., 2007b).
Pearson correlation coefficients (r) were computed between mean total scores on the IDS-SR30 and QIDS-SR16 and mean total scores on the HAM-D17, CGI-S, and CGI-C.
Cohen's kappa statistics were used to measure the level of agreement between patient- and clinician-rated measures of response and remission at acute-phase week 10 and continuation-phase month 6. Cohen's kappa coefficient can be classed as poor (<0.2), fair (0.2–0.4), moderate (0.4–0.6), good (0.6–0.8) and very good (>0.8) (Landis and Koch, 1977).
Baseline HAMD-17 and IDS scores were of a limited range of values because scores were only available for patients qualifying for the trial (i.e. had a baseline HAMD score>17). This restricted range will attenuate the correlation between the scales, underestimating the actual true correlation. In order to disattenuate these correlations, we explored two correction methods for adjusting correlation coefficients. First, we applied a method (Cronbach's alpha) based on the reliability of each of the two correlated measures, which produce a correlation estimate corrected for imperfect reliability of each scale. Cronbach's alpha is one method for estimating the internal consistency component of reliability, thereby correcting for measurement error from the raw correlation coefficient (Nunnally and Bernstein, 1994). However, violations of the assumptions for the validity of Cronbach's alpha as a measure of reliability may result in adjusted correlations greater than one. In addition, Cronbach's alpha cannot be applied to scales that consist of a single item, such as the CGI. In the second approach, we applied Thorndike's case 2 correction method (Thorndike, 1949). This commonly used method is appropriate when range restriction arises from direct range restriction (i.e. the sample is selected based directly on a scale score), as is the case in this analysis (Wiberg and Sundstrom, 2009). The method requires the use of the “true” variance in both the restricted and unrestricted samples. Without access to the unrestricted sample, we used the timepoint of maximum variance (week 10) to estimate the unrestricted sample variance.
3. Results
3.1. Baseline characteristics and response and remission rates
Treatment groups were well-matched for demographic characteristics and baseline disease severity, with the exception of a slightly greater proportion of severely depressed patients randomly assigned to the fluoxetine treatment arm. The mean age of patients in the study was 40 years, and the sample was 65% female. Mean duration of the current depressive episode was 7.2 months. The baseline mean HAM-D17, IDS-SR30, and CGI-S scores were 22.7, 43.0, and 4.3, respectively (Keller et al., 2007b).
As previously reported in the primary outcome analyses, 79% of patients in both treatment groups fulfilled the study's primary definition for response at the conclusion of the acute phase. Remission rates at the end of the acute phase were 49% for venlafaxine ER and 50% for fluoxetine. After 6 months of continuation treatment, remission rates were 72% for patients in the venlafaxine ER group and 69% for fluoxetine-treated patients (Keller et al., 2007b).
3.2. Correlations
The mean percent change from baseline on the HAM-D17, IDS-SR30, and QIDS-SR16 scores at each visit during the acute phase is shown in Fig. 1. Correlations between patient- (IDS-SR30) and clinician-rated measures of depression severity were modest (HAM-D17, r=0.46) or weak (CGI-S, r=0.28) at baseline, but improved by week 2 (HAM-D17, r=0.65; CGI-S, r=0.56) and remained stable thereafter (data not shown). By week 10 of the acute phase, correlations between patient- and clinician-ratings were relatively strong between IDS-SR30 scores and HAM-D17 (r=0.75), CGI-S (r=0.67), and CGI-C (r=0.60) scores (Table 1). At continuation-phase month 6, IDS-SR30 scores correlated with HAM-D17 (r=0.70) and CGI-S (r=0.65) (Table 1). All correlations throughout the acute and continuation phases were statistically significant (P<0.001).
Fig. 1.
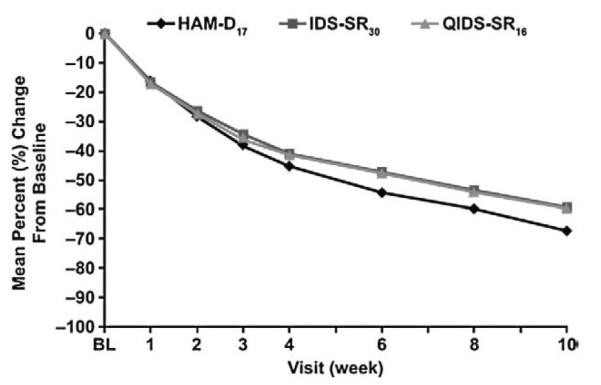
Mean percent change from baseline score by visit in acute phase. BL, baseline; HAM-D17, 17-item Hamilton Rating Scale for Depression; IDS-SR30, 30-item Inventory of Depressive Symptomatology—Self-Report; QIDS-SR16, 16-item Quick Inventory of Depressive Symptomatology—Self-Report.
Table 1.
Pearson correlations between patient-rated IDS-SR30 total score and clinician-rated depression measures, acute and continuation phases (ITT population).
| Scale | Acute phase |
Acute phase |
Continuation phase |
|||||||||
|---|---|---|---|---|---|---|---|---|---|---|---|---|
| Baseline |
Week 10 |
Month 6 |
||||||||||
| n | Mean (S.D.) | r1 | r2 | n | Mean (S.D.) | r1 | r2 | n | Mean (S.D.) | r1 | r2 | |
| IDS-SR30 total | 1026 | 43.06 (9.78) | 785 | 17.37 (11.63) | 435 | 12.32 (9.51) | ||||||
| QIDS-SR16 total | 1032 | 20.56 (5.50) | 786 | 8.06 (5.60) | 436 | 5.71 (4.57) | ||||||
| HAM-D17 total | 1047 | 22.64 (3.11) | 0.46* | 0.43* | 789 | 7.32 (4.96) | 0.75* | 0.73* | 435 | 4.86 (3.94) | 0.70* | 0.66* |
| CGI-S | 1045 | 4.28 (0.56) | 0.28* | 0.27* | 785 | 2.00 (0.97) | 0.67* | 0.63* | 434 | 1.50 (0.78) | 0.65* | 0.63* |
| CGI-C | - | - | - | 785 | 1.61 (0.82) | 0.60* | 0.58* | - | - | - | ||
CGI-C, Clinical Global Impressions—Change; CGI-S, Clinical Global Impressions—Severity; HAM-D17, 17-item Hamilton Rating Scale for Depression; IDS-SR30, 30-item Inventory of Depressive Symptomatology—Self-Report; ITT, intent-to-treat; S.D., standard deviation; r1, Pearson correlation coefficient of scales with IDS-SR30 total; r2, Pearson correlation coefficient of scales with QIDS-SR16 total.
P<0.0001.
3.3. Response and remission
The agreement between IDS-SR30 and clinician-rated depression measures was generally stronger for remitting patients than for patients who responded, but did not remit. Differences between remission and response were especially apparent for agreement between the IDS-SR30 and the HAM-D17 at week 10 (remission κ=0.52 versus response κ=0.34) and month 6 (remission κ=0.45 versus response κ=0.32). Similarly, correlations between the QIDS-SR16 and HAM-D17 were stronger for remitters than responders (Table 2). Comparison of visit-wise data from baseline through acute-phase week 10 showed stronger correlations between HAM-D17 and IDS-SR30 at week 10 compared with week 1 for measures of remission, but not for response (Table 3). Correlations between the QIDS-SR16 and HAM-D17 improved between weeks 1 and 10 (Table 4). Patient self-ratings of depression severity using the IDS-SR30 were moderately correlated with scores using the QIDS-SR16 (Table 5).
Table 2.
Agreement in responsea and remissionb ratings for patient-rated IDS-SR30 and QIDS-SR16 compared with clinician-rated measures at week 10 (acute-phase end point) and month 6 (continuation-phase end point); n (%) of patients.
| Acute phase | Continuation phase | |||||||||||||||
|---|---|---|---|---|---|---|---|---|---|---|---|---|---|---|---|---|
| Week 10 |
Month 6 |
|||||||||||||||
| HAM-D17 |
CGI-S |
CGI-C |
HAM-D17 |
CGI-S |
||||||||||||
| Yes | No | κ | Yes | No | κ | Yes | No | κ | Yes | No | κ | Yes | No | κ | ||
| IDS-SR30 | Responder | 0.34* | 0.20* | 0.26* | 0.32* | 0.17* | ||||||||||
| Yes | 499 (95) | 25(5) | 510 (98) | 11 (2) | 494 (95) | 27 (5) | 344 (99) | 3 (1) | 346 (100) | 0 (0) | ||||||
| No | 172 (66) | 88 (34) | 212 (82) | 47 (18) | 189 (73) | 70 (27) | 66 (76) | 21 (24) | 77 (89) | 10 (12) | ||||||
| Remitter | 0.52* | 0.42* | 0.45* | 0.35* | ||||||||||||
| Yes | 330 (86) | 55 (14) | 353 (92) | 29 (8) | - | - | 271 (93) | 21 (7) | 283 (97) | 8 (3) | ||||||
| No | 134 (34) | 265 (66) | 199 (50) | 199 (50) | - | - | 74 (52) | 68 (48) | 97 (68) | 45 (32) | ||||||
| QIDS-SR16 | Responder | 0.33* | 0.21* | 0.28* | 0.24* | 0.15* | ||||||||||
| Yes | 498 (95) | 26 (5) | 511 (98) | 10 (2) | 497 (95) | 24 (5) | 340 (98) | 7 (2) | 345 (100) | 1 (0) | ||||||
| No | 174 (67) | 87 (33) | 212 (81) | 48 (19) | 187 (72) | 73 (28) | 71 (81) | 17 (19) | 79 (90) | 9 (10) | ||||||
| Remitter | 0.45* | 0.36* | ||||||||||||||
| Yes | 270 (90) | 29 (10) | 278 (93) | 20 (7) | 0.31* | - | - | 236 (94) | 16 (6) | 246 (98) | 5 (2) | 0.27* | ||||
| No | 195 (40) | 291 (60) | 275 (57) | 208 (43) | - | - | 110 (60) | 73 (40) | 135 (74) | 48 (26) | ||||||
CGI-C, Clinical Global Impressions—Change; CGI-S, Clinical Global Impressions—Severity; HAM-D17, 17-item Hamilton Rating Scale for Depression; IDS-SR30, 30-item Inventory of Depressive Symptomatology—Self-Report; κ, kappa statistic; QIDS-SR16, 16-item Quick Inventory of Depressive Symptomatology—Self-Report.
Response definitions: CGI-S score≤3; CGI-C score≤2; HAM-D17≥50% reduction from baseline; IDS-SR30≤50% reduction from baseline; QIDS-SR16≥50% reduction from baseline.
Remission definitions: CGI-S score≤2; HAM-D17 total score≤7; IDS-SR30 total score≤14; QIDS-SR16 total score≤5.
P<0.0001.
Table 3.
Agreement in responsea and remissionb ratings for patient-rated IDS-SR30 compared with clinician-rated measures from baseline through acute-phase week 10; n (%) of patients.
| HAM-D17 |
CGI-S |
CGI-C |
||||||||||||||
|---|---|---|---|---|---|---|---|---|---|---|---|---|---|---|---|---|
| Responder |
Remitter |
Responder |
Remitter |
Responder |
||||||||||||
| Week | IDS-SR30 | Yes | No | κ | Yes | No | κ | Yes | No | κ | Yes | No | κ | Yes | No | κ |
| Baselinec | Yes | 0 (0) | 0 (0) | - | 0 (0) | 2 (100) | −0.001 | - | - | - | 0 (0) | 2 (100) | −0.001 | - | - | - |
| No | 0 (0) | 1026 (100) | 1 (<1) | 1023 (>99) | 19 (2) | 1006 (98) | 1 (<1) | 1022 (>99) | - | - | - | |||||
| Week 1c | Yes | 22 (37) | 37 (63) | 0.33* | 8 (24) | 26 (76) | 0.23* | 32 (54) | 27 (46) | 0.20* | 7 (21) | 27 (79) | 0.21* | 28 (48) | 31 (52) | 0.28* |
| No | 37 (4) | 891 (96) | 22 (2) | 931 (98) | 148 (16) | 780 (84) | 19 (2) | 934 (98) | 81 (9) | 847 (91) | ||||||
| Week 2 | Yes | 88 (64) | 49 (36) | 0.47* | 34 (49) | 35 (51) | 0.48* | 114 (84) | 22 (16) | 0.29* | 36 (53) | 32 (47) | 0.41* | 97 (71) | 40 (29) | 0.39* |
| No | 90 (11) | 711 (89) | 29 (3) | 840 (97) | 269 (34) | 531 (66) | 54 (6) | 814 (94) | 149 (19) | 650 (81) | ||||||
| Week 3c | Yes | 180 (74) | 62 (26) | 0.50* | 63 (53) | 56 (47) | 0.46* | 218 (90) | 24 (10) | 0.31* | 79 (66) | 40 (34) | 0.43* | 186 (77) | 56 (23) | 0.38* |
| No | 132 (20) | 536 (80) | 57 (7) | 734 (93) | 317 (48) | 350 (52) | 107 (14) | 683 (86) | 206 (31) | 461 (69) | ||||||
| Week 4 | Yes | 272 (80) | 66 (20) | 0.51* | 130 (64) | 74 (36) | 0.51* | 314 (93) | 23 (7) | 0.30* | 146 (72) | 57 (28) | 0.46* | 299 (89) | 38 (11) | 0.43* |
| No | 154 (26) | 430 (74) | 85 (12) | 633 (88) | 336 (58) | 248 (42) | 139 (19) | 579 (81) | 238 (41) | 345 (59) | ||||||
| Week 6 | Yes | 367 (89) | 45 (11) | 0.51* | 213 (78) | 60 (22) | 0.57* | 405 (98) | 6 (2) | 0.30* | 235 (86) | 37 (14) | 0.49* | 389 (95) | 22 (5) | 0.39* |
| No | 175 (37) | 297 (63) | 110 (18) | 501 (82) | 318 (68) | 151 (32) | 182 (30) | 426 (70) | 256 (55) | 213 (45) | ||||||
| Week 8 | Yes | 416 (92) | 38 (8) | 0.46* | 256 (81) | 59 (19) | 0.56* | 447 (99) | 4 (1) | 0.27* | 267 (86) | 45 (14) | 0.44* | 428 (95) | 23 (5) | 0.34* |
| No | 165 (47) | 183 (53) | 113 (23) | 374 (77) | 256 (74) | 88 (26) | 186 (38) | 297 (62) | 219 (64) | 125 (36) | ||||||
| Week 10 | Yes | 499 (95) | 25 (5) | 0.34* | 330 (86) | 55 (14) | 0.52* | 510 (98) | 11 (2) | 0.20* | 353 (92) | 29 (8) | 0.42* | 494 (95) | 27 (5) | 0.26* |
| No | 172 (66) | 88 (34) | 134 (34) | 265 (66) | 212 (82) | 47 (18) | 199 (50) | 199 (50) | 189 (73) | 70 (27) | ||||||
CGI-C, Clinical Global Impressions—Change; CGI-S, Clinical Global Impressions—Severity; HAM-D17, 17-item Hamilton Rating Scale for Depression; IDS-SR30, 30-item Inventory of Depressive Symptomatology—Self-Report; κ kappa statistic.
Response: CGI-S score≤3, CGI-C score≤2, and ≥50% reduction from baseline on HAM-D17 total score, IDS-SR30 total score.
Remission: CGI-S score≤2, HAM-D17 total score≤7, IDS-SR30 total score≤14, and QIDS-SR16 total score≤5.
IDS-SR30 values missing for ≥1.0% of patients: baseline, 21/1047 (2.0%); week 1, 11/999 (1.1%); week 3,12/923 (1.3%).
P<0.0001.
Table 4.
Agreement in responsea and remissionb ratings for patient-rated QIDS-SR16 compared with clinician-rated HAM-D17 from baseline through acute-phase week 10; n (%) of patients.
| HAM-D17 |
|||||||
|---|---|---|---|---|---|---|---|
| Responder |
Remitter |
||||||
| QIDS-SR16 | Yes | No | κ | Yes | No | κ | |
| Baselinec | Yes | - | - | - | 3 (100) | −0.002 | |
| No | - | 1032 (100) | 1 (<1) | 1028 (99) | |||
| Week 1 | Yes | 26 (22) | 92 (78) | 0.23* | 7 (25) | 21 (75) | 0.21* |
| No | 34 (4) | 837 (96) | 24 (2) | 937 (98) | |||
| Week 2 | Yes | 110 (52) | 103 (48) | 0.45* | 24 (39) | 38 (61) | 0.34* |
| No | 69 (10) | 657 (90) | 39 (4) | 838 (96) | |||
| Week 3 | Yes | 190 (65) | 103 (35) | 0.44* | 47 (47) | 53 (53) | 0.35* |
| No | 122 (20) | 499 (80) | 73 (9) | 741 (91) | |||
| Week 4 | Yes | 283 (74) | 102 (26) | 0.46* | 105 (66) | 53 (34) | 0.46* |
| No | 145 (27) | 395 (73) | 110 (14) | 657 (86) | |||
| Week 6 | Yes | 396 (83) | 80 (17) | 0.48* | 155 (80) | 40 (20) | 0.45* |
| No | 147 (36) | 262 (64) | 168 (24) | 522 (76) | |||
| Week 8 | Yes | 441 (91) | 43 (9) | 0.50* | 210 (83) | 43 (17) | 0.48* |
| No | 141 (44) | 178 (56) | 160 (29) | 390 (71) | |||
| Week 10 | Yes | 498 (95) | 26 (5) | 0.33* | 270 (90) | 29 (10) | 0.45* |
| No | 174 (67) | 87 (33) | 195 (40) | 291 (60) | |||
HAM-D17, 17-item Hamilton Rating Scale for Depression; κ, kappa statistic; QIDS-SR16, 16-item Quick Inventory of Depressive Symptomatology—Self-Report.
Response: ≥50% reduction from baseline on HAM-D17 total score and QIDS-SR16 total score.
Remission: HAM-D17 total score≤7, QIDS-SR16 total score≤5.
QIDS-SR16 values missing for ≥1.0% of patients: baseline, 15/1047 (1.4%).
P<0.0001.
Table 5.
Agreement in responsea and remissionb for patient-rated IDS-SR30 compared with patient-rated QIDS-SR16 at week 10 (acute-phase end point) and month 6 (continuation-phase end point); n (%) of patients.
| QIDS-SR16 |
||||||
|---|---|---|---|---|---|---|
| Week 10 |
Month 6 |
|||||
| Yes | No | κ | Yes | No | κ | |
| IDS-SR30 responder | 0.79* | 0.72* | ||||
| Yes | 487 (93) | 37 (7) | 328 (94) | 20 (6) | ||
| No | 36 (14) | 225 (86) | 19 (22) | 68 (78) | ||
| IDS-SR30 remitter | 0.71* | 0.69* | ||||
| Yes | 285 (74) | 100 (26) | 241 (82) | 52 (18) | ||
| No | 13 (3) | 387 (97) | 11 (8) | 131 (92) | ||
IDS-SR30, 30-item Inventory of Depressive Symptomatology—Self-Report; κ, kappa statistic; QIDS-SR16, 16-item Quick Inventory of Depressive Symptomatology—Self-Report.
Response: 50% reduction from baseline on IDS-SR30 and QIDS-SR16 total score.
Remission: IDS-SR30 total score≤13 and QIDS-SR16 total score≤5.
P<0.0001.
Table 6 demonstrates the results of methods used to correct for attenuation stemming from restricted range of scores. At baseline, the Cronbach's alpha method correlations exceeded 1, reflecting that the restricted range of scores made the method unviable. The correlations using the Thorndike's case 2 correction method appear superior, but it relies on the untestable assumption that week 10 variance is a good approximation for the variance at the baseline or month 6 scores.
Table 6.
Adjusted correlation values with methods to correct for attenuation.
| Timepoint | Predictor (X) | Dependent (Y) | Observed correlation | Cronbach's alpha method |
Thorndike's case 2 method |
||||
|---|---|---|---|---|---|---|---|---|---|
| Adjusted correlationa | Alpha var 1 | Alpha var 2 | Adjusted correlation | True variancea | Observed variance | ||||
| Baseline | HAM-D17 | IDS-SR30 | 0.46 | 1.21 | 0.18 | 0.78 | 0.80 | 24.58 | 9.40 |
| HAM-D17 | QIDS-SR16 | 0.40 | 1.17 | 0.18 | 0.64 | 0.75 | 24.58 | 9.40 | |
| CGI-S | IDS-SR30 | 0.27 | n.a. | 0.66 | 0.95 | 0.31 | |||
| CGI-S | QIDS-SR16 | 0.24 | n.a. | 0.61 | 0.95 | 0.31 | |||
| Week 10 | HAM-D17 | IDS-SR30 | 0.75 | 0.91 | 0.76 | 0.89 | 0.75 | 24.58 | 24.58 |
| HAM-D17 | QIDS-SR16 | 0.73 | 0.93 | 0.76 | 0.80 | 0.73 | 24.58 | 24.58 | |
| CGI-S | IDS-SR30 | 0.67 | n.a. | 0.67 | 0.95 | 0.95 | |||
| CGI-S | QIDS-SR16 | 0.63 | n.a. | 0.63 | 0.95 | 0.95 | |||
| Month 6 | HAM-D17 | IDS-SR30 | 0.70 | 0.87 | 0.72 | 0.88 | 0.84 | 24.58 | 15.54 |
| HAM-D17 | QIDS-SR16 | 0.67 | 0.91 | 0.72 | 0.74 | 0.82 | 24.58 | 15.54 | |
| CGI-S | IDS-SR30 | 0.65 | n.a. | 0.80 | 0.95 | 0.60 | |||
| CGI-S | QIDS-SR16 | 0.64 | n.a. | 0.79 | 0.95 | 0.60 | |||
CGI-S, Clinical Global Impressions–Severity; HAM-D17, 17-item Hamilton Rating Scale for Depression; IDS-SR30, 30-item Inventory of Depressive Symptomatology–Self-Report; QIDS-SR16, 16-item Quick Inventory of Depressive Symptomatology–Self-Report.
For the Thorndike's case 2 method, variable 1 serves as the predictor (X), and variable 2 serves as the dependent variable (Y).
Note: True variance is an unknown, for this estimate the maximum observed variance (week 10) is used to adjust baseline and month 6 correlations. Week 10 values are reference and unchanged using this approach.
4. Discussion
In this secondary analysis of the PREVENT data set, we found that correlations between the patient-rated IDS-SR30 and clinician-rated measures of depression severity are moderate (HAM-D17) or weak (CGI-S) at baseline, but improve somewhat during acute treatment and remain stable throughout 6 months of continuation treatment. We found only a modest agreement for the defined cut-off values for remission between the HAM-D17 and IDS-SR30 total scores (κ=0.52) and the HAM-D17 and QIDS-SR16 total scores (κ=0.45) after 10 weeks of treatment. Further, the strength of these correlations deteriorated over time at the 6-month follow-up. The level of agreement for the defined cut-off values for response was considerably weaker than for remission.
The results of this study are in contrast with the most comparable previously published analysis, that of Rush et al. (2005), who analyzed the 12-week outcomes of 602 patients treated with nefazodone, psychotherapy, or their combination. Their analysis found high (>0.8) intraclass correlations between the 24-item HAMD (HAM-D24) and the IDS-SR30 and QIDS-SR16. These authors also found higher rates of agreement on remission (IDS-SR30: HAM-D24 κ=0.66; QIDS-SR16: HAM-D24 κ=0.62) and response (IDS-SR30: HAM-D24 κ=0.72; QIDS-SR16: HAM-D24 κ=0.67) than in the present study (Rush et al., 2005). The higher kappas observed in the Rush et al. study may stem from comparing the self-report scores to the HAM-D24, rather than the HAM-D17 as in our study. The HAM-D24 captures a broader array of symptoms, including diurnal variation, hopelessness, helplessness and worthlessness, which may increase the overall similarity of symptom content being compared.
In another report, Rush et al. (2006a) analyzed results from 1120 patients in Stage 1 (14 weeks of citalopram treatment) of the STAR*D trial and found a remarkably high level of correlation (0.93) between the HAM-D17 and QIDS-SR16. Using the same definitions for remission and response on the HAM-D17 and QIDS-SR16 as the current study, these authors reported kappas of 0.67 and 0.70, respectively (Rush et al., 2006a). Intriguingly, telephone assessments were used to obtain both the HAM-D17 (live interview) and QIDS-SR16 [interactive voice response system (IVRS)] in STAR*D, whereas our clinical interviews were conducted face-to-face and self-reports were completed on paper forms. Telephone administration of rating scales may produce higher correlations through reduction of distracting information, and/or overcoming barriers in reading comprehension. Another factor that may have increased the correlations in the Rush et al. (2006a) report was that the telephone interviewers conducted both the HAM-D17 and the IDS-SR30 (Rush et al., 2006b). This double-questioning about symptoms, particularly with the IDS-SR30 covering the same questions the patient was completing on the IVRS-administered QIDS-SR16, may have enhanced the agreement between the patient- and clinician-rated measures.
The reasons for discrepancy in levels of agreement between these 2 large data sets and the findings from the current study are unclear. It should be noted that the previous large studies did not separately report level of agreement at the baseline visit where our analysis, and those of others (Domken et al., 1994), found the greatest level of disagreement (see also Bernstein et al., 2009). The current analysis suggests that the use of the combination of clinician-rated scales and patient self-reports to determine eligibility for trial participation at screening and baseline visits may have significant effects on patient recruitment into trials. Specifically, patients who under-rate compared to the clinician may be excluded, whereas patients who willingly endorse high levels of distress may be particularly selected for inclusion. Although traditionally the clinician's rating has carried the most significance for entry into depression trials, there is in fact no “gold standard” to assess depression severity and thereby determine whether the clinician or the patient is more accurately capturing the level of depression. In addition to concerns about eligibility, this unresolved problem has significant implications in assessing the efficacy of treatments, as this report demonstrates.
The HAM-D17 was used as the primary entry criterion, and it is possible that rater inflation of baseline scores may have contributed to the observed differences in percent change on the different scales during treatment. However, the percentage decline in the HAM-D17 and IDS-SR30 scores was identical at the first post-baseline assessment (week 1). If baseline rater inflation was present, one would expect a greater percentage reduction in HAM-D17 score at that visit (Landin et al., 2000). This finding argues that rater inflation was minimal and did not contribute to the study's findings.
So-called “halo-effects” in assessing depression severity may threaten the validity of patient-reported ratings of depression, particularly in the early visits of a trial. Clinician raters are trained to evaluate each item of a depression rating scale independently from the other items. In addition, clinicians make careful efforts to distinguish between symptoms that may blend together in a patient's mind, such as anhedonia and anergia. In contrast, patients in the early stages of a clinical trial do not naturally make such distinctions. Patients with high distress expression may produce a nonspecific elevation of scores across items. Alternatively, chronically and/or severely depressed patients may have such marked impairments in motivation, concentration, and memory of their premorbid state that they fail to attend to the items accurately or attribute aspects of their chronic depressive symptoms to their “normal self.” As patients' symptoms diminish in their progress through a trial, and as they become more adept at identifying the separate symptom components that comprise a depressive episode, their concordance with the clinician rater should increase, as it did in this study. The finding of improved correlation over time is consistent across all studies examining this topic.
The poor correlation at baseline and early visits of the study may also stem in part from the well-established negative cognitive distortions present in acutely depressed subjects (Marton and Kutcher, 1995). As patients improve, their ability to more accurately (less negatively) perceive their daily experiences also improves, which likely contributes to increased agreement with the clinician rater.
Our study did not include a placebo arm in the acute and maintenance phases, so we are unable to assess whether the degree of scale correlations differs between patients receiving medication versus those on placebo. Such analyses may wish to be performed by others with existing data sets of large placebo controlled trials.
A final likely contributor to the improvement of correlation over time through a study is a statistical effect. At baseline, because all subjects are acutely ill, there is a relatively small range of depression severity scores, particularly for clinician-administered scales. As the study progresses, some patients improve whereas others do not, which introduces a greater range of scores. These greater standard deviations in the scales and their associated increases in the scales' coefficient alpha may be a significant driver for greater statistical correlation over time.
The results of the two methods used to correct for attenuation were difficult to interpret for the baseline correlations. Cronbach's alpha corrected correlations were greater than 1 at baseline, due to the restricted range of values used in the calculations. Thorndike's case 2 method indicated higher correlations after correction, but we cannot assess the accuracy of this correction, as it relied on the use of week 10 variances on the scales, which may have been greater or less than the true population variance at baseline. Thus, the effect of attenuation continues to challenge interpretation of efforts at correlating scales. Future analyses of this type should plan to incorporate all screening visit scores from clinician- and self-rated scales, so a wider range of values can be assessed.
When comparing patient self-ratings using the IDS-SR30 with the QIDS-SR16, the current study reports that the correlation between the longer 30-item inventory and the more quickly administered 16-item instrument for both responders and remitters (κ=0.79 for responders at 10 weeks versus 0.71 for remitters) were close to the correlations of these scales reported by Rush et al. (2003) (κ=0.85 for response and 0.81 for remission). The reason for this discrepancy between these 2 studies may stem from the differing patient populations enrolled: our sample consisted exclusively of patients with recurrent depression, whereas the Rush et al. (2003) sample consisted exclusively of chronically depressed patients.
One crucial variable to be considered in all analyses comparing clinician and patient depression ratings is the timing of the administration of the scales. Although no controlled studies have evaluated this question, it is likely that performing the symptom assessments through a clinician-administered HAMD rating shortly before the patient completes his or her self-report will highly influence how they respond to the items on self-rating scales.
Finally, it is important to recognize that the overall correlation of scores by visit does not capture the level of individual variability between patients. Our results of the agreement on definitions of response and remission at the end of the 10-week trial indicate that there is poor agreement between the clinician and the patient regarding whether or not the patient is actually “better.” Preliminary inspection of our data suggests that a significant proportion of patients consistently rate their depression as more severe than the clinician, whereas other patients rate themselves as less depressed than the clinician. For the patient, the frame of reference for the severity of their symptoms is almost solely their own experience, whereas for the clinician, the patient's symptoms are considered within the context of all depressed patients the clinician has evaluated. Future analyses should attempt to identify patient-related factors that contribute to the over- or under-rating of depression by the patients' vis-à-vis the clinician (Dunlop et al., in press). Such information may be helpful in the design of future clinical trials through identifying potential study participants who may not be good candidates for assessing the efficacy of depression treatments.
The current study suggests that the patient-rated scales should not be used in place of clinician ratings for evaluating acute- or continuation-phase treatment effects. Ideally, for patient-rated scales to replace clinician-rated scales in determining categorical treatment outcomes, the kappa correlation coefficient should reliably be in the very good range (>0.8). The presence of uncertainty about who has actually benefited from a depression treatment presents great difficulties for many aspects of clinical trial design and analysis. Perhaps the best practice for the reporting of future depression trials is to report outcomes both by self-report and clinician-rating and also to report the level of overall agreement on the primary outcome.
Acknowledgments
The authors would like to thank Sally Laden, MS, MSE Communications LLC, for professional medical writing and editorial assistance. Research supported by Wyeth Research. Dr. Dunlop is supported by a K12 grant from NIH National Center for Research Resources, K12 RR 017643 and 1KL2RR025009.
Footnotes
Previous presentation: Data in this manuscript were presented as a poster at the American Psychiatric Association Annual Congress, May 3–8, 2008, Washington, DC and the New Clinical Drug Evaluation Unit Annual Congress, May 27–30, 2008, Phoenix, Arizona.
References
- American Psychiatric Association . Diagnostic and Statistical Manual of Mental Disorders. 4th edn American Psychiatric Press; Washington, DC: 1994. [Google Scholar]
- Beck AT, Ward CH, Mendelson M, Mock J, Erbaugh J. An inventory for measuring depression. Archives of General Psychiatry. 1961;4:561–571. doi: 10.1001/archpsyc.1961.01710120031004. [DOI] [PubMed] [Google Scholar]
- Bernstein IH, Rush AJ, Suppes T, Trivedi MH, Woo A, Kyutoku Y, Crismon ML, Dennehy E, Carmody TJ. A psychometric evaluation of the clinician-rated Quick Inventory of Depressive Symptomatology (QIDS-C16) in patients with bipolar disorder. International Journal of Methods in Psychiatric Research. 2009;18:138–146. doi: 10.1002/mpr.285. [DOI] [PMC free article] [PubMed] [Google Scholar]
- Corruble E, Legrand JM, Zvenigorowski H, Duret C, Guelfi JD. Concordance between self-report and clinician's assessment of depression. Journal of Psychiatric Research. 1999;33:457–465. doi: 10.1016/s0022-3956(99)00011-4. [DOI] [PubMed] [Google Scholar]
- Domken M, Scott J, Kelly P. What factors predict discrepancies between self and observer ratings of depression? Journal of Affective Disorders. 1994;31:253–259. doi: 10.1016/0165-0327(94)90101-5. [DOI] [PubMed] [Google Scholar]
- Dorz S, Borgherini G, Conforti D, Scarso C, Magni G. Comparison of self-rated and clinician-rated measures of depressive symptoms: a naturalistic study. Psychology and Psychotherapy: Theory, Research and Practice. 2004;77:353–361. doi: 10.1348/1476083041839349. [DOI] [PubMed] [Google Scholar]
- Dunlop BW, Li T, Kornstein SG, Friedman ES, Rothschild AJ, Pedersen R, Ninan PT, Keller M, Trivedi MH. Concordance between clinician and patient ratings as predictors of response, remission and recurrence in major depressive disorder. Journal of Psychiatric Research. doi: 10.1016/j.jpsychires.2010.04.032. in press. [DOI] [PMC free article] [PubMed] [Google Scholar]
- Faravelli C, Albanesi G, Poli E. Assessment of depression: a comparison of rating scales. Journal of Affective Disorders. 1986;11:245–253. doi: 10.1016/0165-0327(86)90076-5. [DOI] [PubMed] [Google Scholar]
- Greenberg RP, Bornstein RF, Greenberg MD, Fisher S. A meta-analysis of antidepressant outcome under “blinder” conditions. Journal of Consulting and Clinical Psychology. 1992;60:664–669. doi: 10.1037//0022-006x.60.5.664. [DOI] [PubMed] [Google Scholar]
- Guy W. ECDEU Assessment Manual for Psychopharmacology. US Department of Health, Education, and Welfare; Rockville, MD: 1976. Clinical Global Impressions. Publication ADM 76-338; pp. 217–222–217–222. [Google Scholar]
- Hamilton M. A rating scale for depression. Journal of Neurology Neurosurgery and Psychiatry. 1960;23:56–62. doi: 10.1136/jnnp.23.1.56. [DOI] [PMC free article] [PubMed] [Google Scholar]
- Keller M, Trivedi MH, Thase ME, Shelton RC, Kornstein SG, Nemeroff CB, Friedman ES, Gelenberg AJ, Kocsis JH, Dunner DL, Hirschfeld RMA, Rothschild AJ, Ferguson JM, Schatzberg AF, Zajecka JM, Pedersen RD, Yan B, Ahmed S, Musgnung J, Ninan PT. The Prevention of Recurrent Episodes of Depression with Venlafaxine for Two Years (PREVENT) study: outcomes from the two-year and combined maintenance phases. Journal of Clinical Psychiatry. 2007a;68:1246–1256. doi: 10.4088/jcp.v68n0812. [DOI] [PubMed] [Google Scholar]
- Keller MB, Trivedi MH, Thase ME, Shelton RC, Kornstein SG, Nemeroff CB, Friedman ES, Gelenberg AJ, Kocsis JH, Dunner DL, Dunlop BW, Hirschfeld RM, Rothschild AJ, Ferguson JM, Schatzberg AF, Zajecka JM, Pedersen R, Yan B, Ahmed S, Schmidt M, Ninan PT. The Prevention of Recurrent Episodes of Depression with Venlafaxine for Two Years (PREVENT) study: outcomes from the acute and continuation phases. Biological Psychiatry. 2007b;62:1371–1379. doi: 10.1016/j.biopsych.2007.04.040. [DOI] [PubMed] [Google Scholar]
- Lambert MJ, Hatch DR, Kingston MD, Edwards BC. Zung, Beck, and Hamilton Rating Scales as measures of treatment outcome: a meta-analytic comparison. Journal of Consulting and Clinical Psychology. 1986;54:54–59. doi: 10.1037//0022-006x.54.1.54. [DOI] [PubMed] [Google Scholar]
- Landin R, DeBrota DJ, DeVries TA, Potter WZ, Demitrack MA. The impact of restrictive entry criterion during the placebo lead-in period. Biometrics. 2000;56:271–278. doi: 10.1111/j.0006-341x.2000.00271.x. [DOI] [PubMed] [Google Scholar]
- Landis JR, Koch GG. The measurement of observer agreement for categorical data. Biometrics. 1977;33:159–174. [PubMed] [Google Scholar]
- Marton P, Kutcher S. The prevalence of cognitive distortion in depressed adolescents. Journal of Psychiatry and Neuroscience. 1995;20:33–38. [PMC free article] [PubMed] [Google Scholar]
- Montgomery SA, Åsberg M. A new depression scale designed to be sensitive to change. British Journal of Psychiatry. 1979;134:382–389. doi: 10.1192/bjp.134.4.382. [DOI] [PubMed] [Google Scholar]
- Mundt JC, Katzelnick DJ, Kennedy SH, Eisfeld BS, Bouffard BB, Greist JH. Validation of an IVRS version of the MADRS. Journal of Psychiatric Research. 2006;40:243–246. doi: 10.1016/j.jpsychires.2005.05.002. [DOI] [PubMed] [Google Scholar]
- Nunnally J, Bernstein IH. Psychometric Theory. 3rd ed McGraw-Hill; New York: 1994. [Google Scholar]
- Rush AJ, Gullion CM, Basco MR, Jarrett RB, Trivedi MH. The Inventory of Depressive Symptomatology (IDS): psychometric properties. Psychological Medicine. 1996;26:477–486. doi: 10.1017/s0033291700035558. [DOI] [PubMed] [Google Scholar]
- Rush AJ, Trivedi MH, Ibrahim HM, Carmody TJ, Arnow B, Klein DN, Markowitz JC, Ninan PT, Kornstein S, Manber R, Thase ME, Kocsis JH, Keller MB. The 16-Item Quick Inventory of Depressive Symptomatology (QIDS), clinician rating (QIDS-C), and self-report (QIDS-SR): a psychometric evaluation in patients with chronic major depression. Biological Psychiatry. 2003;54:573–583. doi: 10.1016/s0006-3223(02)01866-8. [DOI] [PubMed] [Google Scholar]
- Rush AJ, Trivedi MH, Carmody TJ, Ibrahim HM, Markowitz JC, Keitner GI, Kornstein SG, Arnow B, Klein DN, Manber R, Dunner DL, Gelenberg AJ, Kocsis JH, Nemeroff CB, Fawcett J, Thase ME, Russell JM, Jody DN, Borian FE, Keller MB. Self-reported depressive symptom measures: sensitivity to detecting change in a randomized, controlled trial of chronically depressed, nonpsychotic outpatients. Neuropsychopharmacology. 2005;30:405–416. doi: 10.1038/sj.npp.1300614. [DOI] [PubMed] [Google Scholar]
- Rush AJ, Bernstein IH, Trivedi MH, Carmody TJ, Wisniewski S, Mundt JC, Shores-Wilson K, Biggs MM, Woo A, Nierenberg AA, Fava M. An evaluation of the quick inventory of depressive symptomatology and the hamilton rating scale for depression: a sequenced treatment alternatives to relieve depression trial report. Biological Psychiatry. 2006a;59:493–501. doi: 10.1016/j.biopsych.2005.08.022. [DOI] [PMC free article] [PubMed] [Google Scholar]
- Rush AJ, Trivedi MH, Wisniewski SR, Nierenberg AA, Stewart JW, Warden D, Niederehe G, Thase ME, Lavori PW, Lebowitz BD, McGrath PJ, Rosenbaum JF, Sackheim HA, Kupfer DJ, Luther J, Fava M. Acute and longer-term outcomes in depressed outpatients requiring one or several treatment steps: A STAR*D report. American Journal of Psychiatry. 2006b;163:1905–1917. doi: 10.1176/ajp.2006.163.11.1905. [DOI] [PubMed] [Google Scholar]
- Senra C, Polaino A. Concordance between clinical and self-report depression scales during the acute phase and after treatment. Journal of Affective Disorders. 1993;27:13–19. doi: 10.1016/0165-0327(93)90091-w. [DOI] [PubMed] [Google Scholar]
- Thorndike RL. Personnel Selection: Test and Measurement Techniques. Wiley; New York: 1949. [Google Scholar]
- Trivedi MH, Rush AJ, Wisniewski SR, Nierenberg AA, Warden D, Ritz L, Norquist G, Howland RH, Lebowitz B, McGrath PJ, Shores-Wilson K, Biggs MM, Balasubramani GK, Fava M. Evaluation of outcomes with citalopram for depression using measurement-based care in STAR*D: implications for clinical practice. American Journal of Psychiatry. 2006;163:28–40. doi: 10.1176/appi.ajp.163.1.28. [DOI] [PubMed] [Google Scholar]
- Wiberg M, Sundstrom A. A comparison of two approaches to correction of restriction of range in correlation analyses. Practical Assessment, Evaluation and Research. 2009;14(5):1–9. [Google Scholar]