

Abstract
Purpose.
Best disease is a macular dystrophy caused by mutations in the BEST1 gene. Affected individuals exhibit a reduced electro-oculographic (EOG) response to changes in light exposure and have significantly longer outer segments (OS) than age-matched controls. The purpose of this study was to investigate the anatomical changes in the outer retina during dark and light adaptation in unaffected and Best disease subjects, and to compare these changes to the EOG.
Methods.
Unaffected (n = 11) and Best disease patients (n = 7) were imaged at approximately 4-minute intervals during an approximately 40-minute dark–light cycle using spectral domain optical coherence tomography (SD-OCT). EOGs of two subjects were obtained under the same conditions. Automated three-dimensional (3-D) segmentation allowed measurement of light-related changes in the distances between five retinal surfaces.
Results.
In normal subjects, there was a significant decrease in outer segment equivalent length (OSEL) of −2.14 μm (95% confidence interval [CI], −1.77 to −2.51 μm) 10 to 20 minutes after the start of light adaptation, while Best disease subjects exhibited a significant increase in OSEL of 2.07 μm (95% CI, 1.79–2.36 μm). The time course of the change in OS length corresponded to that of the EOG waveform.
Conclusions.
Our results strongly suggest that the light peak phase of the EOG is temporally related to a decreased OSEL in normal subjects, and the lack of a light peak phase in Best disease subjects is associated with an increase in OSEL. One potential role of Bestrophin-1 is to trigger an increase in the standing potential that approximates the OS to the apical surface of the RPE to facilitate phagocytosis.
Keywords: eletro-oculogram, Best disease, OCT, photoreceptor cells
SD-OCT reveals shortening of the photoreceptor OS layer in control subjects during light adaptation, with a similar timecourse as the EOG response; in contrast, Best disease subjects show lengthening of OS. We propose that one role of the BEST1-mediated standing potential is to promote engagement between the OS and RPE to facilitate phagocytosis.
Introduction
Best vitelliform macular dystrophy (Best disease; OMIM No. 607854; provided in the public domain at www.omim.org) is an autosomal dominant condition1 caused by mutations in the BEST1 gene.2,3 Early in the course of their disease, most affected individuals exhibit a vitelliform lesion in the macula of variable size and have surprisingly good visual acuity. Over time, some of these lesions can evolve to geographic atrophy or disciform scarring with or without overt clinical evidence of choroidal neovascularization.4,5
Bestrophin-1, the protein encoded by BEST1, is primarily localized to the basolateral plasma membrane of the RPE6 and appears to play a role in both basolateral chloride conductance7–10 and intracellular calcium regulation.11 Animal models of Best disease have been sought. Neither overexpression of mutant alleles in rats,12 nor targeted deletion of the BEST1 gene in mice,13 produces the complete Best disease phenotype. However, mice carrying a W93C mutation do mimic some aspects of Best disease, including abnormal direct current electroretinograms (dc-ERGs), lipofuscin accumulation in the RPE, and debris in the subretinal space.14 In addition, canine models of recessive Best disease have been described, and these canine multifocal retinopathy (cmr) strains, similarly to human recessive Best disease, show multiple lesions with subretinal material and lipofuscin accumulation.15,16
The phenotypes and modes of inheritance of Bestrophin-1–associated disease are varied.17 Whereas the majority of Best disease cases show autosomal dominant inheritance, with hundreds of reported point mutations, recessive inheritance has also been described.18–20 Patients with recessive inheritance may have classic features of Best disease, including a central vitelliform lesion, or may have extramacular punctate flecks in the absence of a notable central lesion.19,20 In addition to Best disease and recessive “bestrophinopathy,” BEST1 mutations have been described in diseases with extramacular involvement as varied as autosomal dominant vitreoretinochoroidopathy (ADVIRC)21 and rare cases of retinitis pigmentosa.22
The pathognomic feature of Best disease is a reduction of the light-peak–dark-trough ratio of the clinical electro-oculogram (EOG).23,24 Although the most salient feature in typical Best disease is the presence of the vitelliform lesion, which is almost always centered on the fovea centralis, it is notable that the EOG findings in Best disease—decreased responsiveness of the EOG to changes in light exposure—are a feature of the RPE across the entire fundus. The variation in the EOG in response to light is mediated by changing chloride conductance across the basolateral plasma membrane of the RPE,23 and the attenuated response in Best disease patients is present even in the absence of visible fundus changes.25 The normal physiological purpose of this light-mediated alteration of RPE chloride conductance is currently unknown. There is evidence that the subretinal space expands following light onset in animals, but only if the RPE is left intact; isolated retina does not show this change.26,27 In addition, we recently used three-dimensional (3-D) analysis of spectral domain optical coherence tomography (SD-OCT) to show that in patients with Best disease, the distance between the junction between the inner and outer segments and the inner surface of the RPE across the macula, even outside the vitelliform lesion, is 6.5 μm larger than in normal subjects.28 Given this, a possible physiological role of the light-dependent slow oscillation of chloride conductance is to facilitate phagocytosis of photoreceptor outer segments by the RPE. Since the repeat variability of 3-D analysis of OCT-based measurement of retinal layer thickness is now below 1.5 μm,29 we further hypothesized that anatomical changes in the retina associated with the oscillation of the EOG would be visible using 3-D analysis of SD-OCT.
The purpose of this study was to investigate the mechanical changes (inferred from optical path length measurements) in the outer retina during dark and light adaptation and to compare the amplitude of these changes to the EOG under the same stimulus conditions, using 3-D layer analysis of SD-OCT, in both normal subjects and patients with Best disease.
Methods
Human Subjects
Normal subjects and patients with Best disease were included in this prospective study after written informed consent. The study adhered to the tenets of the Declaration of Helsinki and was approved by Institutional Review Board of the University of Iowa. Normal control subjects were recruited on the basis of a normal retinal examination by a retinal specialist and the lack of any history of retinal disease, diabetes, or glaucoma. Patients with Best disease were included if they had a molecularly confirmed mutation in the coding sequence of the BEST1 gene and a vitelliform lesion in the macula less than one-half disc diameter in size. See the Table.
Table.
Genotypes of Best Disease–Affected Subjects
|
Identifier |
Mutation |
| B1 | Tyr227Asn |
| B2 | Tyr227Asn |
| B3 | Lys30Arg |
| B4 | Tyr227Asn |
| B5 | Lys30Arg |
| B6 | Arg218His |
| B7 | Arg218His |
| B8 | Thr6Arg |
Human Donor Eyes and Histopathology
Histological sections from a donor with molecularly confirmed Best disease (subject B8), described previously,30 and a series of age-matched, unaffected eyes were evaluated histopathologically. Briefly, wedges of the posterior pole were infiltrated in sucrose solution and embedded in optimal cutting temperature solution.30 Hematoxylin−eosin-stained sections were collected outside of the central lesion. Length of photoreceptor cell outer segments was assessed qualitatively.
OCT Imaging
Eleven normal subjects and seven individuals affected with Best disease underwent OCT imaging during a dark and light adaptation protocol that took place in the morning between 6:00 and 8:30 AM during the winter of 2011–2012. In the winter in Iowa City, dawn is not completed until 8:30 AM. There were no restrictions on light exposure before arrival in the photography suite. All OCT scanning was performed using a Spectralis (Heidelberg, Heidelberg, Germany) 3-D volume scan protocol (typically 512 (x) × 49 (y) × 496 (z) voxels covering approximately 6.3 × 6.3 mm) in a windowless OCT scanning room. Stray light from electronic equipment was minimized by covering sources with black tape or dark red filters, except where the operator needed to see the display during scanning. After each subject arrived in the lane, the sole door was closed, and all room lights were turned off.
OCT imaging was started and was repeated at approximately 6-minute intervals for at least 30 minutes, but no more than 45 minutes.
After the last dark adaptation OCT had been acquired and saved, at “start of light adaptation” (L0), room lights and an 11- by 18.5-inch photographic light box (Gagne, Johnson City, NY) with two 15-watt fluorescent tubes were turned on. Subjects were asked to keep their eyes open and fixate on the center of the light box at a distance of 0.5 m initially for 2 minutes and then whenever an OCT scan was not being performed. OCT scans were exported to disk. This was again repeated at approximately 6-minute intervals for at least 30 minutes, but no more than 45 minutes.
OCT Analysis
Using our validated fully automated 3-D OCT segmentation algorithm, 11 intraretinal surfaces from the internal limiting membrane (layer 1) to Bruch's membrane (layer 11) were automatically determined in all macular OCT scans.29,31,32 Briefly, we use a graph-search−based formulation of simultaneous, globally optimal segmentation of multiple 3-D surfaces (minimum-cost set), in a vertex-weighted graph, to segment multiple surfaces simultaneously. Both regional and edge-based costs, as well as varying feasibility constraints, are incorporated in the graph using a supervised approach for determining the feasibility constraints.32
The following distances (thicknesses) between 7 of the 11 surfaces were calculated33 over the entire macula scan region, excluding the fovea and excluding any vitelliform lesions in Best patients, for each A-scan (see Fig. 1): surface 1 to 6, inner retina (internal limiting membrane to outer plexiform layer); surface 6 to 7, outer nuclear layer and myoid of inner segments; surface 7 to 8, ellipsoid of photoreceptor inner segments; surface 8 to 10, outer segment equivalent length (OSEL) (inner segment/outer segment junction to retinal pigment epithelium inner surface); surface 10 to 11, retinal pigment epithelium.
Figure 1. .

Elongation of photoreceptor cell outer segments in Best disease, depicted by OCT (A, B) and histology (C, D). (A, C) Unaffected subjects; (B, D) subjects with Best disease. (A) SD-OCT central B-scan from single normal subject. The distance between the red arrows is defined as the OSEL, and the distance between the blue arrows corresponds to the RPE. Although only two dimensions are depicted, the analysis of OSEL and other retinal structures is performed in three dimensions; thus small discrepancies between true surface and segmentation exist in individual B-scans. Note the areas of extremely long and/or unphagocytosed photoreceptor outer segments in (D), outside of the area of central scarring and over an intact RPE layer. GCL, ganglion cell layer; INL, inner nuclear layer; ONL, outer nuclear layer; IS, inner segments; OS, outer segments; RPE, retinal pigment epithelium.
Thickness maps were generated by displaying the calculated thickness at each point in the sampled area as a heat map in which blue is thinner and red is thicker. Mean thicknesses in micrometers for each of the above layers were also calculated by averaging the thickness in each A-scan for each eye and for each subject.
The mean difference across all subjects over time was calculated by averaging all mean thicknesses of each subject and expressing these data as a function of time in minutes before or after L0 (Light ON).
Dark adaptation baseline thickness maps were generated by averaging the thicknesses for each A-scan acquired during dark adaptation. Light adaptation thickness maps were generated by averaging the thicknesses for each A-scan acquired during light adaptation.
Dark adaptation baseline average thickness in micrometers was obtained by averaging the thickness of all A-scans in the dark adaptation baseline map, and the same for light adaptation.
Difference maps and signals were generated by subtracting the baseline map from the light adaptation average map.
Difference changes were separately generated for a single randomly selected eye of each subject to verify that the results were independent of any potential interaction between eyes.
Electro-oculography
Electro-oculography was performed on one normal subject (subject 4) and one individual affected with Best disease (subject B2) according to the standards of the 2010 International Society for Clinical Electrophysiology of Vision (ISCEV) update34 with commercial equipment and software (E2 system; Diagnosys, Lowell, MA). The first 30 minutes of testing were conducted in dark, while the stimulus bowl was also dark, after which a 100 cd/m2 white background was displayed in the stimulus bowl and a second 30 minutes of testing was performed in identical fashion. Finally a third interval of recording was obtained again in darkness. The EOG amplitude was recorded and averaged for both eyes and then smoothed by averaging three time points. Eye position was monitored via infrared camera mounted in the stimulus bowl, and any dysconjugate eye position or evident failure to visually acquire the targets was noted.
Results
Previous studies of patients with molecularly confirmed Best disease identified a striking elongation of outer segments well anterior to the ophthalmoscopically visible macular lesions.28 To investigate the histopathologic correlation of these tomographic observations, we reevaluated a previously published human donor eye affected with Best disease (subject B8) and compared it to age-matched control eyes. As described previously, this Best disease sample had a foveal disciform scar30 but showed intact retina outside of the central area of scarring. Consistent with tomographic measurements in Best disease patients (Figs. 1A, 1B),28 histological evaluation of the Best disease donor eye showed the outer segments to be remarkably longer than those in control eyes (Figs. 1C, 1D).
Given this histological correlation and in view of the recent improvements in OCT segmentation algorithms (Lee K, et al. IOVS 2010;51:ARVO E-Abstract 1767; and Ref. 32), we decided to investigate whether we could detect anatomical variations in the retina in response to changes in light adaptation, and if so, whether those changes would be related to variations in the EOG. Eleven unaffected individuals, average age 40 years, and seven subjects with Best disease (three with a heterozygous Tyr227Asn mutation in BEST1, two with a heterozygous Lys30Arg mutation, and two with a heterozygous Arg218His mutation; Table), with an average age of 51 years, underwent SD-OCT imaging during dark adaptation and light adaptation as described in Methods. In addition, one unaffected subject and one affected subject underwent ISCEV standard EOG. One normal subject underwent OCT imaging with the dark−light protocol five times, each on a different day, over several months, to determine the repeatability of the phenomenon.
Three-dimensional segmentation was performed and thickness of retinal layers was quantified. In unaffected individuals, the average OSEL showed a reproducible and statistically significant thinning following exposure of subjects to the light box. Specifically, 10 to 20 minutes before light onset (L0), the average OSEL was 26.90 μm (95% confidence interval [CI], 26.85–26.94 μm) while 10 to 20 minutes after L0, the average OSEL was 25.42 μm (95% CI, 25.42–25.47 μm); these intervals were chosen because the largest change is in the interval between 10 and 20 minutes after L0, and the interval before L0 is symmetric with that. The overall OSEL change from baseline in normal subjects was −2.14 μm (95% CI, −1.77 to −2.51 μm), a statistically significant decrease.
In contrast to observations in unaffected subjects, who showed OSEL thinning after L0, outer segments in subjects affected with Best disease showed a remarkable thickening in light. The average OSEL was 29.41 μm (95% CI, 26.61–32.21 μm) after 10 to 20 minutes in darkness and was 31.22 μm (95% CI, 28.35–34.10 μm) after 10 to 20 minutes following L0. The average change in OSEL from dark to light in Best-affected subjects was 2.07 μm (95% CI, 1.79–2.36 μm), a statistically significant increase.
In order to compare the spatial characteristics of the retinal responses to light adaptation between Best disease and control subjects, OSEL maps were generated for all normal and Best disease–affected subjects. An example of an unaffected subject is shown in Figure 2A, an example of a subject with Best disease (subject B5) in Figure 2B. In these figures, the OSEL across the entire macula during dark and light adaptation is shown as a heat map. Blue corresponds to an OSEL of approximately 20 μm, red to approximately 40 μm (see legend). OSEL thinning in the unaffected subject occurs across the entire macula including the fovea on light exposure. In contrast, OSEL thickening is seen across the entire macula in subjects with Best disease but is more pronounced centrally (Fig. 2B). The correlation between the light-related OSEL variations and clinical retinal landmarks is shown in Figure 3 as a superimposition of a heat map of the average thickness changes in a normal eye (subject 3) and the fundus photograph of the same eye.
Figure 2. .
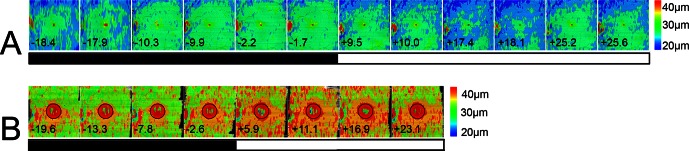
OSEL maps of the macula of unaffected and Best disease patient eyes; analyzed SD-OCT scans are 6.3 × 6.3 mm. (A) Left eye OSEL maps of the macula of a single unaffected subject (subject 3) during the dark–light adaptation protocol. The numbers at the bottom of each map indicate time to start of light adaptation in minutes. Because of varying scanner data storage times, scans could not be taken at regular intervals. The black and white bar indicates dark and light adaptation portions of the experiment. The color bar at right shows the thicknesses in micrometers that correspond to the colors used in the map. The OSEL increases during dark adaptation and then begins decreasing as soon as light adaptation starts, with a minimum OSEL occurring between 17 and 25.2 minutes after light onset in this subject. The thick area at the left edge of the image is part of the optic nerve head and does not contribute to the light–dark thickness variability. (B) Left eye OSEL maps of a subject with Best disease (subject B5) during dark−light adaptation protocol. In Best patients, OSEL is greater than normal even during dark adaptation, and the OSEL increases further as soon as light adaptation starts. The maximum OSEL occurred between 16.9 and 23.1 minutes after light onset in this subject. For each individual affected with Best disease, the area of the vitelliform lesion was excluded from quantitative analysis. The exclusion zone in this patient is indicated by a black circle.
Figure 3. .
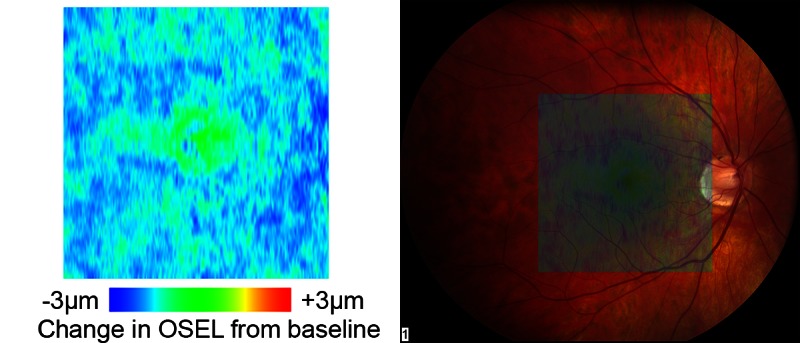
Left: change map of OSEL in micrometers for a normal subject (subject 2) showing decrease of the OSEL over the entire macula during light adaptation. Right: superposition of the OSEL change map over a color fundus image of the same eye showing the retinal location of the changes.
The time course of OSEL change relative to baseline was determined in normal subjects and Best disease–affected subjects (Fig. 4). In normal subjects, a brief increase in OSEL was observed 0 to 5 minutes after light onset and was followed by a larger decrease.
Figure 4. .
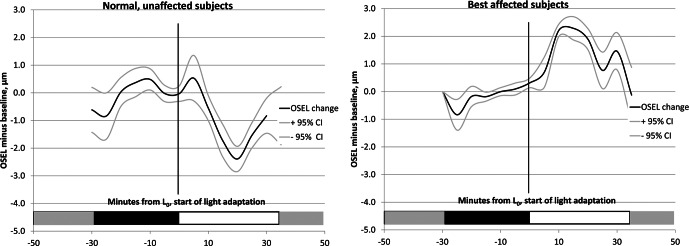
Average OSEL change from baseline and 95% confidence intervals for all subjects during dark and light adaptation. Left: normal subjects (n = 11). Right: subjects affected with Best disease (n = 6). In normal subjects, OSEL initially increases for the first few minutes after light onset and then rapidly decreases, with the minimum OSEL occurring approximately 20 minutes after the start of light adaptation. In subjects affected with Best disease, the OSEL increases after start of light adaptation, and the maximum OSEL occurs between 10 and 15 minutes after light onset.
The thinnest OSEL occurred approximately 17.5 minutes after light onset. In contrast, subjects affected with Best disease showed a sustained increase in OSEL, with the maximum occurring approximately 10 minutes after the onset of light exposure.
Figure 5 shows that the light-related thinning of the retina observed in normal subjects is almost totally traceable to changes in the OSEL on OCT. When we analyzed the ratio of thickness in darkness to thickness in light for the five retinal layers, the OSEL showed a decrease in thickness more than three times greater (almost 10%) than the next most variable layer. It should be noted that the average OSEL in normal eyes is several times greater than the average thickness of the RPE such that the percentage-based comparison in Figure 5 is a conservative depiction of the difference in behavior of these layers.
Figure 5. .

Graph depicting site of photoreceptor cell shortening. The relative change in thickness of different retinal layers in normal subject 4 in the 10-minute interval from 12.5 to 22.5 minutes after the start of light adaptation, the period when OSEL is maximally decreased. Ratios are calculated with reference to average thickness of the corresponding layers during dark adaptation. Outer segments show a reduction of approximately 10% during light adaptation, while other layers are essentially unchanged. OPL, outer plexiform layer; IS, inner segments; RPE, retinal pigment epithelium.
We next sought to determine the temporal relationship between variations in the EOG and outer segment equivalent shortening. Figure 6 shows the superimposed time courses of the changes in OSEL and EOG amplitudes during the transition from ambient clinic light to dark and then to moderately bright light in a normal subject (subject 4) and a patient affected with Best disease (subject B2). In the normal subject, a rapid, small increase in OSEL occurs shortly after light onset that corresponds to the ascending limb of the EOG light peak. This is followed by a larger decrease in OSEL that is synchronized with the fall in EOG potential following the light phase. In the Best disease subject, there is no change in the retina or the EOG associated with the transition from ambient light to darkness, while light adaptation is associated with a sustained thickening of the retina and a very small increase in the EOG. The light-related OSEL thinning seen in the normal subject is completely absent in the subject with Best disease. The rather coarse temporal resolution of the OCT scans (4 minutes between time points and limited by the data storage speed of the OCT system) made it impossible to determine with certainty whether the changes in EOG amplitude preceded or followed the changes in OSEL.
Figure 6. .
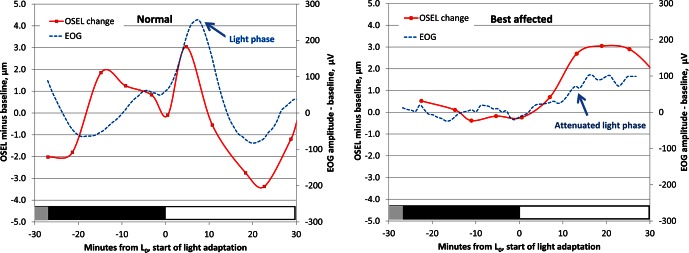
Relationship between EOG and the change in photoreceptor OSEL in a single experiment in a normal subject (subject 4, left) and a Best disease–affected subject (subject B2, right). In normals, during light adaption there is brief apparent lengthening of the outer segments, then a larger and more prolonged shortening that is temporally correlated to the fall in EOG voltage that follows the light phase. In Best disease subjects, during light adaptation the EOG is almost flat, and only the lengthening of the OSEL is seen. Vertical axes, left: difference in OSEL in micrometers from average thickness during dark adaptation; right: smoothed EOG amplitude change from baseline (μV). Horizontal axes: time from start of light adaptation (L0) in minutes.
Analysis of the data using a single randomly selected eye from each patient instead of both eyes of all patients gave almost identical results. Analysis of all visits of normal subject 4 showed the same time course and amplitude of OSEL changes in both eyes for all visits (data not shown).
Discussion
One of the most important functions of the retinal pigment epithelium of the vertebrate retina is the phagocytosis of photoreceptor outer segments.35 In most species, there is a circadian component to outer segment disc shedding, with the greatest phagocytic activity occurring at the transition from night to day.36 Rabbits raised in complete darkness lose the circadian component of outer segment shedding and as a result exhibit longer but functionally normal outer segments.37 In contrast, mutations in the gene MERTK completely abrogate all phagocytosis and cause severe photoreceptor degeneration.38 Three-dimensional analysis of SD-OCT of patients with Best disease reveals these individuals to have long outer segments,28 similar to those of the dark-reared rabbit. We hypothesized that bestrophin-1 might be required for the circadian component of outer segment phagocytosis and that the loss of this component might be responsible for the elongated outer segments in patients with Best disease. Given that recent advances in 3-D SD-OCT have allowed reliable measurements to be made in the single micron range (Long M, et al. IOVS 2012;53:ARVO E-Abstract 690; and Ref. 29), we wondered whether we could detect anatomic differences in the living human retina during the transition from a period of dark adaptation to light. If so, we might be able to use SD-OCT to test our hypothesis of the role of bestrophin in the circadian component of phagocytosis.
When we performed SD-OCT at approximately 4-minute intervals in normal human subjects, we observed a small (approximately 2 μm) but very reproducible lengthening of photoreceptor OSEL in the dark, which was reversed by moderately bright light. There was very little change in the thickness of other retinal layers. Although the shortening of the OSEL during light adaptation is smaller than the reported axial resolution of the Spectralis OCT device (4 μm),29 we were able to measure changes in OSEL less than 1 μm because of the statistical power inherent in the tens of thousands of A-scans obtained at a single SD-OCT time point.
The light-dependent changes we observed in the OSEL are likely to represent a real physiological phenomenon for several reasons. First, our previous studies have shown that the changes in thickness calculated with our algorithm are reproducible to within <1.5 μm (Long M, et al. IOVS 2012;53:ARVO E-Abstract 690; and Ref. 29). Second, the changes in OSEL were reproducible both within and across subjects. All normal subjects exhibited the same pattern of thickening in the dark and thinning in the light; and, in the one subject who was imaged repeatedly over the course of several months, these measurements were reproducible over time. Third, histological analysis of an eye from a Best disease donor revealed an increased OSEL in the macular area outside the vitelliform lesion, which agrees with our previous 3-D SD-OCT analyses of multiple subjects affected by Best disease28 (Fig. 1).
The precise mechanisms and anatomical correlates of the light-dependent tomographic changes we observed in the outer segments, termed outer segment equivalent length in this paper, are not known. In fact, tomographic measurements can be influenced by changes in refractive index and shifts of small anatomical structures such as melanosomes and microvilli that are beyond the resolution of our clinical instruments. In these macular scans, rods outnumber cones approximately 6:1, but because the Spectralis cannot resolve individual photoreceptors, we cannot differentiate between OSEL changes in rods and cones. Thus, we cannot be completely certain that the variations we observed in the distance between the inner−outer segment junction and the retinal pigment epithelium inner surface do in fact represent changes in length of the outer segments, at least in rods.39,40 The changes could also be due to shrinking of the interphotoreceptor matrix, a change in refractive characteristics of the outer segments, increased engulfment of outer segment tips by the RPE, a change in the position or orientation of RPE melanosomes, or some other mechanism.
However, the time course of the OSEL changes we observed is very similar to the time course of the clinical EOG. With light onset, there is an initial lengthening of OSEL similar to the fast oscillation of the EOG,41 followed by a more pronounced and prolonged shortening of OSEL and corresponding EOG amplitude decrease (Fig. 4).23
The striking differences in the tomographic responses to light between normal subjects and patients with Best disease suggest that the relationship between the time course of the EOG and the outer segment structural changes we observed is more than a temporal coincidence. The abnormal EOG response associated with Best disease is very well established24; and when we performed SD-OCT in subjects with molecularly confirmed Best disease, we found a response that was very different from the response of normals. Although, as in normal subjects, the OSEL of Best patients shortened briefly after transitioning from ambient clinic light to the dark OCT suite, it quickly returned to baseline length and did not lengthen in the dark. It is notable in this context that Best disease patients are known to have a normal fast oscillation of the EOG but lack the prolonged dark trough and light peak.41 As the Best disease patients transitioned into light, their outer segments noticeably lengthened.
The light peak and dark trough responses of the EOG are traceable to bestrophin-1, a calcium-sensitive chloride channel situated in the basolateral membrane of the RPE.23 The link between stimulation of the photoreceptor cells and the rise in intra-RPE calcium that triggers bestrophin is not well understood despite decades of investigation. Some investigators believe that a diffusible substance is released from the photoreceptor that binds to a receptor on the apical membrane of the RPE.42
The outer segment kinetics on SD-OCT of the Best disease patients in the dark seem reasonably explicable by the loss of bestrophin-1 function, but the movements in the light are more puzzling. That is, the small initial shortening that occurs in normal individuals and Best patients as they transition from light to dark is coincident with the “off” fast oscillation, which is normal in Best patients.41 The outer segment elongation in the dark, and the dark trough of the EOG, are both present in normal patients and absent in Best patients. When Best disease subjects transition from dark to light, there is a slow lengthening of the outer segments.
The initial lengthening of the outer segments shortly after light onset is coincident with the “on” fast oscillation, which is also normal in Best patients.41 The inexplicable observation is that the loss of the light peak of the EOG is not simply associated with the loss of shortening; it is associated with a noticeable lengthening of the OSEL. One explanation for this observation is that there is an RPE component (engulfment or docking of the outer segment to the RPE) and a photoreceptor component (anatomical elongation) to the OSEL changes we have observed. According to this idea, the bestrophin-mediated slow phases of the EOG would regulate docking (shortening of the OSEL), while the slow elongation of the rod outer segments in light would be independent of the RPE. It is possible that in normal subjects, the photoreceptor-based OS lengthening in response to light is hidden by the larger RPE-dependent shortening of the OS. Thus, Best disease subjects may be allowing us to observe the kinetics of the OSEL in isolation from the RPE-dependent responses. Light-dependent retinomotor movements that are independent of the RPE are known to occur in teleosts42,43 but have not been consistently seen in mammals.
In summary, we have shown that the light phase of the EOG is temporally related to a decrease in the length of outer segments on SD-OCT in normal subjects, and that the lack of a light phase in Best disease subjects is associated with an increase in outer segment length on SD-OCT. It is possible that one of the roles of Bestrophin-1 is to trigger an increase in the standing potential that approximates the outer segments to the apical surface of the RPE to facilitate phagocytosis. Our findings provide additional insight into the pathophysiology of Best disease. Validation of these findings and exploration of their mechanisms in animal models may suggest new therapeutic interventions for this condition.
Acknowledgments
Supported by National Institutes of Health Grants R01 EY018853, R01 EY019112, R01 EY017451, R01 EY016822, and R01 EB004640; the Department of Veterans Affairs I01 CX000119; Research to Prevent Blindness, New York, New York; an American Glaucoma Society Midcareer Physician Scientist Award; the Hansjoerg E.J.W. Kolder, MD, PhD Professorship for Best Disease Research; the Foundation Fighting Blindness; the Marlene S. and Leonard A. Hadley Glaucoma Research Fund; and the Howard Hughes Medical Institute. A patent application exists for the graph-theoretic approach used to segment the intraretinal layers in this work, and inventors on this patent application are Michael D. Abràmoff, Mona K. Garvin, and Milan Sonka.
Disclosure: M.D. Abràmoff, P; R.F. Mullins, None; K. Lee, None; J.M. Hoffmann, None; M. Sonka, P; D.B. Critser, None; S.F. Stasheff, None; E.M. Stone, None
References
- 1. Best F. II. Über eine hereditäre Maculaaffektion. Ophthalmologica. 1905; 13: 199–212 [Google Scholar]
- 2. Stone EM, Nichols BE, Streb LM, Kimura AE, Sheffield VC. Genetic linkage of vitelliform macular degeneration (Best's disease) to chromosome 11q13. Nat Genet. 1992; 1: 246–250 [DOI] [PubMed] [Google Scholar]
- 3. Petrukhin K, Koisti MJ, Bakall B, et al. Identification of the gene responsible for Best macular dystrophy. Nat Genet. 1998; 19: 241–247 [DOI] [PubMed] [Google Scholar]
- 4. Iannaccone A, Kerr NC, Kinnick TR, Calzada JI, Stone EM. Autosomal recessive best vitelliform macular dystrophy: report of a family and management of early-onset neovascular complications. Arch Ophthalmol. 2011; 129: 211–217 [DOI] [PubMed] [Google Scholar]
- 5. Chung MM, Oh KT, Streb LM, Kimura AE, Stone EM. Visual outcome following subretinal hemorrhage in Best disease. Retina. 2001; 21: 575–580 [DOI] [PubMed] [Google Scholar]
- 6. Marmorstein AD, Marmorstein LY, Rayborn M, Wang X, Hollyfield JG, Petrukhin K. Bestrophin, the product of the Best vitelliform macular dystrophy gene (VMD2), localizes to the basolateral plasma membrane of the retinal pigment epithelium. Proc Natl Acad Sci U S A. 2000; 97: 12758–12763 [DOI] [PMC free article] [PubMed] [Google Scholar]
- 7. Sun H, Tsunenari T, Yau K, Nathans J. The vitelliform macular dystrophy protein defines a new family of chloride channels. Proc Natl Acad Sci U S A. 2002; 99: 4008–4013 [DOI] [PMC free article] [PubMed] [Google Scholar]
- 8. Bakall B, Marmorstein LY, Hoppe G, Peachey NS, Wadelius C, Marmorstein AD. Expression and localization of bestrophin during normal mouse development. Invest Ophthalmol Vis Sci. 2003; 44: 3622–3628 [DOI] [PubMed] [Google Scholar]
- 9. Hartzell HC, Qu Z, Yu K, Xiao Q, Chien LT. Molecular physiology of bestrophins: multifunctional membrane proteins linked to best disease and other retinopathies. Physiol Rev. 2008; 88: 639–672 [DOI] [PubMed] [Google Scholar]
- 10. Hartzell C, Qu Z, Putzier I, Artinian L, Chien LT, Cui Y. Looking chloride channels straight in the eye: bestrophins, lipofuscinosis, and retinal degeneration. Physiology. 2005; 20: 292–302 [DOI] [PubMed] [Google Scholar]
- 11. Rosenthal R, Bakall B, Kinnick T, et al. Expression of bestrophin-1, the product of the VMD2 gene, modulates voltage-dependent Ca2+ channels in retinal pigment epithelial cells. FASEB J. 2006; 20: 178–180 [DOI] [PubMed] [Google Scholar]
- 12. Marmorstein AD, Stanton JB, Yocom J, et al. A model of best vitelliform macular dystrophy in rats. Invest Ophthalmol Vis Sci. 2004; 45: 3733–3739 [DOI] [PMC free article] [PubMed] [Google Scholar]
- 13. Marmorstein LY, Wu J, McLaughlin P, et al. The light peak of the electroretinogram is dependent on voltage-gated calcium channels and antagonized by bestrophin (best-1). J Gen Physiol. 2006; 127: 577–589 [DOI] [PMC free article] [PubMed] [Google Scholar]
- 14. Zhang Y, Stanton JB, Wu J, et al. Suppression of Ca2+ signaling in a mouse model of Best disease. Hum Mol Genet. 2010; 19: 1108–1118 [DOI] [PMC free article] [PubMed] [Google Scholar]
- 15. Zangerl B, Wickstrom K, Slavik J, et al. Assessment of canine BEST1 variations identifies new mutations and establishes an independent bestrophinopathy model (cmr3). Mol Vis. 2010; 16: 2791–2804 [PMC free article] [PubMed] [Google Scholar]
- 16. Guziewicz KE, Zangerl B, Lindauer SJ, et al. Bestrophin gene mutations cause canine multifocal retinopathy: a novel animal model for best disease. Invest Ophthalmol Vis Sci. 2007; 48: 1959–1967 [DOI] [PMC free article] [PubMed] [Google Scholar]
- 17. Boon CJ, Klevering BJ, Leroy BP, Hoyng CB, Keunen JE, den Hollander AI. The spectrum of ocular phenotypes caused by mutations in the BEST1 gene. Prog Retin Eye Res. 2009; 28: 187–205 [DOI] [PubMed] [Google Scholar]
- 18. Schatz P, Bitner H, Sander B, et al. Evaluation of macular structure and function by OCT and electrophysiology in patients with vitelliform macular dystrophy due to mutations in BEST1. Invest Ophthalmol Vis Sci. 2010; 51: 4754–4765 [DOI] [PubMed] [Google Scholar]
- 19. Burgess R, Millar ID, Leroy BP, et al. Biallelic mutation of BEST1 causes a distinct retinopathy in humans. Am J Hum Genet. 2008; 82: 19–31 [DOI] [PMC free article] [PubMed] [Google Scholar]
- 20. Kinnick TR, Mullins RF, Dev S, et al. Autosomal recessive vitelliform macular dystrophy in a large cohort of vitelliform macular dystrophy patients. Retina. 2011; 31: 581–595 [DOI] [PubMed] [Google Scholar]
- 21. Yardley J, Leroy BP, Hart-Holden N, et al. Mutations of VMD2 splicing regulators cause nanophthalmos and autosomal dominant vitreoretinochoroidopathy (ADVIRC). Invest Ophthalmol Vis Sci. 2004; 45: 3683–3689 [DOI] [PubMed] [Google Scholar]
- 22. Davidson AE, Millar ID, Urquhart JE, et al. Missense mutations in a retinal pigment epithelium protein, bestrophin-1, cause retinitis pigmentosa. Am J Hum Genet. 2009; 85: 581–592 [DOI] [PMC free article] [PubMed] [Google Scholar]
- 23. Arden GB, Constable PA. The electro-oculogram. Prog Retin Eye Res. 2006; 25: 207–248 [DOI] [PubMed] [Google Scholar]
- 24. Wajima R, Chater SB, Katsumi O, Mehta MC, Hirose T. Correlating visual acuity and electrooculogram recordings in Best's disease. Ophthalmologica. 1993; 207: 174–181 [DOI] [PubMed] [Google Scholar]
- 25. Mullins RF, Oh KT, Heffron E, Hageman GS, Stone EM. Late development of vitelliform lesions and flecks in a patient with best disease: clinicopathologic correlation. Arch Ophthalmol. 2005; 123: 1588–1594 [DOI] [PubMed] [Google Scholar]
- 26. Bialek S, Miller SS. K+ and Cl- transport mechanisms in bovine pigment epithelium that could modulate subretinal space volume and composition. J Physiol. 1994; 475: 401–417 [DOI] [PMC free article] [PubMed] [Google Scholar]
- 27. Huang B, Karwoski CJ. Light-evoked expansion of subretinal space volume in the retina of the frog. J Neurosci. 1992; 12: 4243–4252 [DOI] [PMC free article] [PubMed] [Google Scholar]
- 28. Kay CN, Abramoff MD, Mullins RF, et al. Three-dimensional distribution of the vitelliform lesion, photoreceptors, and retinal pigment epithelium in the macula of patients with best vitelliform macular dystrophy. Arch Ophthalmol. 2012; 130: 357–364 [DOI] [PMC free article] [PubMed] [Google Scholar]
- 29. Abramoff MD, Garvin M, Sonka M. Retinal imaging and image analysis. IEEE Rev Biomed Eng. 2010; 3: 169–208 [DOI] [PMC free article] [PubMed] [Google Scholar]
- 30. Mullins RF, Kuehn MH, Faidley EA, Syed NA, Stone EM. Differential macular and peripheral expression of bestrophin in human eyes and its implication for best disease. Invest Ophthalmol Vis Sci. 2007; 48: 3372–3380 [DOI] [PubMed] [Google Scholar]
- 31. Haeker M, Abramoff M, Kardon R, Sonka M. Segmentation of the surfaces of the retinal layer from OCT images. Med Image Comput Comput Assist Interv. 2006; 4190 (pt 1): 800–807 [DOI] [PubMed] [Google Scholar]
- 32. Garvin MK, Abramoff MD, Wu X, Russell SR, Burns TL, Sonka M. Automated 3-D intraretinal layer segmentation of macular spectral-domain optical coherence tomography images. IEEE Trans Med Imaging. 2009; 28: 1436–1447 [DOI] [PMC free article] [PubMed] [Google Scholar]
- 33. Spaide RF, Curcio CA. Anatomical correlates to the bands seen in the outer retina by optical coherence tomography: literature review and model. Retina. 2011; 31: 1609–1619 [DOI] [PMC free article] [PubMed] [Google Scholar]
- 34. Marmor MF, Brigell MG, McCulloch DL, Westall CA, Bach M; International Society for Clinical Electrophysiology of Vision. ISCEV standard for clinical electro-oculography (2010 update). Doc Ophthalmol. 2011; 122: 1–7 [DOI] [PubMed] [Google Scholar]
- 35. Young RW. The renewal of photoreceptor cell outer segments. J Cell Biol. 1967; 33: 61–72 [DOI] [PMC free article] [PubMed] [Google Scholar]
- 36. LaVail MM. Rod outer segment disc shedding in relation to cyclic lighting. Exp Eye Res. 1976; 23: 277–280 [DOI] [PubMed] [Google Scholar]
- 37. White MP, Hock PA. Effects of continuous darkness on ERG correlates of disc shedding in rabbit retina. Exp Eye Res. 1992; 54: 173–180 [DOI] [PubMed] [Google Scholar]
- 38. Kevany BM, Palczewski K. Phagocytosis of retinal rod and cone photoreceptors. Physiology. 2010; 25: 8–15 [DOI] [PMC free article] [PubMed] [Google Scholar]
- 39. Jonnal RS, Kocaoglu OP, Wang Q, Lee S, Miller DT. Phase-sensitive imaging of the outer retina using optical coherence tomography and adaptive optics. Biomed Opt Express. 2012; 3: 104–124 [DOI] [PMC free article] [PubMed] [Google Scholar]
- 40. Jonnal RS, Besecker JR, Derby JC, et al. Imaging outer segment renewal in living human cone photoreceptors. Opt Express. 2010; 18: 5257–5270 [DOI] [PMC free article] [PubMed] [Google Scholar]
- 41. Weleber RG. Fast and slow oscillations of the electro-oculogram in Best's macular dystrophy and retinitis pigmentosa. Arch Ophthalmol. 1989; 107: 530–537 [DOI] [PubMed] [Google Scholar]
- 42. Gallemore RP, Griff ER, Steinberg RH. Evidence in support of a photoreceptoral origin for the “light-peak substance.” Invest Ophthalmol Vis Sci. 1988; 29: 566–571 [PubMed] [Google Scholar]
- 43. Walls GL. The Vertebrate Eye and Its Adaptive Radiation. New York: Hafner Publishing Co.; 1963: 150 [Google Scholar]