Abstract
Purpose.
Low tear volume limits the use of nonstimulated (NS) microcapillary tear collection in aqueous-deficient (AD) patients. Adding a small amount of “washout” fluid to the eye prior to tear collection is a potentially viable alternative method for abundant proteins, but is relatively untested for low-abundance biomarkers. This study determined the feasibility of the washout (WO) method as an NS alternative for low-abundance biomarkers. NS and WO biomarker profiles were compared between AD patients and non-AD controls to determine if the two methods identify the same intergroup differences.
Methods.
Matching NS and WO tears were collected from 48 patients by micropipette, the WO sample after instillation of 10 μL saline. Tear cytokine levels were measured by 27-Plex Bio-Rad assay. Bland–Altman analyses for each biomarker determined the agreement between tear sample types. Patients were grouped as AD or non-AD based on Schirmer score to determine if NS profile between-group differences were preserved in WO tears.
Results.
Bland–Altman plots showed good biomarker level agreement between NS and WO tears for most cytokines. Five biomarkers, among those most often cited as differing in AD dry eye, differed significantly between non-AD and AD groups in both tear types. Additional biomarker differences were seen in NS tears only.
Conclusions.
The WO tear collection method is a viable alternative to NS tears for many low-abundance biomarkers and is able to replicate major NS tear differences between dry eye groups. More subtle intergroup differences are lost in WO samples because of reduced statistical power.
Keywords: washout tears, aqueous deficient, tear biomarkers, non-stimulated tears
Microcapillary-collected washout tears are a viable alternative to nonstimulated tears to assay a range of low and moderate abundance dry eye biomarkers. Comparing biomarker profiles between normal and aqueous-deficient patients, the main intergroup differences are preserved in washout tears.
Introduction
The emphasis in dry eye research has shifted increasingly toward the role of ocular surface inflammation.1 Because inflammatory mediators originate from various ocular surface sources and the main lacrimal gland, tear collection method can influence the resulting biomarker profile. Nonstimulated (NS) tears collected from the inferior marginal strip sample a broader spectrum of these sources, while stimulated tears are biased strongly toward the lacrimal gland contribution.2 Protein profile differences between NS and stimulated tears demonstrate that the two sample types are not equivalent.2–4 While NS tears better represent the inflammatory status of the ocular surface, NS volume is limited, especially in aqueous-deficient (AD) dry eye. To address low aqueous volume limitations, many absorptive substrate tear collection methods have been investigated,5–8 Schirmer strip collection being the most common.6 Samples obtained using the Schirmer test procedure contain higher mucus, lipid, and cellular content than microcapillary samples.9 Schirmer strips also suffer incomplete, nonuniform elution of proteins from the filter matrix.6 Although micropipette and Schirmer collection provide different biomarker profiles for a given donor,10 the correctly applied micropipette method is more consistent.
One way to address the volume limitation of micropipette tear collection is to add fluid (e.g., sterile saline) to the eye prior to sample collection, effectively “washing out” ocular surface proteins and increasing collected volume.11,12 An important measure of the validity of a washout (WO) method is the extent to which it changes the NS tear biomarker profile (relative contributions of constituent biomarkers). Inducement of reflex tearing, a particular concern, is easily detected because tear secretory IgA (sIgA) levels decrease with reflex tear flow rate.3 The fact that Markoulli et al. found equal tear sIgA–total tear ratios in WO and NS tears13 suggests that WO tear samples do not induce significant reflex tearing.
Comparing a range of low- to moderate-abundance tear biomarker levels in matched NS and WO tears will determine the extent to which the WO method can substitute for NS tear collection. Two primary issues are the proportion of “just-quantifiable” NS biomarkers that shift below threshold with the WO method diluting effect and the consistency of the NS–WO tear biomarker level relationship between normal and AD patients. The current study evaluated WO tear collection as a replacement for microcapillary NS tears and applied this to a comparison of biomarker levels between non-AD and AD patients.14
Methods
All aspects of this study adhered to the guidelines of the Declaration of Helsinki and were conducted with the approval of the University of Alabama-Birmingham Institutional Review Board. Patients ranging from normal to severely aqueous deficient were recruited. Prior to study entry, all patients underwent ocular surface health assessment, including history, Ocular Surface Disease Index (OSDI) questionnaire, and a battery of dry eye tests including the Schirmer I test. Schirmer test cutoff values for AD dry eye vary from 5 mm/5 min15 to 10 mm/5 min,16 the higher cutoff having lower specificity but a 58% higher sensitivity of 83%16 according to the Dry Eye WorkShop (DEWS) report.17 One study goal was to compare patients expected to have difficulty providing sufficient NS tear volume with those who should not, so the higher cutoff of AD was adopted. Despite the inclusion of an entire battery of clinical tests, the single metric of Schirmer score to group patients was considered appropriate because it directly addresses the primary challenge of tear sample collection from low aqueous volume patients, and also because several recent studies have demonstrated the poor correlation among standard clinical tests for diagnosis of dry eye.18
Matched NS and WO samples from the same eye were collected over a total of 54 patient visits. Biomarkers varying from very low to relatively high abundance were assayed in each NS and WO tear sample using a multiplexed assay format.
Tear Collection
Ten-microliter polished micropipettes (Drummond, Broomall, PA) were used to collect tears from the inferior marginal strip, care being taken to minimize ocular surface contact. Tear collection rate was continually monitored. Individual NS tear samples were collected in 10-minute aliquots, each being immediately transferred to a sterile PCR tube. An equal volume of PBS/1% BSA/0.05% Tween 20 assay buffer (Teknova, Hollister, CA) containing a 2× strength EDTA-free antiprotease cocktail (Thermo-Fisher Pierce, Rockford, IL) was added and the sample stored at −86°C. A total of at least 6.5 μL NS tears was collected from each study participant, each 10-minute aliquot being stored without delay in a separate PCR tube.
Prior to WO tear sample collection, 10 μL sterile saline (Hudson RCI, Durham, NC) was added to the lower conjunctiva by digital pipette (Rainin LiteTouch System digital pipette; Rainin Instrument LLC, Oakland, CA). The patient was instructed to gently close the eyes and avoid eye movements for 1 minute. Tears were then collected using the same method as for NS samples, but a shorter collection time of 5 minutes per aliquot was used to make up the 6.5 μL minimum volume requirement. Tear collection volume and time were continually monitored to obtain a measure of tear collection rate.
Tear Assay
All tear samples were assayed using a previously tear-validated Bio-Rad 27-Plex polystyrene bead–based assay (Bio-Rad, Hercules, CA) and included the same modifications.19 In that study, average NS tear biomarker levels for normal patients spanned more than three orders of magnitude, from 5.2 pg/mL for IL-1β to 23,600 pg/mL for Interferon gamma-inducible protein 10 (IP-10). This range is suited to compare assay dynamic range between WO and NS tears.
Statistical Analysis
Pearson correlations between NS and WO assays for each of the 25 consistently detectable cytokines indicated the extent to which WO tear samples reflect NS sample values. According to Bland and Altman,20 sample variability can artificially inflate correlation coefficients, whereas plots of differences (NS versus WO) versus means (Bland–Altman plots) for each biomarker will better determine agreement between the two tear collection methods and will identify outliers.20,21 Samples with large NS versus WO discrepancies were flagged as potential outliers, and the tenability of values was evaluated. Slope for each Bland–Altman plot regression line indicated the magnitude of disagreement between NS and WO assays. Paired t-tests were used to assess mean differences between the NS and WO assays for each cytokine.
After the above analyses were conducted for the entire patient pool, they were run separately for the Schirmer-defined non-AD versus AD groups. Between-group mean differences were assessed using Satterthwaite t-tests that adjust unequal variances. Between-group differences in variance were tested using Hartley's folded F-test. Where biomarkers showed skewed distributions, Spearman rank-based correlations, Wilcoxon signed rank tests to assess distributional differences between NS and WO assays, and Kruskal–Wallis tests to assess distributional differences between the normal and AD groups were conducted.
The effect of each collection method on the overall cytokine profile was also evaluated. To create a comparable overall cytokine profile, the data for each cytokine were standardized to a mean of zero and variance of 1. The NS and WO assays for each cytokine were pooled and then standardized: Zk = (Yk − Mk)/SDk, where Yk is the level of the kth cytokine, Mk is the mean level of the kth cytokine pooled across assays, and SDk is the standard deviation of the level of the kth cytokine pooled across assays. This procedure places each cytokine on the same scale while preserving the differences between the NS and WO assays and the non-AD versus AD group differences. Being a linear transformation of data, it has no effect on the previous statistical tests.
Age effects on tear cytokine profiles and AD versus non-AD comparisons were investigated using Pearson correlations. Analysis of covariance (ANCOVA) models used NS and WO cytokine levels as dependent variable, AD status as group variable, and age as covariate.
Results
A total of 63 paired NS and WO tear samples were collected. In cases in which paired tear samples were collected from both eyes of the same patient, the non-AD versus AD grouping criterion was applied independently to each eye. Patient data are summarized in Table 1.
Table 1. .
NS Versus WO Tear Samples: All Patients, Paired Comparisons
|
Non-AD |
AD |
|
| Number of patients/eyes | 23/26 | 26/37 |
| Age, y | 42.4 ± 18.8* | 49.9 ± 13.9 |
| Age range, y | 21–75 | 21–72 |
| Schirmer test, mm/5 min | 22.6 ± 9.5 | 4.6 ± 2.4 |
| OSDI score | 17 ± 21 | 30 ± 19 |
| Tear osmolarity, mOsm/L | 295 ± 13 | 301 ± 14 |
| NIBUT, s | 13.1 ± 7.0 | 10.1 ± 5.3 |
| Fluorescein score, Oxford | 0.8 ± 1.1 | 2.1 ± 2.0 |
| Lissamine green score, Oxford | 1.0 ± 1.3 | 2.5 ± 2.0 |
OSDI, Ocular Surface Disease Index; NIBUT, noninvasive tear breakup time.
Mean ± standard deviation.
Overall Comparisons: NS Versus WO Tear Cytokine Assay Results
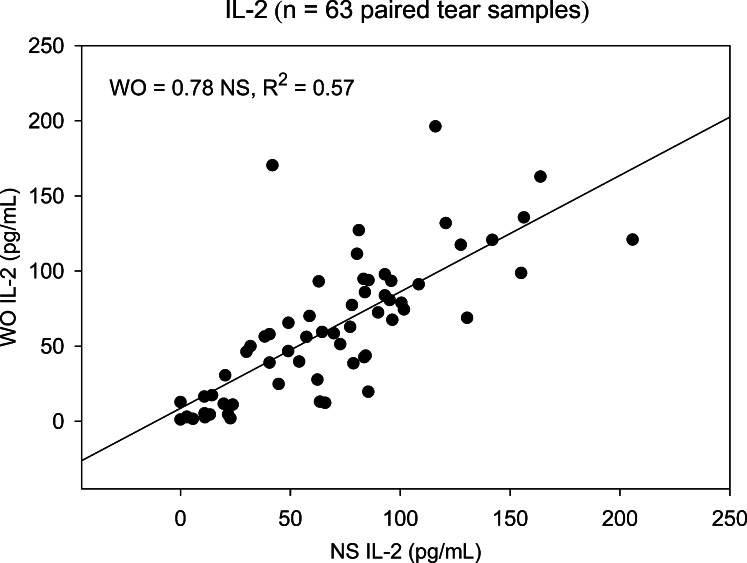
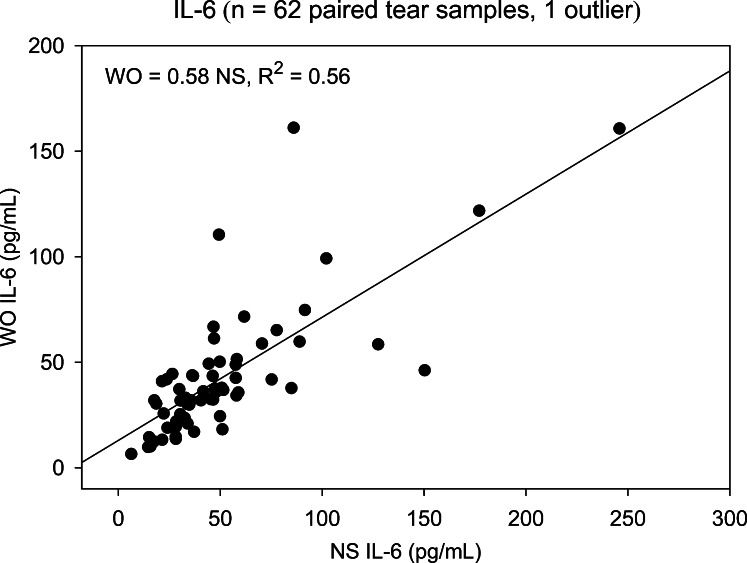
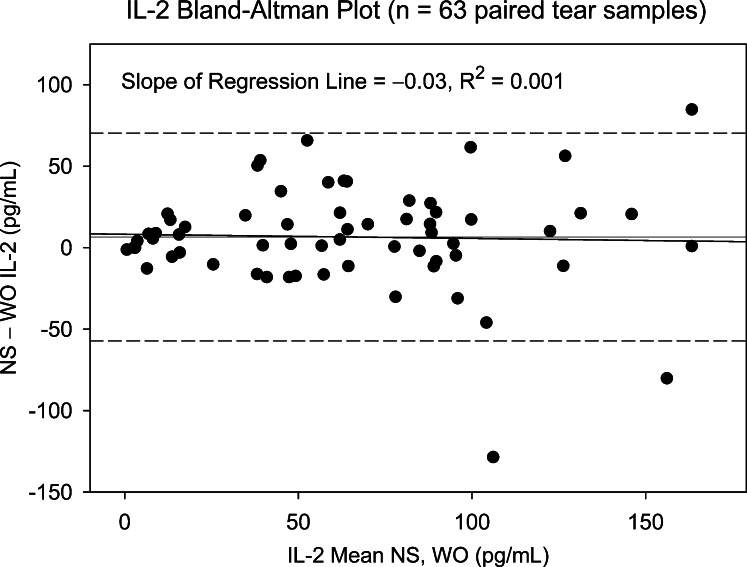
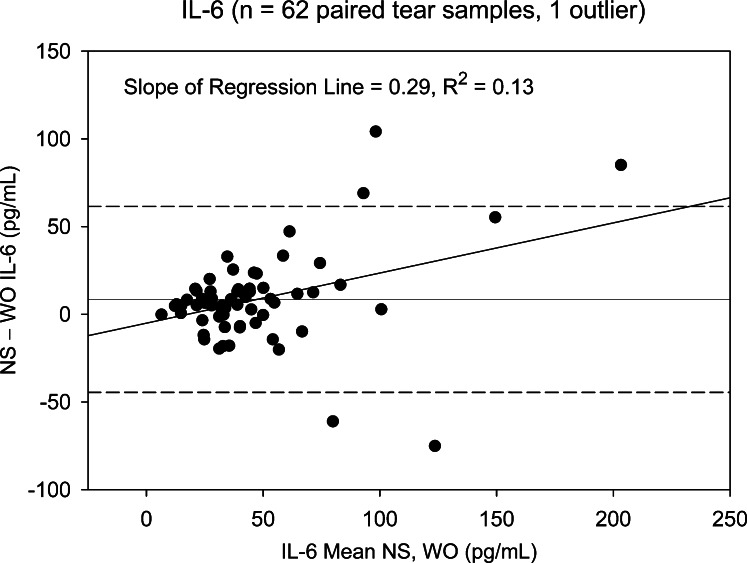
Two cytokines, FGF-basic and Monocyte-inducible protein (MIP)-1β, detected in less than 25% of NS and WO tear samples, were excluded from subsequent analyses. The remaining 25 cytokines were detected in at least 80% of patient samples. NS and WO tear comparisons across the entire patient group are shown in Table 2. Scatter plots for most cytokines show good agreement, with significant NS versus WO correlations for all 25 cytokines, 19 showing correlation coefficients > 0.75 (R2 ≥ 0.56). However, scatter plots do not reveal the agreement between WO cytokine levels and their corresponding NS levels. Apart from higher means for NS tear cytokine levels, paired t-tests and signed rank tests show significant distributional differences between NS and WO tear samples for nearly all cytokines. This is due to a broader range of NS tear values, in particular at the upper end. For any cytokine showing a significant distributional difference but no Bland–Altman plot bias, the WO cytokine level is simply underestimating the NS level by a constant value and is a viable “proxy” measurement. However, when there is significant Bland–Altman slope bias, the ability of WO tears to replace NS is questionable (Table 2). Nine cytokines fall into this category: IL-8, IL-1β, VEGF, Granulocyte-colony stimulating factor (G-CSF), IL-9, IL-15, IL-6, IL-7, and IP-10. As an example, NS versus WO scatter plots for IL-2 and IL-6 (Figs. 1, 2, respectively) both show reasonably strong, statistically significant (Table 2), correlations. However, the corresponding Bland–Altman plots (Figs. 3, 4), demonstrate stronger agreement between tests for IL-2 than for IL-6. There are more data points outside the ±2 standard deviation Bland–Altman limit for IL-6, and there is a significant Bland–Altman plot bias (slope) for IL-6, but not IL-2 (Table 2).
Table 2. .
NS Versus WO Tear Samples: All Patients, Paired Comparisons
|
Cytokine |
NS vs. WO Slope (Slope
R2,
P) |
NS Level (SD) |
WO Level (SD) |
NS − WO (SD) |
B-A Slope (P
Value) |
| IL-8 | 0.33 (0.29, <0.001) | 316.6 (307.3) | 195.7 (185.9) | 120.9† (257.5) | 0.62 (<0.0001) |
| IL-1β | 0.57 (0.72, <0.001) | 6.03* (7.92)* | 4.28 (5.29) | 1.74† (4.38) | 0.43 (<0.0001) |
| VEGF | 0.53 (0.47, <0.001) | 435.9 (294.1) | 354.3 (223.9) | 81.57† (213.4) | 0.32 (0.004) |
| IL-1RA | 0.66 (0.56, <0.001) | 10,195 (15,925) | 9,197 (14,038) | 997.3 (10,662) | 0.14 (0.14) |
| G-CSF | 0.64 (0.66, <0.001) | 34.38 (38.14) | 29.64 (30.14) | 4.74‡ (22.21) | 0.26 (0.002) |
| IL-9 | 0.25 (0.16, <0.001) | 49.02 (40.54) | 34.14 (24.58) | 14.88† (37.74) | 0.68 (<0.0001) |
| Eotaxin | 0.69 (0.48, <0.001) | 111.1 (66.32) | 90.91 (64.86) | 20.17† (50.77) | 0.03 (0.81) |
| IL-15 | 0.64 (0.62, <0.001) | 7.63 (5.43) | 5.89 (4.39) | 1.74† (3.34) | 0.23 (0.01) |
| GM-CSF | 0.69 (0.45, <0.001) | 192.4 (148.0) | 162.7 (151.7) | 29.72‡ (120.3) | −0.03 (0.79) |
| IL-12p70 | 0.78 (0.68, <0.001) | 47.83 (20.13) | 42.12 (19.03) | 5.72† (11.48) | 0.061 (0.44) |
| MCP-1 | 0.73 (0.60, <0.001) | 108.3 (179.5) | 88.01 (168.2) | 20.32‡ (116.7) | 0.07 (0.43) |
| TNF-α | 0.78 (0.64, <0.001) | 590.0 (367.9) | 470.8 (358.2) | 119.2† (230.5) | 0.03 (0.73) |
| PDGF-bb | 0.74 (0.60, <0.001) | 16.80 (16.17) | 14.57 (15.39) | 2.24‡ (10.52) | 0.06 (0.54) |
| MIP-1α | 0.86 (0.79, <0.001) | 92.75 (73.82) | 77.56 (70.93) | 15.19† (33.87) | 0.04 (0.49) |
| IL-6 | 0.58 (0.56, <0.001) | 51.55 (40.07) | 43.09 (31.14) | 8.46† (26.50) | 0.29 (0.004) |
| IL-7 | 0.70 (0.68, <0.001) | 95.28 (57.11) | 79.04 (48.56) | 16.23† (32.06) | 0.18 (0.03) |
| IL-13 | 0.81 (0.70, <0.001) | 17.21 (7.44) | 16.02 (7.21) | 1.18† (4.19) | 0.08 (0.66) |
| IL-10 | 0.81 (0.69, <0.001) | 110.5 (42.70) | 97.13 (41.81) | 13.41† (24.73) | 0.02 (0.77) |
| IL-17 | 0.92 (0.92, <0.001) | 11.98 (15.01) | 10.07 (14.30) | 1.91† (4.18) | 0.05 (0.18) |
| RANTES | 0.91 (0.79, <0.001) | 115.8 (70.53) | 105.3 (71.96) | 10.49† (33.70) | −0.02 (0.73) |
| IL-4 | 0.76 (0.57, <0.001) | 32.84 (19.17) | 29.29 (19.27) | 3.55† (13.34) | −0.005 (0.96) |
| IFN-γ | 0.82 (0.62, <0.001) | 496.7 (367.7) | 446.5 (381.5) | 50.25‡ (242.6) | −0.04 (0.64) |
| IL-2 | 0.78 (0.57, <0.001) | 67.79 (45.29) | 61.21 (46.32) | 6.58‡ (31.89) | −0.03 (0.79) |
| IL-5 | 0.78 (0.58, <0.001) | 9.27 (8.11) | 8.36 (8.23) | 0.91‡ (5.58) | −0.02 (0.86) |
| IP-10 | 0.36 (0.31, <0.001) | 17,111 (14,281) | 14,360 (9,061) | 2,750‡ (11,791) | 0.56 (<0.0001) |
FGF-basic and MIP-1β are not included because of low detection rate among patients. B-A slope, slope of Bland–Altman plot regression line.
Cytokine levels in pg/mL (±standard deviation).
P values from Wilcoxon signed rank test and paired t-test < 0.05.
P value from the Wilcoxon signed rank test only < 0.05.
Figure 1. .
Scatter plot showing the correlation between NS and WO tear levels of IL-2 for the entire patient group. Slope of the linear regression line shows that WO tear IL-2 levels averaged 78% of NS levels and correlated strongly (R2 = 0.57, P < 0.001).
Figure 2. .
Scatter plot showing correlation between NS and WO tear levels of IL-6 for the entire patient group. Slope of the linear regression line shows that WO tear IL-2 levels averaged 58% of NS levels with a strong correlation (R2 = 0.56, P < 0.001).
Figure 3. .
Bland–Altman plot showing difference between NS and WO tear IL-2 level versus mean level for paired tear samples (entire patient group). Slope of the regression plot is negligible, indicating that the difference between NS and WO levels does not vary as a function of the mean. Dashed lines represent 95% confidence limits. Three data points fall outside the Bland–Altman range for agreement between tests.
Figure 4. .
Bland–Altman plot showing difference between NS and WO tear IL-6 levels versus mean level for paired tear samples (entire patient group). Slope of the regression plot is positive, indicating that the difference between NS and WO levels increases as a function of the mean. Dashed lines represent 95% confidence limits. Five data points fall outside the Bland–Altman range for agreement between tests.
Schirmer Score (Tear Availability) Influence on NS Versus WO Tear Cytokine Levels
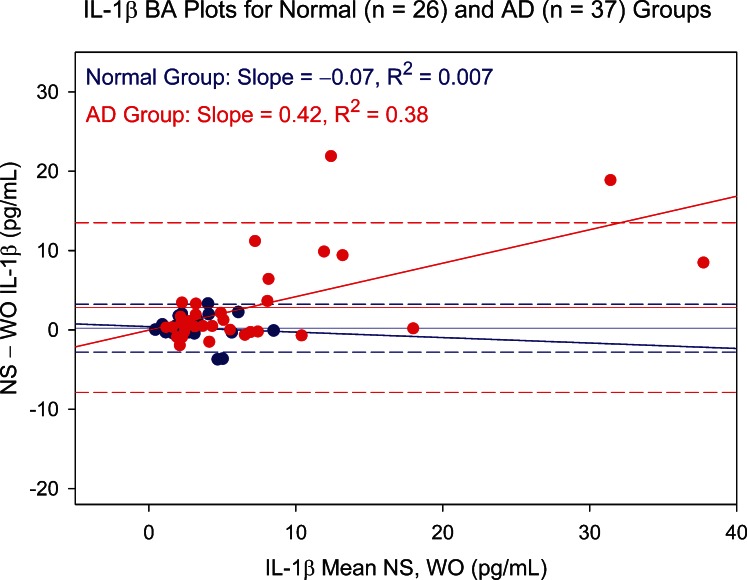
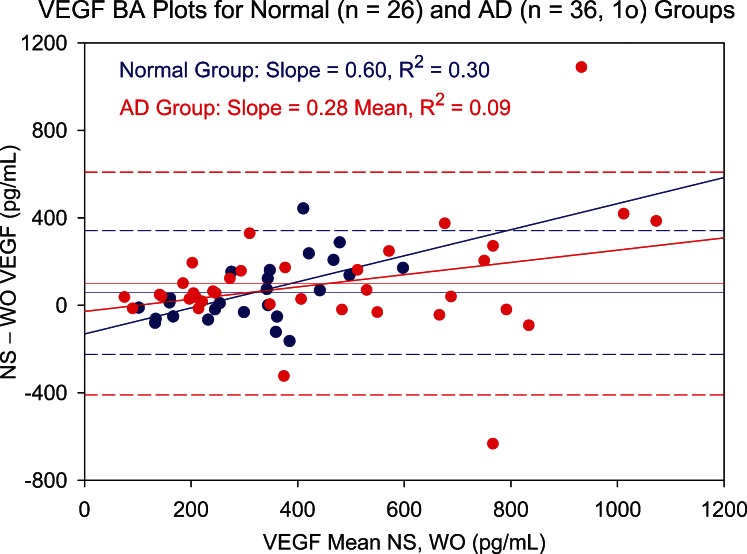
To further explore why WO tear levels of nine cytokines were questionable, the influence of available NS tear volume was investigated using Schirmer score–based patient groups. The rationale for allocating Schirmer-based groups was 2-fold. First, WO tear collection should be of greatest benefit for patients whose aqueous tear volume is limited. For these AD patients, NS collection would be expected to take longer than for the non-AD group. Second, the added fixed volume of WO fluid would be expected to constitute a larger part of the total collected sample for AD patients due to the presence of less tear fluid prior to supplementation. Separate analyses of non-AD and AD groups indicated that, for the nine cytokines eliciting significant Bland–Altman plot bias, the primary reason was higher and more variable AD patient cytokine levels. Examples are shown in Figures 5 (IL-1β) and 6 (VEGF). For seven of the nine cytokines, AD patients showed significantly larger variance on both the NS and WO assays (folded F-tests). In addition, for these cytokines, there was better NS and WO assay agreement in the non-AD patient group.
Figure 5. .
Bland–Altman (BA) plot showing NS versus WO tear levels of IL-1β for normal (blue circles) and aqueous-deficient (AD, red circles) patient groups. Difference between NS and WO tear IL-1β levels is plotted against mean level for paired tear samples. Slope of the BA plot is negligible for the normal group but shows a trend for the much more scattered aqueous-deficient group data toward an increasing difference with increasing mean. Dashed lines represent 95% confidence limits.
Figure 6. .
Bland–Altman (BA) plot showing NS versus WO tear levels of VEGF for normal (blue circles) and aqueous-deficient (AD, red circles) patient groups. Difference between NS and WO tear VEGF levels is plotted against mean level for paired tear samples. Slope of the BA plot is positive for both groups. Both groups show increased scatter with increasing mean VEGF level, but the effect is more pronounced for the AD group. Dashed lines represent 95% confidence limits. 1o, one outlier.
NS Versus WO Tear Comparisons for AD and Non-AD Groups
Table 3 shows significant differences between non-AD and AD groups in NS tear levels of 10 cytokines (IL-8, IL-1β, VEGF, Interleukin 1 receptor antagonist [IL-1RA], G-CSF, IL-9, eotaxin, IL-15, Granulocyte-macrophage colony-stimulating factor [GM-CSF], and IL-12p70) by either the Kruskal–Wallis or Satterthwaite t-test or both. WO assays showed significant between-group differences for 5 of these 10 cytokines (IL-8, IL-1β, VEGF, IL-1RA, and G-CSF). Four of the five were cytokines that show Bland–Altman plot bias in Table 2. This suggests an important role of aqueous tear availability in the plot bias for these cytokines.
Table 3. .
Mean Cytokine Levels (SD) and Standardized Effect Sizes for Between-Group Comparisons of Non-AD Versus AD Patient NS and WO Tear Samples
|
Cytokine |
Nonstimulated |
Washout |
||||||||
|
Normal (n
= 26) |
AD (n
= 37) |
ES,
N |
ES, AD |
ES, Total |
Normal (n
= 26) |
AD (n
= 37) |
ES,
N |
ES, AD |
ES, Total |
|
| IL-8* | 193.80 (142.63) | 403.30 (360.84) | −0.24 | 0.57 | 0.81† | 125.29 (67.22) | 245.39 (224.45) | −0.50 | 0.04 | 0.54† |
| IL-1β* | 2.98 (1.95) | 8.17 (9.69) | −0.32 | 0.45 | 0.77† | 2.75 (2.06) | 5.35 (6.51) | −0.35 | 0.03 | 0.38† |
| VEGF* | 341.56 (178.81) | 503.99 (341.42) | −0.21 | 0.41 | 0.62‡ | 284.76 (109.13) | 404.53 (269.55) | −0.42 | 0.04 | 0.46‡ |
| IL-1RA* | 5,968.8 (7,043.0) | 13,334.0 (19,680.0) | −0.25 | 0.24 | 0.49‡ | 4,942.9 (6,856.0) | 12,358.0 (17,002.9) | −0.32 | 0.18 | 0.50† |
| G-CSF* | 25.30 (23.19) | 40.77 (45.06) | −0.20 | 0.26 | 0.46§ | 20.07 (15.78) | 36.36 (35.76) | −0.35 | 0.13 | 0.48† |
| IL-9|| | 33.92 (19.11) | 60.56 (48.42) | −0.22 | 0.56 | 0.78† | 28.74 (17.87) | 38.26 (28.25) | −0.38 | −0.10 | 0.28 |
| Eotaxin|| | 91.33 (53.13) | 124.96 (71.66) | −0.15 | 0.36 | 0.51‡ | 81.03 (58.90) | 97.85 (68.68) | −0.30 | −0.05 | 0.25 |
| IL-15|| | 6.12 (3.94) | 8.61 (6.05) | −0.13 | 0.37 | 0.50§ | 4.81 (3.40) | 6.59 (4.85) | −0.39 | −0.03 | 0.36 |
| GM-CSF|| | 148.82 (110.35) | 223.10 (164.12) | −0.19 | 0.30 | 0.49‡ | 164.50 (158.07) | 161.49 (149.24) | −0.09 | −0.11 | −0.02 |
| IL-12p70|| | 42.17 (15.80) | 51.81 (22.02) | −0.14 | 0.35 | 0.49‡ | 38.75 (14.44) | 44.49 (21.56) | −0.32 | −0.03 | 0.29 |
| MCP-1|| | 93.01 (184.79) | 119.09 (177.42) | −0.03 | 0.12 | 0.15§ | 84.70 (209.57) | 90.34 (135.02) | −0.08 | −0.05 | 0.03 |
| TNF-α | 489.17 (287.97) | 660.85 (403.78) | −0.11 | 0.36 | 0.47 | 415.31 (287.46) | 509.76 (399.78) | −0.31 | −0.05 | 0.26 |
| PDGF-bb | 12.67 (10.29) | 19.71 (18.86) | −0.19 | 0.26 | 0.45 | 12.94 (13.43) | 15.72 (16.72) | −0.17 | 0.01 | 0.18 |
| MIP-1α | 76.43 (61.07) | 104.22 (80.43) | −0.12 | 0.26 | 0.38 | 66.54 (61.79) | 85.31 (76.58) | −0.26 | 0.00 | 0.26 |
| IL-6 | 43.62 (22.08) | 57.12 (48.46) | −0.10 | 0.27 | 0.38 | 36.53 (20.00) | 47.71 (36.60) | −0.30 | 0.01 | 0.31 |
| IL-7 | 84.74 (44.31) | 102.68 (64.16) | −0.05 | 0.29 | 0.34 | 72.26 (31.17) | 83.81 (57.71) | −0.28 | −0.06 | 0.22 |
| IL-13 | 16.25 (6.61) | 17.88 (7.99) | −0.05 | 0.17 | 0.22 | 15.94 (6.33) | 16.08 (7.85) | −0.09 | −0.07 | 0.02 |
| IL-10 | 105.20 (33.97) | 114.29 (48.00) | 0.03 | 0.25 | 0.22 | 96.47 (31.53) | 97.58 (48.17) | −0.17 | −0.15 | 0.02 |
| IL-17 | 10.21 (14.19) | 13.23 (15.64) | −0.06 | 0.15 | 0.21 | 8.99 (14.81) | 10.83 (14.09) | −0.14 | −0.01 | 0.13 |
| RANTES | 108.20 (65.40) | 121.16 (74.33) | −0.03 | 0.15 | 0.18 | 105.01 (64.79) | 105.55 (77.47) | −0.08 | −0.07 | 0.01 |
| IL-4 | 30.90 (15.98) | 34.20 (21.24) | −0.01 | 0.16 | 0.17 | 31.57 (18.12) | 27.68 (20.11) | 0.03 | −0.18 | −0.20 |
| IFN-γ | 459.13 (302.11) | 523.13 (409.56) | −0.03 | 0.14 | 0.17 | 469.12 (336.00) | 430.55 (414.31) | −0.01 | −0.11 | −0.10 |
| IL-2 | 63.23 (36.69) | 70.99 (50.73) | −0.03 | 0.14 | 0.17 | 65.79 (43.25) | 57.99 (48.68) | 0.03 | −0.14 | −0.17 |
| IL-5 | 8.56 (7.37) | 9.76 (8.66) | −0.03 | 0.12 | 0.15 | 8.74 (8.03) | 8.09 (8.47) | −0.01 | −0.09 | −0.08 |
| IP-10 | 16,178.8 (18,535.2) | 17,740.3 (10,749.0) | 0.04 | 0.17 | 0.13 | 12,080.6 (7,032.0) | 15,900.5 (10,005.1) | −0.31 | 0.01 | 0.32 |
ES, effect size, cytokine levels in pg/mL (±standard deviation). FGF-basic and MIP-1β are not included because of low detection rate among patients.
Both NS and WO tears show a significant difference between normal and AD group.
P values from both Kruskal–Wallis and Satterthwaite t-tests < 0.05.
P value from Satterthwaite t-test for mean differences adjusting for unequal variances < 0.05.
P value from Kruskal–Wallis nonparametric test for distributional differences < 0.05.
| Only NS tears show a significant difference between normal and AD group.
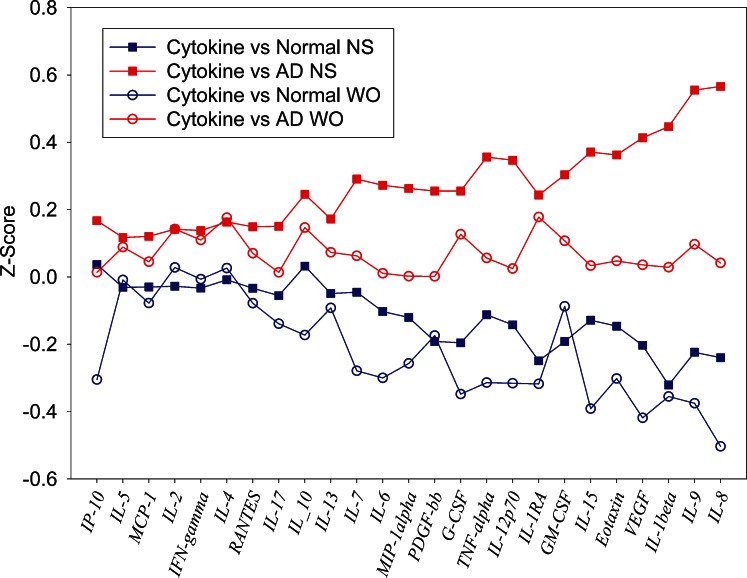
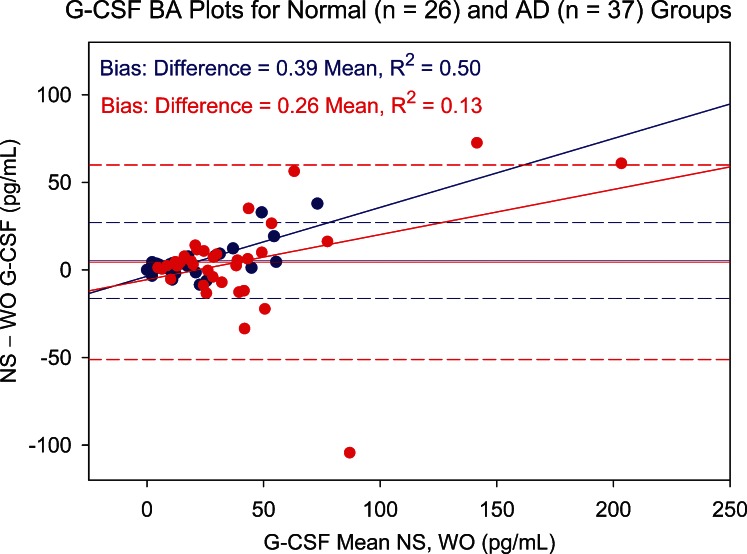
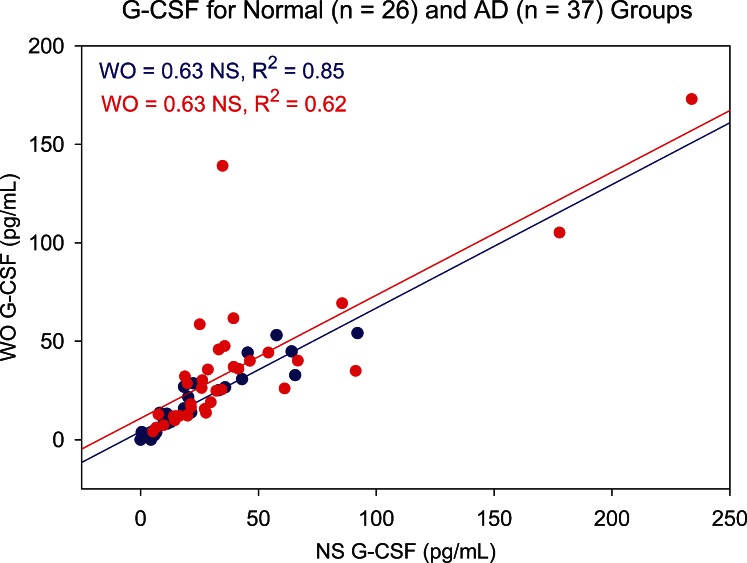
Figure 7 is a standardized cytokine profile plot comparing the average standardized cytokine levels in NS and WO assays for non-AD and AD patients. IL-8 and IL-1β elicited the most clear-cut differences between non-AD and AD group means. NS IL-8 Z scores show a standardized mean difference effect size of 0.80. This consists of a mean non-AD NS level 0.24 standard deviations below and a mean AD NS level 0.57 standard deviations above the combined NS and WO IL-8 mean (Table 3). For the WO IL-8 assay, the lower mean difference of 0.54 (mainly due to a non-AD mean 0.50 standard deviations below mean) indicates that non-AD versus AD differences were detected, but with lower statistical power. A similar pattern is evident for IL-1β, NS tears producing an effect size for distinguishing AD from normal patients roughly twice that of WO tears. For both cytokines, the loss of information in WO tears is attributable primarily to the AD group. This same pattern for effect size and loss of power in WO tears is seen with VEGF. For IL-1RA and G-CSF, effect sizes are similar for NS and WO tears, and the effects are relatively evenly distributed between non-AD and AD groups. Significant Bland–Altman plot slopes for G-CSF (Fig. 8) illustrate that variances differ between sample types. However, the correlation between the NS and WO assays is strong, especially in the non-AD group (Fig. 9).
Figure 7. .
Tear data for each cytokine and collection method are standardized to have a mean of 0 and standard deviation of 1. This allows an equivalent determination across all cytokines of the ability to differentiate AD patients from non-AD using NS tear samples (filled symbols) and WO samples (open symbols). Cytokines are ordered on the x-axis by Z score difference between AD NS and normal NS tear samples.
Figure 8. .
Bland–Altman (BA) plot showing NS versus WO tear levels of G-CSF for normal (blue circles) and aqueous-deficient (AD, red circles) patient groups. Difference between NS and WO tear G-CSF levels is plotted against mean level for paired tear samples. Slope of the BA plot is positive for both groups, showing an increasing difference with increasing mean. Dashed lines represent 95% confidence limits.
Figure 9. .
Scatter plot showing correlation between NS and WO tear levels of G-CSF for normal (blue circles) and aqueous-deficient (AD, red circles) patient groups. Slope of the linear regression line shows that WO tear G-CSF levels averaged 63% of NS levels for both groups, correlation coefficients both being significant (P < 0.001).
Five cytokines showed significant non-AD versus AD group differences in NS tears only: IL-9, eotaxin, IL-15, GM-CSF, and IL-12p70. IL-9 and IL-15 also elicited significant Bland–Altman plot slope bias for the overall NS versus WO comparisons (Table 2). For IL-9, despite a large effect size of 0.78 for the ability of NS tears to differentiate non-AD from AD, WO tears did not differentiate the groups (effect size, 0.28). The loss of information is attributable primarily to AD group WO tears (Fig. 7), as is also the case for WO tear eotaxin, IL-15, and IL-12p70. Because NS and WO non-AD means are very similar for these cytokines, a “ceiling effect” is probably preventing AD group WO levels from reaching sufficient magnitude to demonstrate statistical power.
At the low end of the scale for ability to discriminate AD from non-AD patients, NS and WO tear levels of IL-4, IFN-γ, IL-2, IL-5, and IP-10 showed minimal effect sizes and were clearly unable to discriminate between non-AD and AD groups (Table 3). However, Table 2 indicates a strong correlation between the NS and WO assays and little Bland–Altman bias. Figure 7 and Table 3 confirm that these cytokines can be effectively measured by both NS and WO methods, but it happens that neither tear type can distinguish between non-AD and AD patients.
Relationship Between Schirmer Score and Tear Cytokine Levels
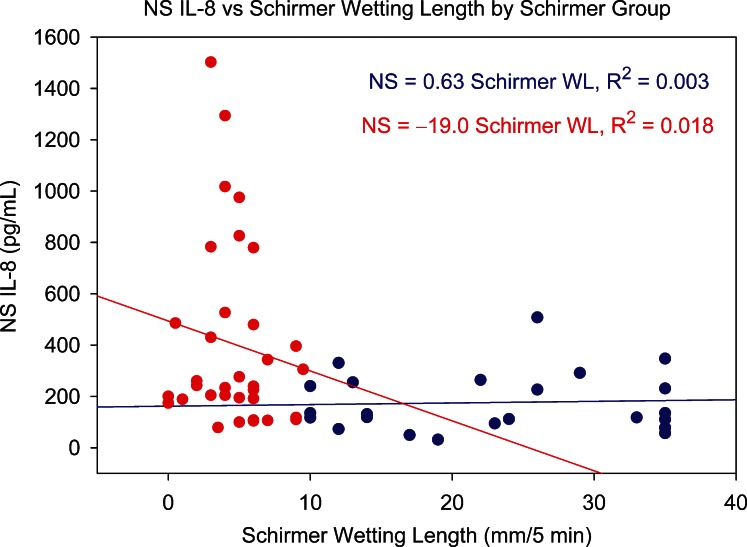
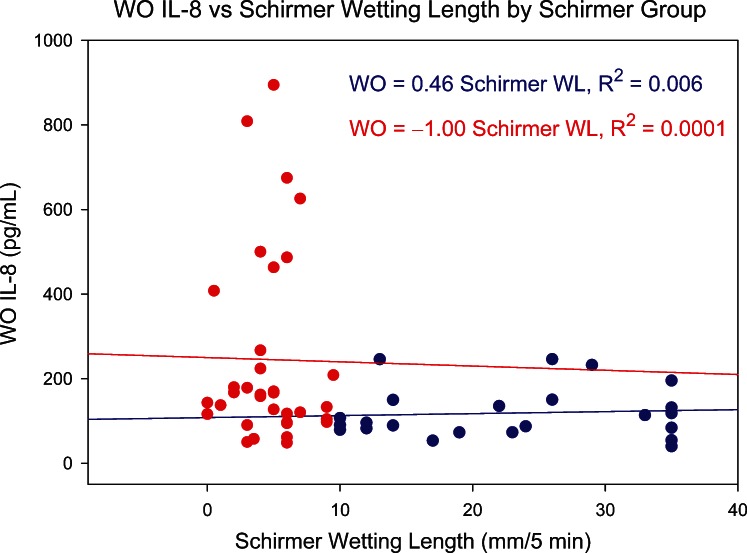
Of the 27 studied tear cytokines, IL-8 is one of the most strongly skewed toward ocular surface sources, and its level decreases significantly with tear flow rate.19 It should therefore reveal any influence of Schirmer score and tear collection rate on tear cytokine levels. Figures 10 and 11 show the relationship between NS and WO tear IL-8, respectively, and Schirmer test results. For both sample types, there is no trend within AD or non-AD groups, suggesting that tear collection rate was not a simple determinant of tear IL-8 levels.
Figure 10. .
Relationship between NS tear IL-8 level and Schirmer test score (5-minute wetting length) for normal group (blue circles) and AD group (red circles). WL, wetting length.
Figure 11. .
Relationship between WO tear IL-8 level and Schirmer test score (5-minute wetting length) for normal group (blue circles) and AD group (red circles). WL, wetting length.
Age Effects
While some age effects were found in the ANCOVA model, existing significant differences between non-AD and AD groups remained after factoring out age effects in all cases.
Discussion
For the overall patient group, WO tears can reasonably be used as a surrogate measure of NS tears for 16 of the 25 consistently detected tear cytokines: IL-1RA, eotaxin, GM-CSF, IL-12p70, Monocyte chemoattractant protein 1 (MCP-1), TNF-α, Platelet-derived growth factor-bb (PDGF-bb), MIP-1α, IL-13, IL-10, IL-17, Regulated on Activation, Normal T cell Expressed (RANTES), IL-4, IFN-γ, IL-2, and IL-5. These are the cytokines lacking significant Bland–Altman plot bias in NS versus WO comparisons. The pattern of significantly higher cytokine levels in NS samples relative to WO in these cases indicates that WO tears are measuring a lower mean value. For many cytokines, WO variances were also suppressed, especially for AD patients. Therefore, substantially elevated NS tear cytokine levels may not be accurately reflected in WO tears. Although the extreme (highest) levels found in NS tears may be suppressed in WO tears, WO samples are effectively estimating similar levels but with less statistical accuracy and precision.
Clinical profiles of non-AD and AD groups in the current study highlight the expected heterogeneity when patients are classified based on Schirmer score—in particular the higher 10 mm/5 min cutoff. Osmolarity was not substantially higher in the Schirmer-defined AD group. This is consistent with the findings of Sullivan et al. indicating that of all common clinical test results, Schirmer score shows the poorest correlation with tear osmolarity.18 Comparing tear collection methods, the WO method replicates the ability of NS collection to differentiate key cytokines between normal and AD groups. However, relative to NS tears, WO cytokine levels show less group (AD versus non-AD) separation in terms of central tendency (i.e., means, medians) and effect size. Some of the more subtle group (AD versus non-AD) cytokine level differences detected in NS tears are therefore obscured in WO tears. Interestingly, IL-1β, present at <10 pg/mL in NS tears, continues to differentiate AD patients from non-AD in WO samples, indicating the potential of the WO approach for key low-abundance biomarkers.
The cytokines that best discriminated between AD and non-AD groups in both tear types were IL-8, IL-1β, VEGF, IL-1RA, and G-CSF, AD group means being significantly higher in all cases. All five cytokines have been linked to AD dry eye in numerous other studies,7,22–30 IL-822–26 and IL-1β7,27–30 in particular. This group of cytokines demonstrates the potential of the WO method to detect AD dry eye without the need to corroborate findings by collecting NS tears.
Weaker discriminatory power of WO tears was found for IL-9, IL-12p70, IL-15, eotaxin, GM-CSF, and MCP-1, all being significantly elevated in NS tears of the AD group relative to non-AD, but not in WO tears. None are widely reported dry eye markers, so the implications of NS tear elevation are less compelling.22,30–39 IL-931,32 and eotaxin36,37 are more commonly associated with allergy than with dry eye.
Just as this study found AD group NS tear elevations of some cytokines not widely confirmed to be elevated in dry eye, other cytokines, reported in the literature to be dry eye biomarkers, did not show significant intergroup differences with either tear type in the current study. Of particular note, these cytokines include IL-623,40 and TNF-α,23,41 both often reported as elevated in dry eye. This indicates that the bead-based assay or the grouping criterion used to differentiate between non-AD and AD patients is the cause, not the WO method per se.
Washout tear sampling methods have been employed by other groups, most using larger WO volumes and targeting more abundant tear proteins. An early study reported similarities between NS and WO tears by qualitative gel electrophoresis but without specific protein identification.11 Argueso et al.42 used a 60 μL WO method to compare Sjögren's syndrome patients with controls. Collected volume did not correlate with total tear protein. WO tear Mucin 5AC (MUC5AC) level and conjunctival MUC5AC expression were both decreased in Sjögren's patients. In a related study, WO tear lipocalin–total protein ratio was significantly decreased in Sjögren's dry eye relative to non-Sjögren's dry eye and controls whereas lysozyme was not.43 In a validation study using 60 μL WO, Markoulli et al.44 found a >5-fold increase over NS tear collection rate but only 50% reduction in total protein. IgA/total protein did not decrease in WO tears relative to NS,3 leading to the conclusion that there was minimum reflex tear contamination in WO tears. This was confirmed in a 10 μL WO study12 of tear Matrix metalloproteinase 9 (MMP-9) in cats, IgA/total protein again remaining constant. Interestingly, WO tears revealed a reduction in MMP-9 levels between day 1 and day 7, while NS tear levels were unchanged.
Other studies compared yawn-induced reflex tears with 18 μL WO samples and found greater day-to-day12 and diurnal45 variation in major proteins in WO versus reflex samples. Smith et al.46 used a 20 μL WO method to measure doxycycline effects on tear MMP in rosacea- or meibomian gland disease–related dry eye, and found indications of a reduction in MMP-9.
In summary, addition of 10 μL sterile saline to the eye prior to microcapillary tear collection produces a biomarker profile that is consistent with NS tears for 16 of 25 cytokines. The technique also elicits the same key differences between non-AD and AD patients as NS tears, all being significantly higher in AD patients. More subtle biomarker differences between AD and non-AD patients that are detectable in NS tears are lost in WO samples. The diluting effect of the WO solution condenses the higher NS values in particular, decreasing between-group discriminatory power. Therefore, for an array of lower-abundance biomarkers, and when NS micropipette collection is impractical, the WO method may be a suitable alternative to Schirmer collection or other more invasive and less controlled sampling procedures. Further investigation of the WO technique will determine if it can elicit more comprehensive biomarker differences between specific patient groups.
Acknowledgments
Supported by Eyesight Foundation of Alabama Grant 2008396 (RF) and National Institutes of Health (NIH) Grant P30 EY003039 (Steven Pittler).
Disclosure: N. Guyette, None; L. Williams, None; M.-T. Tran, None; T. Than, None; J. Bradley, None; L. Kehinde, None; C. Edwards, None; M. Beasley, None; R. Fullard, None
References
- 1. Research in dry eye: report of the Research Subcommittee of the International Dry Eye WorkShop ( 2007). Ocul Surf. 2007; 5: 179–193 [DOI] [PubMed] [Google Scholar]
- 2. Fullard RJ, Snyder C. Protein levels in nonstimulated and stimulated tears of normal human subjects. Invest Ophthalmol Vis Sci. 1990; 31: 1119–1126 [PubMed] [Google Scholar]
- 3. Fullard RJ, Tucker D. Tear protein composition and the effects of stimulus. Adv Exp Med Biol. 1994; 350: 309–314 [DOI] [PubMed] [Google Scholar]
- 4. Fullard RJ, Tucker DL. Changes in human tear protein levels with progressively increasing stimulus. Invest Ophthalmol Vis Sci. 1991; 32: 2290–2301 [PubMed] [Google Scholar]
- 5. Fullard RJ. Identification of proteins in small tear volumes with and without size exclusion HPLC fractionation. Curr Eye Res. 1988; 7: 163–179 [DOI] [PubMed] [Google Scholar]
- 6. VanDerMeid KR, Su SP, Krenzer KL, Ward KW, Zhang JZ. A method to extract cytokines and matrix metalloproteinases from Schirmer strips and analyze using Luminex. Mol Vis. 2011; 17: 1056–1063 [PMC free article] [PubMed] [Google Scholar]
- 7. Solomon A, Dursun D, Liu Z, Xie Y, Macri A, Pflugfelder SC. Pro- and anti-inflammatory forms of interleukin-1 in the tear fluid and conjunctiva of patients with dry-eye disease. Invest Ophthalmol Vis Sci. 2001; 42: 2283–2292 [PubMed] [Google Scholar]
- 8. Lopez-Cisternas J, Castillo-Diaz J, Traipe-Castro L, Lopez-Solis RO. Use of polyurethane minisponges to collect human tear fluid. Cornea. 2006; 25: 312–318 [DOI] [PubMed] [Google Scholar]
- 9. Choy CK, Cho P, Chung WY, Benzie IF. Water-soluble antioxidants in human tears: effect of the collection method. Invest Ophthalmol Vis Sci. 2001; 42: 3130–3134 [PubMed] [Google Scholar]
- 10. Green-Church KB, Nichols KK, Kleinholz NM, Zhang L, Nichols JJ. Investigation of the human tear film proteome using multiple proteomic approaches. Mol Vis. 2008; 14: 456–470 [PMC free article] [PubMed] [Google Scholar]
- 11. Bjerrum KB, Prause JU. Collection and concentration of tear proteins studied by SDS gel electrophoresis. Presentation of a new method with special reference to dry eye patients. Graefes Arch Clin Exp Ophthalmol. 1994; 232: 402–405 [DOI] [PubMed] [Google Scholar]
- 12. Petznick A, Evans MD, Madigan MC, Markoulli M, Garrett Q, Sweeney DF. A comparison of basal and eye-flush tears for the analysis of cat tear proteins. Acta Ophthalmol. 2011; 89: e75–e81 [DOI] [PubMed] [Google Scholar]
- 13. Markoulli M, Papas E, Petznick A, Holden B. Validation of the flush method as an alternative to basal or reflex tear collection. Curr Eye Res. 2011; 36: 198–207 [DOI] [PubMed] [Google Scholar]
- 14. Senchyna M, Wax MB. Quantitative assessment of tear production: a review of methods and utility in dry eye drug discovery. J Ocul Biology Dis Infor. 2008; 1: 1–6 [DOI] [PMC free article] [PubMed] [Google Scholar]
- 15. Lucca JA, Nunez JN, Farris RL. A comparison of diagnostic tests for keratoconjunctivitis sicca: lactoplate, Schirmer, and tear osmolarity. CLAO J. 1990; 16: 109–112 [PubMed] [Google Scholar]
- 16. Vitali C, Moutsopoulos HM, Bombardieri S. The European Community Study Group on diagnostic criteria for Sjogren's syndrome. Sensitivity and specificity of tests for ocular and oral involvement in Sjogren's syndrome. Ann Rheum Dis. 1994; 53: 637–647 [DOI] [PMC free article] [PubMed] [Google Scholar]
- 17. Methodologies to diagnose and monitor dry eye disease: report of the Diagnostic Methodology Subcommittee of the International Dry Eye WorkShop (2007). Ocul Surf. 2007; 5: 108–152 [DOI] [PubMed] [Google Scholar]
- 18. Sullivan BD, Whitmer D, Nichols KK, et al. An objective approach to dry eye disease severity. Invest Ophthalmol Vis Sci. 2010; 51: 6125–6130 [DOI] [PubMed] [Google Scholar]
- 19. LaFrance MW, Kehinde LE, Fullard RJ. Multiple cytokine analysis in human tears: an optimized procedure for cytometric bead-based assay. Curr Eye Res. 2008; 33: 525–544 [DOI] [PubMed] [Google Scholar]
- 20. Bland JM, Altman DG. Statistical methods for assessing agreement between two methods of clinical measurement. Lancet. 1986; 1: 307–310 [PubMed] [Google Scholar]
- 21. Myles PS, Cui J. Using the Bland-Altman method to measure agreement with repeated measures. Br J Anaesth. 2007; 99: 309–311 [DOI] [PubMed] [Google Scholar]
- 22. Lam H, Bleiden L, de Paiva CS, Farley W, Stern ME, Pflugfelder SC. Tear cytokine profiles in dysfunctional tear syndrome. Am J Ophthalmol. 2009; 147: 198–205, e191 [DOI] [PMC free article] [PubMed] [Google Scholar]
- 23. Massingale ML, Li X, Vallabhajosyula M, Chen D, Wei Y, Asbell PA. Analysis of inflammatory cytokines in the tears of dry eye patients. Cornea. 2009; 28: 1023–1027 [DOI] [PubMed] [Google Scholar]
- 24. Grus FH, Dick B, Augustin AJ, Pfeiffer N. Analysis of the antibody repertoire in tears of dry-eye patients. Ophthalmologica. 2001; 215: 430–434 [DOI] [PubMed] [Google Scholar]
- 25. Huang JF, Zhang Y, Rittenhouse KD, Pickering EH, McDowell MT. Evaluations of tear protein markers in dry eye disease: repeatability of measurement and correlation with disease. Invest Ophthalmol Vis Sci. 2012; 53: 4556–4564 [DOI] [PubMed] [Google Scholar]
- 26. Byun YJ, Kim TI, Kwon SM, et al. Efficacy of combined 0.05% cyclosporine and 1% methylprednisolone treatment for chronic dry eye. Cornea. 2012; 31: 509–513 [DOI] [PubMed] [Google Scholar]
- 27. Zoukhri D, Ko S, Stark PC, Kublin CL. Roles of caspase 1 and extracellular signal-regulated kinase in inflammation-induced inhibition of lacrimal gland protein secretion. Invest Ophthalmol Vis Sci. 2008; 49: 4392–4398 [DOI] [PMC free article] [PubMed] [Google Scholar]
- 28. Boehm N, Riechardt AI, Wiegand M, Pfeiffer N, Grus FH. Proinflammatory cytokine profiling of tears from dry eye patients by means of antibody microarrays. Invest Ophthalmol Vis Sci. 2011; 52: 7725–7730 [DOI] [PubMed] [Google Scholar]
- 29. VanDerMeid KR, Su SP, Ward KW, Zhang JZ. Correlation of tear inflammatory cytokines and matrix metalloproteinases with four dry eye diagnostic tests. Invest Ophthalmol Vis Sci. 2012; 53: 1512–1518 [DOI] [PubMed] [Google Scholar]
- 30. Na K-S, Mok J-W, Kim JY, Rho CR, Joo C-K. Correlations between tear cytokines, chemokines, and soluble receptors and clinical severity of dry eye disease. Invest Ophthalmol Vis Sci. 2012; 53: 5443–5450 [DOI] [PubMed] [Google Scholar]
- 31. Noelle RJ, Nowak EC. Cellular sources and immune functions of interleukin-9. Nat Rev Immunol. 2010; 10: 683–687 [DOI] [PMC free article] [PubMed] [Google Scholar]
- 32. Kearley J, Erjefalt JS, Andersson C, et al. IL-9 governs allergen-induced mast cell numbers in the lung and chronic remodeling of the airways. Am J Respir Crit Care Med. 2011; 183: 865–875 [DOI] [PMC free article] [PubMed] [Google Scholar]
- 33. Watford WT, Moriguchi M, Morinobu A, O'Shea JJ. The biology of IL-12: coordinating innate and adaptive immune responses. Cytokine Growth Factor Rev. 2003; 14: 361–368 [DOI] [PubMed] [Google Scholar]
- 34. Javadi MA, Feizi S. Dry eye syndrome. J Ophthalmic Vis Res. 2011; 6: 192–198 [PMC free article] [PubMed] [Google Scholar]
- 35. El Annan J, Chauhan SK, Ecoiffier T, Zhang Q, Saban DR, Dana R. Characterization of effector T cells in dry eye disease. Invest Ophthalmol Vis Sci. 2009; 50: 3802–3807 [DOI] [PMC free article] [PubMed] [Google Scholar]
- 36. Leonardi A, Jose PJ, Zhan H, Calder VL. Tear and mucus eotaxin-1 and eotaxin-2 in allergic keratoconjunctivitis. Ophthalmology. 2003; 110: 487–492 [DOI] [PubMed] [Google Scholar]
- 37. Yoon KC, De Paiva CS, Qi H, et al. Expression of Th-1 chemokines and chemokine receptors on the ocular surface of C57BL/6 mice: effects of desiccating stress. Invest Ophthalmol Vis Sci. 2007; 48: 2561–2569 [DOI] [PubMed] [Google Scholar]
- 38. Cavet ME, Harrington KL, Ward KW, Zhang JZ. Mapracorat, a novel selective glucocorticoid receptor agonist, inhibits hyperosmolar-induced cytokine release and MAPK pathways in human corneal epithelial cells. Mol Vis. 2010; 16: 1791–1800 [PMC free article] [PubMed] [Google Scholar]
- 39. Goyal S, Chauhan SK, Zhang Q, Dana R. Amelioration of murine dry eye disease by topical antagonist to chemokine receptor 2. Arch Ophthalmol. 2009; 127: 882–887 [DOI] [PubMed] [Google Scholar]
- 40. Yoon KC, Jeong IY, Park YG, Yang SY. Interleukin-6 and tumor necrosis factor-alpha levels in tears of patients with dry eye syndrome. Cornea. 2007; 26: 431–437 [DOI] [PubMed] [Google Scholar]
- 41. Luo L, Li DQ, Doshi A, Farley W, Corrales RM, Pflugfelder SC. Experimental dry eye stimulates production of inflammatory cytokines and MMP-9 and activates MAPK signaling pathways on the ocular surface. Invest Ophthalmol Vis Sci. 2004; 45: 4293–4301 [DOI] [PubMed] [Google Scholar]
- 42. Argueso P, Balaram M, Spurr-Michaud S, Keutmann HT, Dana MR, Gipson IK. Decreased levels of the goblet cell mucin MUC5AC in tears of patients with Sjogren syndrome. Invest Ophthalmol Vis Sci. 2002; 43: 1004–1011 [PubMed] [Google Scholar]
- 43. Caffery B, Joyce E, Boone A, et al. Tear lipocalin and lysozyme in Sjogren and non-Sjogren dry eye. Optom Vis Sci. 2008; 85: 661–667 [DOI] [PubMed] [Google Scholar]
- 44. Markoulli M, Papas E, Cole N, Holden BA. The diurnal variation of matrix metalloproteinase-9 and its associated factors in human tears. Invest Ophthalmol Vis Sci. 2012; 53: 1479–1484 [DOI] [PubMed] [Google Scholar]
- 45. Ng V, Cho P, Wong F, Chan Y. Variability of tear protein levels in normal young adults: diurnal (daytime) variation. Graefes Arch Clin Exp Ophthalmol. 2001; 239: 257–263 [DOI] [PubMed] [Google Scholar]
- 46. Smith VA, Khan-Lim D, Anderson L, Cook SD, Dick AD. Does orally administered doxycycline reach the tear film? Br J Ophthalmol. 2008; 92: 856–859 [DOI] [PubMed] [Google Scholar]


