Abstract
Activation of TLR9 by direct injection of unmethylated CpG nucleotides into a tumor can induce a therapeutic immune response; however, Tregs eventually inhibit the antitumor immune response and thereby limit the power of cancer immunotherapies. In tumor-bearing mice, we found that Tregs within the tumor preferentially express the cell surface markers CTLA-4 and OX40. We show that intratumoral coinjection of anti–CTLA-4 and anti-OX40 together with CpG depleted tumor-infiltrating Tregs. This in situ immunomodulation, which was performed with low doses of antibodies in a single tumor, generated a systemic antitumor immune response that eradicated disseminated disease in mice. Further, this treatment modality was effective against established CNS lymphoma with leptomeningeal metastases, sites that are usually considered to be tumor cell sanctuaries in the context of conventional systemic therapy. These results demonstrate that antitumor immune effectors elicited by local immunomodulation can eradicate tumor cells at distant sites. We propose that, rather than using mAbs to target cancer cells systemically, mAbs could be used to target the tumor infiltrative immune cells locally, thereby eliciting a systemic immune response.
Introduction
Stimulation of antigen-presenting cells by TLR9 agonists enhances the uptake and presentation of antigens to the immune system. Injections of CpG oligonucleotide, a TLR9 agonist, directly into tumors, can trigger an antitumor immune response (1, 2). However, there are many factors that cause the immune system to ignore cancer cells (3). Chief among these is a subset of lymphocytes called Tregs that play a central role in maintaining immunologic tolerance to normal tissues (4, 5). Typically, Tregs infiltrate tumors along with the other immune cells, and their proportion has been correlated with poor survival of patients (6). Tregs are identified by the expression of a characteristic transcription factor called foxp3 (7). They exert their immunosuppressive effects both by direct interaction with cells through expression of surface molecules such as CTLA-4 (8) and by secretion of cytokines (IL-10, TGF-β) (4). A mAb against CTLA-4 has recently been shown to improve the survival of patients with metastatic melanoma (9). The approvals of this antibody by the FDA and EMA inaugurate a new way of treating cancer, whereby the target is the immune system rather than the cancer cell itself (10). At the present time, it is not clear whether the antitumor effects of anti–CTLA-4 (αCTLA4) antibodies are due to their blockade of a negative regulatory signal in T effector cells (Teffs) or to their interference with Treg function (11). Also, it is not clear which immune response they are enhancing, as αCTLA4 therapy is accompanied by autoimmune side effects, such as colitis, hepatitis, and hypophysitis (12). One challenge, therefore, is to find better ways to improve the clinical benefits of these immunomodulatory therapies while avoiding their untoward autoimmune effects.
Here we show that tumor-specific Tregs residing at the tumor site can be identified by the expression of CTLA-4 and OX40 molecules on their surface. Moreover, we show that immunomodulation of these Tregs at a single tumor is sufficient to trigger a systemic antitumor immune response and cure mice with disseminated tumors, including sites within the CNS.
Results
Tumor resident Tregs express high levels of OX40 and CTLA-4.
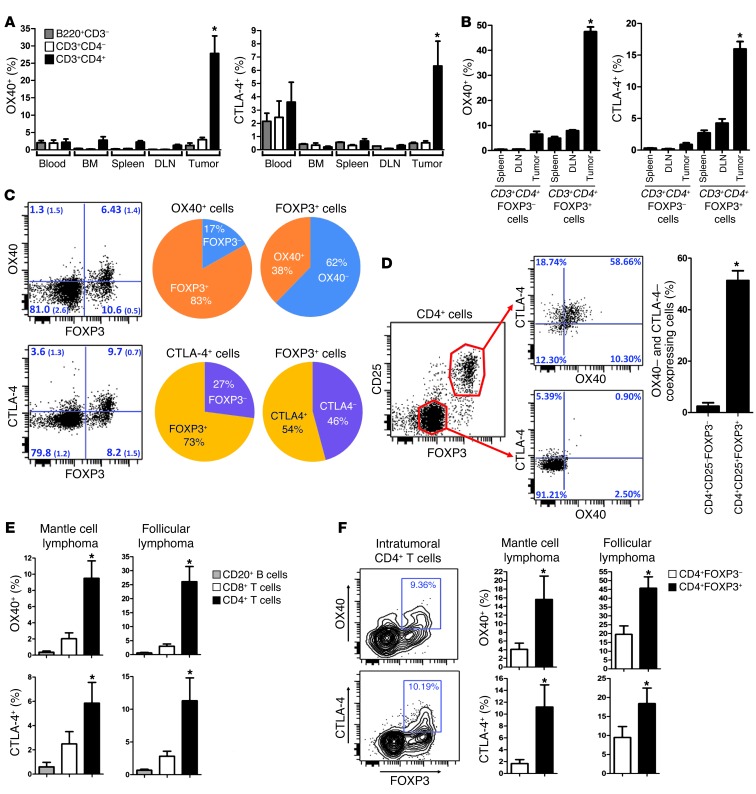
We examined OX40 and CTLA-4 expression on T cells at several sites in tumor-bearing mice. Interestingly, we found that the highest proportions of OX40– and CTLA-4–expressing T cells were found at the tumor sites and were within the CD4 subset (Figure 1A). More specifically, these markers were mainly expressed on CD4+FOXP3+ Tregs (Figure 1B). Indeed, within the CD4+ cells at the tumor sites, the vast majority of OX40+ and CTLA-4+ cells were FOXP3+ (Figure 1C). Conversely, about 40% to 50% of FOXP3+ cells at the tumor sites expressed OX40 and CTLA-4 (Figure 1C), and they were coexpressed mostly at the surface of the same Tregs (Figure 1D). This pattern of expression was also observed in humans; in samples from patients with mantle cell lymphoma and follicular lymphoma, we confirmed that the highest proportions of OX40– and CTLA-4–expressing T cells were found within intratumoral (i.t.) CD4+ T cells (Figure 1E) and, more specifically, on i.t. CD4+FOXP3+ cells (Figure 1F).
Figure 1. OX40 and CTLA-4 are highly expressed at the tumor site.
(A) Surface expression of OX40 and CTLA-4 on T and B cells (mean ± SEM) in tumor-bearing mice (n = 3) challenged with 5 × 10⁶ A20 lymphoma tumor cells s.c. On day 7, cells from blood, bone marrow, spleen, draining lymph nodes (DLN), and tumors were analyzed by flow cytometry. Proportions of OX40- and CTLA-4–positive cells within B220+CD3– (B cells), CD3+CD4–, and CD3+CD4+ (T cells) are plotted (isotype background ~0.5%). The proportion of positive cells in i.t. CD4+ T cells was significantly higher (*P < 0.05) than in any other site or cell subset, except for the expression of CTLA-4 in blood cells. (B–F) Surface expression of OX40 and CTLA-4 (mean ± SEM) (B) within FOXP3+ and FOXP3– CD3+CD4+ T cells collected from tumors, draining lymph nodes, and spleens of mice bearing tumors established for 7 days (FACS analysis, n = 5; *P < 0.001); (C) within CD3+CD4+ T cells collected from tumors (quadrant values are mean percentages (± SEM) obtained from 3 tumor-bearing mice); (D) on i.t. Tregs (n = 3, *P = 0.003); (E) within tumor-infiltrating lymphocytes of patients with mantle cell lymphoma (n = 5) and follicular lymphoma (n = 9) tumors (FACS analysis; *P < 0.05); and (F) within tumor-infiltrating CD4+ T cells of human mantle cell lymphoma (n = 5) and follicular lymphoma (n = 9) tumors (FACS analysis; *P < 0.05).
OX40+ and CTLA-4+ tumor resident Tregs are specific for tumor antigens.
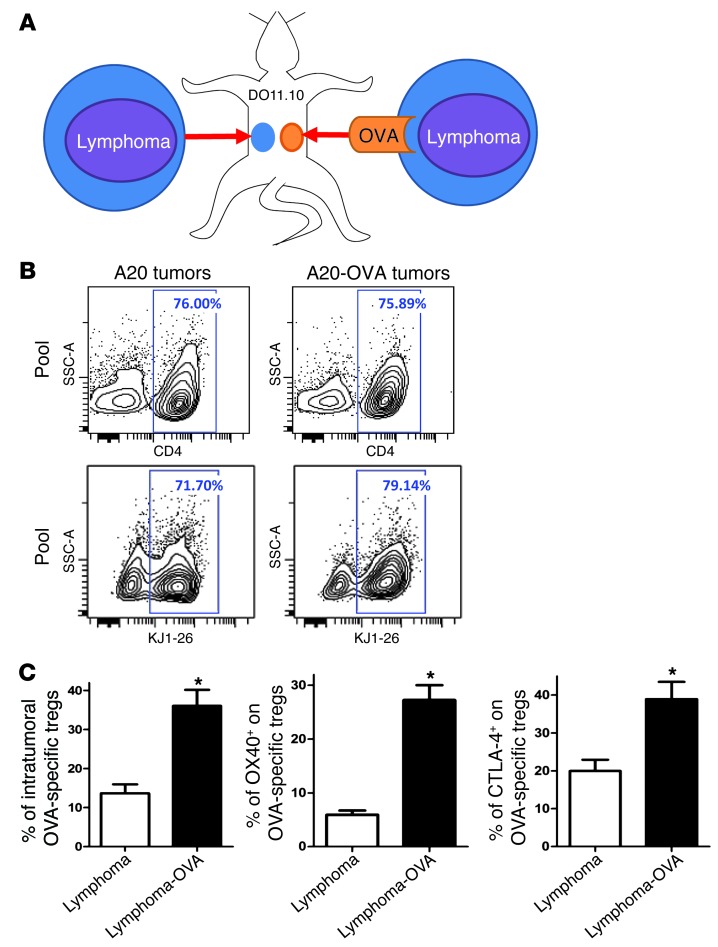
To investigate whether the expression of OX40 and CTLA-4 was induced nonspecifically in the tumor microenvironment or in response to cognate recognition of tumor antigen, we used A20 lymphoma cells expressing ovalbumin (A20-OVA cells). These tumor cells were injected into DO11.10 mice (expressing a CD4+ transgenic TCR specific for the OVA peptide). For comparison, a second tumor line not expressing the cognate antigen (A20 lymphoma tumor cells) was injected into a separate site in the same mice (Figure 2A). By day 10, OVA-specific CD4+ T cells were recruited equally to both the A20 and the A20-OVA tumor sites (detected by the anti-clonotypic KJ1-26 mAb) (Figure 2B). However, the proportion of OVA-specific Tregs was dramatically higher in the OVA-expressing tumors than in the tumors not expressing OVA (Figure 2C). These Tregs specifically expressed high levels of OX40 and CTLA-4 in comparison to the ones in tumors not expressing OVA (Figure 2C).
Figure 2. OX40 and CTLA-4 are highly expressed at the tumor site, especially by tumor-specific Tregs.
(A) DO11.10 mice were transplanted s.c. with A20 lymphoma tumor cells at one site and with A20-OVA at another (5 × 10⁶ cells per site). About 70% of CD4+ T cells from DO11.10 mice are directed against the OVA peptide. They can be identified by the KJ1-26 clonotypic mAb, which specifically binds their OVA-specific TCR. (B) 10 days after challenge, tumors were collected and tumor-infiltrating OVA-specific T cells (KJ1-26+) were analyzed by FACS (pool of tumors from 5 mice). (C) The proportion of FOXP3+ cells within the OVA-specific CD4+ T cells (gated on KJ1-26+) and the proportion of expression of OX40 and CTLA-4 within the OVA-specific Tregs (gated on CD4+KJ1-26+FOXP3+) (mean ± SEM, n = 5, *P < 0.05).
Local Treg immunomodulation generates systemic antitumor immune response.
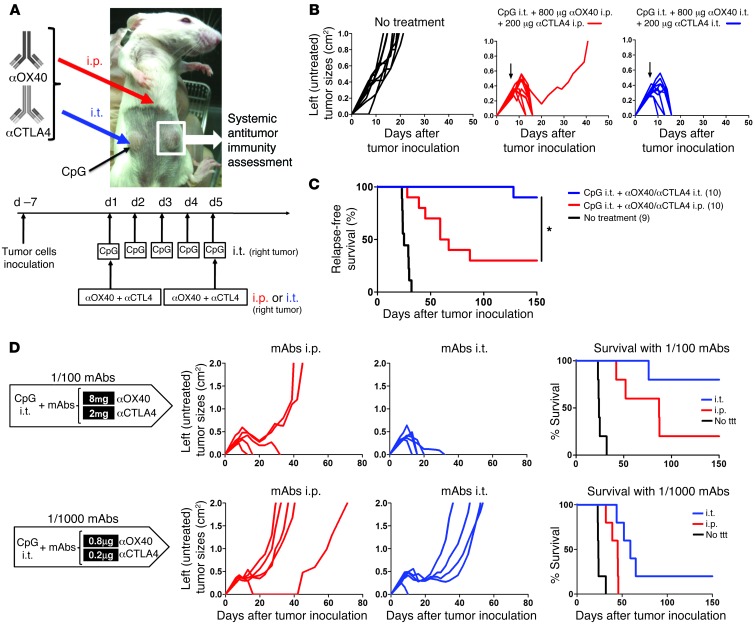
i.t. injections of CpG, a TLR9 agonist, generate some antitumor immunity both in mice and in humans (1, 2, 13). Because OX40 and CTLA-4 are mainly expressed by i.t. Tregs, as opposed to T cells in other physiological sites, we reasoned that antibodies against these targets could be more effective when injected into the local tumor site to enhance an antitumor immune response generated by CpG. To test this hypothesis, the same lymphoma tumor line was injected at 2 s.c. sites on opposite sides of the animals, with one (right) used as a site of in situ immunomodulation (i.e., i.t. injections of CpG) and the other (left) observed to assess the systemic antitumor immune response. The 2 antibodies were either injected into the right tumor (together with the CpG) or were injected systemically (Figure 3A). The immediate antitumor effect on the distant s.c. tumors was equivalent for both local and systemic regimens (Figure 3B). However, only the local immunomodulation conferred long-term protection and cure of the animals, whereas the systemically treated mice presented late relapses in the tumor-draining lymph nodes (Figure 3C).
Figure 3. Local immunomodulation does better than systemic immunomodulation for the efficacy of antitumor immune responses.
(A) Mice were challenged s.c. with 5 × 10⁶ A20 tumor cells on the right and left flanks. Therapy was started when tumors reached 0.5–0.7 cm in diameter (usually between day 5 and 8). Treated mice received CpG i.t. only in their right tumor for 5 consecutive days. On day 1 and 5 of CpG therapy, αOX40 and αCTLA4 mAbs were either injected i.p. or i.t. (together with CpG in the right tumor). The systemic antitumor immune response generated by these systemic (i.p.) and local (i.t.) maneuvers was assessed by measuring the size of the contralateral (noninjected) left tumor and mouse disease-free survival. Results were pooled from 2 distinct experiments (n = 10 mice per group). (B) Tumor growth of the distant tumors (nontreated left tumors) when mAbs were injected systemically (i.p.) or locally (i.t. into the right tumor). Black arrows indicate day 1 of therapy. Both strategies (mAbs injected i.p. or i.t.) result in disappearance of the distant (left) tumors. (C) Relapse-free survival of mice treated with either local or systemic immunomodulation. Most of the mice treated systemically (i.p.) with αOX40/CTLA4 relapsed in the left tumor-draining lymph nodes, whereas almost all the mice who received αOX40 and αCTLA4 locally (i.t.) had a long-term survival (*P = 0.002). The number of mice per group is shown into parenthesis. (D) Therapeutic efficacy of 1:100 and 1:1,000 doses of αOX40 and αCTLA4 either injected i.p. or i.t. together with CpG and the resulting long-term disease-free survival. ttt, treatment.
Low doses of immunomodulatory antibodies are sufficient if injected locally.
Because i.t. OX40 and CTLA-4 targeting seemed especially effective, we reasoned that lower amounts of the immunomodulatory antibodies injected locally would suffice. We found that anti-OX40 (αOX40) and αCTLA4 antibodies could trigger a curative immune response when injected locally at doses as low as 100-fold less than those needed to trigger a similar response by systemic injection (Figure 3D). At these lower local doses of immunomodulatory antibodies, serum levels of the mAbs became undetectable 72 hours after the second dose of mAbs (i.e., third day after therapy) (Supplemental Figure 1; supplemental material available online with this article; doi: 10.1172/JCI64859DS1). Thus, systemic toxic effects of these antibodies would be expected to be averted.
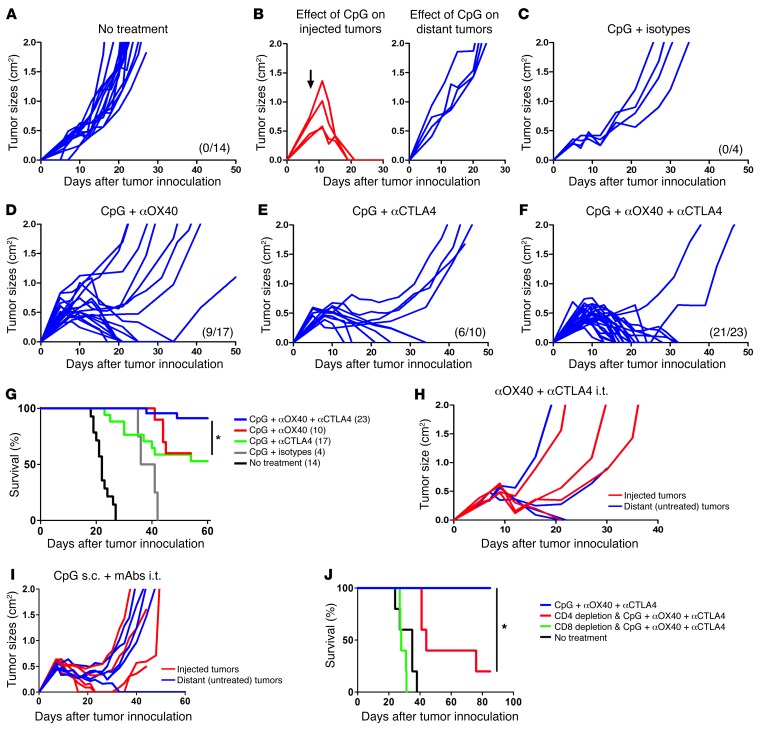
The antitumor immune response generated by the combination of CpG and either αOX40 or αCTLA4 eradicated most of the tumors of the uninjected sites (Figure 4, A–E). But the combination of all 3 was even more effective and resulted in cure of most of the animals (Figure 4, F and G). There was an absolute requirement for CpG to be coinjected into the tumor (Figure 4, H and I). Furthermore, the generation of systemic antitumor immunity was dependent on both CD4 and CD8 T cells (Figure 4J).
Figure 4. Combination therapy of i.t. CpG and low-dose immunomodulatory antibodies is specifically required to trigger an efficient antitumor immune response.
Mice were treated as in Figure 3A, and. i.t. injections of therapy were done in right (local) tumors (red), and systemic antitumor effect was assessed by measuring growth of left (distant) tumors (blue). CpG was injected at 100 μg daily for 5 consecutive days. Low doses of mAbs (4 μg αOX40 or rat isotype or/and 1 μg αCTLA4 or hamster isotype) were injected on day 1 and 5 of CpG therapy into the same tumor. (A) Growth of distant tumors without therapy. (B–F) Systemic antitumor effect of CpG injections (B) alone on injected and distant tumors; (C) in combination with rat and hamster isotypes of αOX40 and αCTLA4 mAbs, respectively; (D) in combination with αOX40; (E) in combination with αCTLA4; and (F) in combination with αOX40 and αCTLA4. Previous curves pooled from at least 2 different experiments per group. (A–F) The number of surviving mice at day 60 is shown in parenthesis. (G) Survival of mice bearing 2 s.c. tumors (right and left flanks) that received CpG plus rat/hamster isotypes, CpG plus αOX40, CpG plus αCTLA4, or CpG plus αOX40/CTLA4 in right tumors. Survival with CpG plus αOX40/CTLA4 was significantly higher than with CpG plus αOX40 (P = 0.004) or CpG plus αCTLA4 (P = 0.03). Data are pooled from at least 2 different experiments per group; the number of mice per group is shown into parenthesis (*P < 0.05). Systemic antitumor effect of (H) αOX40 plus αCTLA4 local low-dose therapy without CpG (n = 4) and (I) s.c. CpG and i.t. αOX40 plus αCTLA4. (J) Survival of tumor-bearing mice treated with i.t. CpG and low-dose αOX40 plus αCTLA4 in the context of CD4 or CD8 T cell depletion (*P < 0.05).
Depletion of tumor-specific Tregs at the injected site.
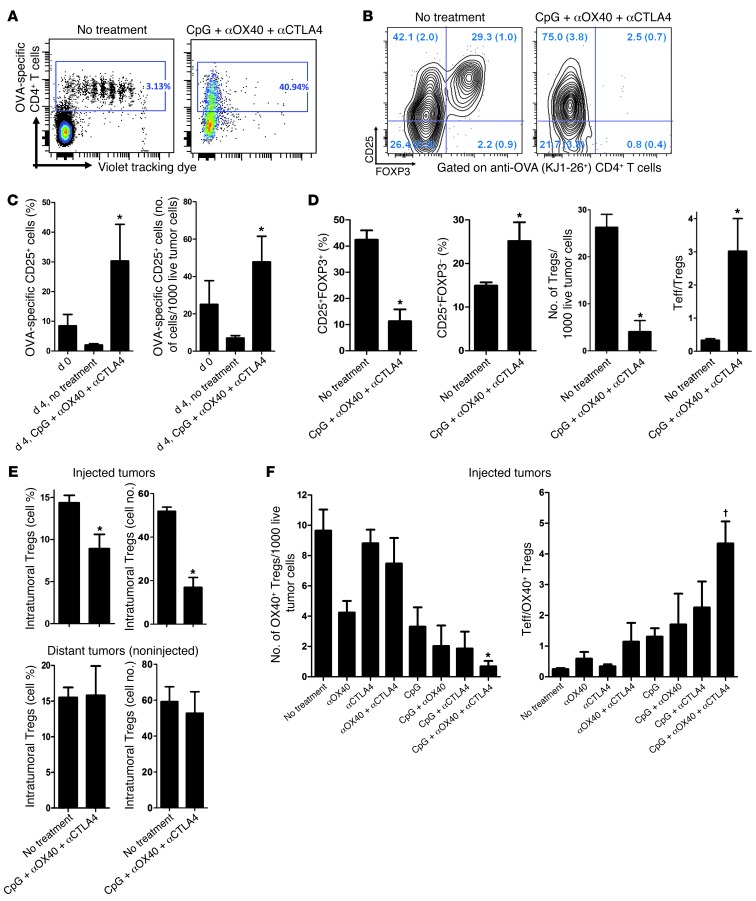
We examined the fate of tumor-specific i.t. Tregs during the triple combination therapy. To do this we implanted A20-OVA tumors into WT BALB/c mice at 2 s.c. sites. Once macroscopic tumors were established, we transferred OVA-specific CD4+ T cells into 1 out of the 2 tumors. The transferred cells were labeled with cytotracker dye to monitor their proliferation. Subsequently, one group of mice was treated with combination therapy in the tumor containing the OVA-specific CD4+ T cells. The phenotype of i.t. T cells was then analyzed. In the absence of treatment, all the i.t. OVA-specific CD4+ T cells proliferated (Figure 5A, left) and about 30% expressed a Treg phenotype (Figure 5B, left). By contrast, after local treatment with CpG plus αOX40/CTLA4, none of these OVA-specific CD4+ T cells expressed FOXP3, and the remaining tumor-specific CD4+ T cells had an activated Teff phenotype (as defined by KJ1-26+CD25+FOXP3–) (Figure 5B, right). These activated antitumor T cells had proliferated to the extent that they represented about 30% of the tumor-infiltrating CD4+ T cells (Figure 5C), and all the intracellular dye had been diluted out during the 8 days of the experiment (Figure 5A, right). In a more physiological model, in which OVA-specific Tregs spontaneously home within OVA-expressing tumors, we confirmed this in situ diminution of Tregs and concomitant increase of effector T cells (Teffs) upon local therapy (Figure 5D). This loss of FOXP3-expressing CD4+ T cells was limited to the injected tumors (Figure 5E), since the treatment did not affect the Treg population in distant tumors (Figure 5E).
Figure 5. Depletion of tumor-specific Tregs at the injected site.
(A) OVA-specific CD4+ T cells negatively selected from DO11.10 mice were stained with violet dye and injected into 7-day-old A20-OVA tumors of WT mice. Four days later, the tumors were treated or not with CpG plus low-dose αOX40/CTLA4. Tumor-infiltrating OVA-specific CD4+ T cells were analyzed 4 days after beginning therapy. Data are representative of cohorts of 3 mice. (B) Proportions of CD25+ and FOXP3+ cells within OVA-specific (KJ1-26+) CD4+ cells from untreated and treated A20-OVA tumors. Seven days after A20-OVA tumor challenge, 1 site was injected with 1.8 × 10⁶ OVA-specific CD4 cells purified from DO11.10 mice. Four days later, 1 group of mice received 1 day of CpG and low-dose αOX40/CTLA4 in these tumors, followed by 2 days of i.t. CpG alone; the phenotype of OVA-specific CD4 cells was analyzed by FACS on day 4. Quadrants values are mean percentages (± SEM) obtained in each group (3 mice per group). (C) Activated OVA-specific CD4+ T cells infiltrating A20-OVA tumors at day 0 and 4 days later without therapy (no treatment) or after 4 days of i.t. low-dose immunomodulation (CpG plus αOX40/CTLA4). Results are presented as proportions of KJ1-26+CD25+ cells among total CD4+ T cells and absolute numbers of cells per 1,000 live cells (n = 3, *P < 0.05 at day 4). (D) DO11.10 mice (n = 5 per group) were challenged with 5 × 10⁶ A20-OVA tumor cells s.c. Seven days later, one group received i.t. CpG plus αOX40/CTLA4 as described before. Infiltrating CD4+ T cells of A20-OVA tumors were analyzed by FACS for CD25 surface expression and FOXP3 intracellular expression. *P < 0.05. (E) Tumor-infiltrating CD4+FOXP3+ T cells within injected or uninjected A20-OVA tumors in WT mice on day 4 of therapy (n = 3 per group, *P < 0.05). (F) Effect of therapy on tumor-infiltrating tumor-specific Tregs (as defined by CD3+CD4+CD25+OX40+FOXP3+ cells) in injected A20 tumors of WT mice on day 4 of therapy (*P < 0.0001). The ratio of Teffs (CD3+CD4+CD25+OX40–FOXP3–) over tumor-specific Tregs (CD3+CD4+CD25+OX40+FOXP3+) is also displayed (†P = 0.01). Mean ± SEM.
We have shown that OX40 is mainly expressed on Tregs (Figure 1C), together with CTLA-4 (Figure 1D), upon recognition of tumor antigens (Figure 1I). Therefore, OX40 could be used in the WT system as a surrogate marker of tumor-specific Tregs. In order to determine the relative contribution of each therapeutic molecule in the depletion of these OX40+ tumor-specific Tregs, we treated WT mice bearing established A20 lymphoma with single, double, or triple combination therapy. We found a cumulative effect of the 3 molecules on the depletion of tumor-specific Tregs (Figure 5F) and a concomitant increase in the ratio of Teffs over Tregs (Figure 5F).
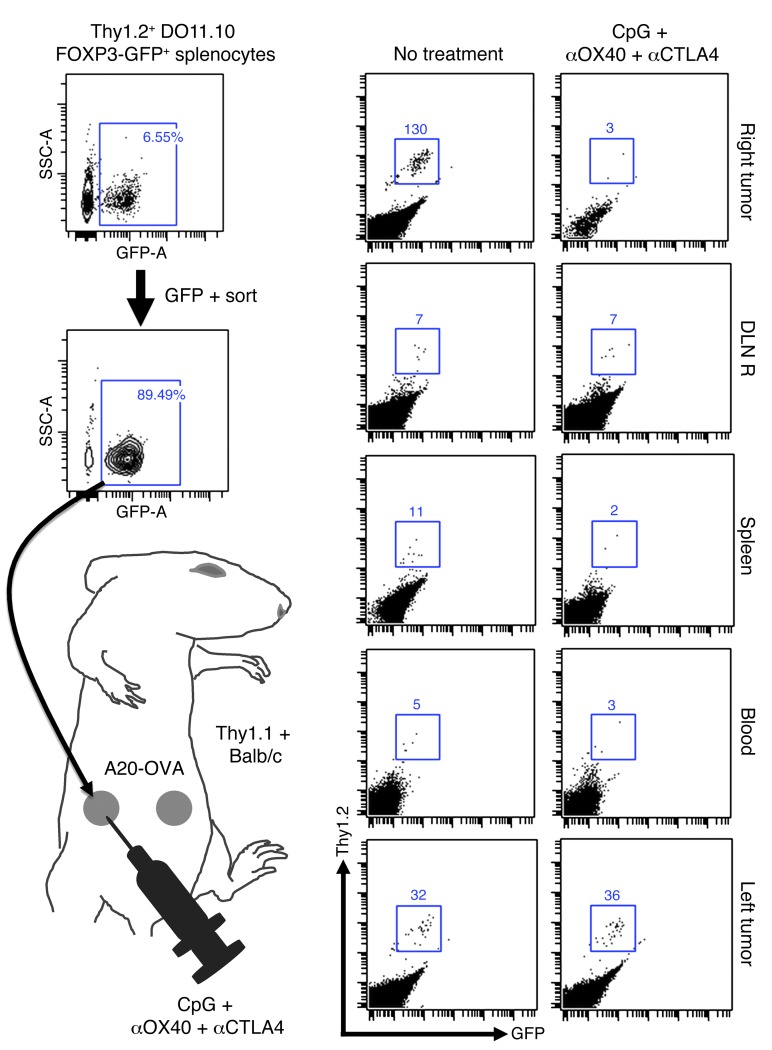
In order to know whether this Treg depletion was secondary to Treg migration, we used Thy1.2 FOXP3-GFP DO11.10 mice. We sorted GFP+ pure Tregs cells and transplanted them into A20-OVA tumors established on the right flank of Thy1.1 mice.
After 3 days (which is the time needed to obtain the upregulation of OX40 and CTLA-4 on Tregs in vitro; data not shown), we started the i.t. triple combination therapy. On day 4 of therapy, we harvested cells from the injected tumors (right side), their draining lymph nodes, the blood, the spleen, and the distant untreated tumors (left side) and looked for Thy1.2+GFP+ donor cells within the CD4 cells of the Thy1.1+ host. Upon therapy, the tumor-specific FOXP3+ cells were depleted in the injected tumor, as previously described (Figure 6). The treatment did not result in an increase of donor cells in the tumor-draining lymph node, the blood, or the spleen (Figure 6). This result shows that tumor-specific FOXP3+ cells are depleted upon CpG plus αOX40/CTLA4 therapy rather than induced to migrate. In addition, it shows that the donor tumor-specific FOXP3+ cells were not converted into Teffs at the treatment site, since this would have been detected as Thy1.2+ cells that had lost GFP.
Figure 6. In situ immunization with CpG plus αOX40/CTLA4 induces depletion of i.t. tumor-specific Tregs.
After a CD4-negative selection, OVA-specific FOXP3-GFP Tregs were FACS sorted from splenocytes of Thy1.2 DO11.10 FOXP3-GFP mice. 2.5 × 10⁵ cells were injected into 5-day-old A20-OVA tumors on the right flank of Thy1.1 BALB/c mice. On day 8, right tumors were treated with i.t. CpG plus low-dose αOX40/CTLA4. On day 4 of therapy, the number of Thy1.2+ donor Tregs was counted by FACS in the injected (right) and distant (left) A20-OVA tumors, the right draining lymph nodes (DLN R), the spleen, and the blood of Thy1.1+ recipients.
The strategy of i.t. injections of CpG and low-dose antibodies is effective against aggressive tumors.
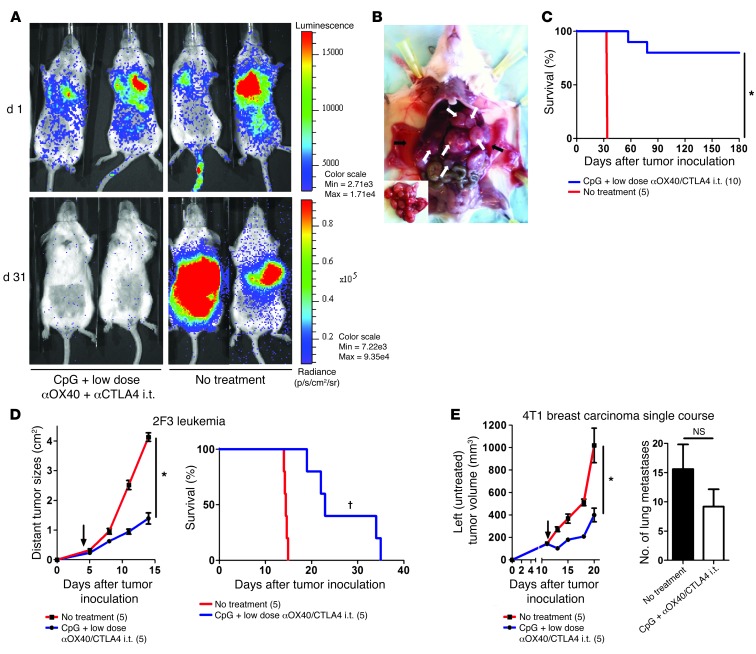
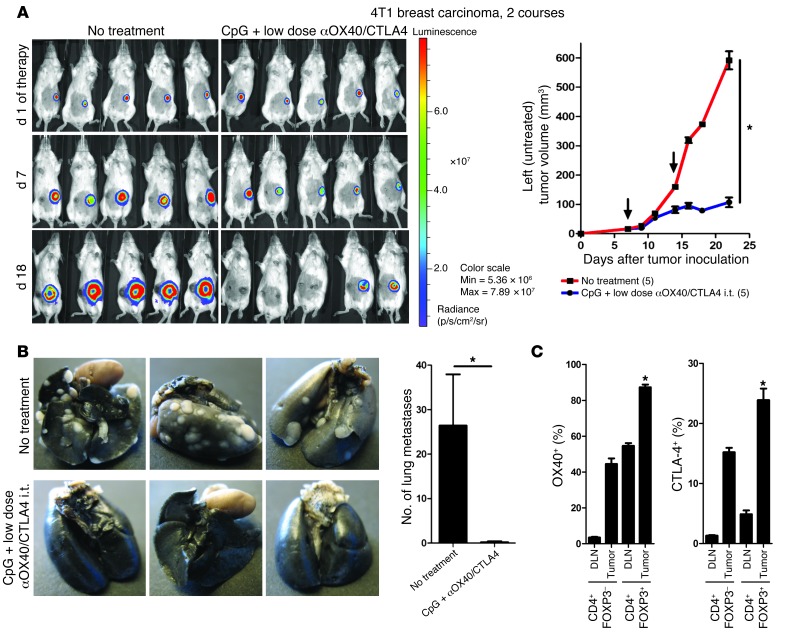
To assess the potency of this in situ immunomodulation, we tested it in more aggressive tumor models. Mice were challenged with lymphoma tumor cells both s.c. and i.v. The i.v. injection lead to broad dissemination of tumor cells (Figure 7A), with metastases in multiple organs (Figure 7B). Mice with established systemic disease (7 days after s.c. and i.v. tumor inoculations) received in situ immunomodulation with CpG and low-dose αOX40/CTLA4 into their s.c. tumor. The systemic antitumor immune response generated by the injections into the s.c. tumors eradicated the disseminated tumor sites (Figure 7A) and cured the majority of the mice (Figure 7C). This local immunotherapy was subsequently tested against 2 other aggressive tumor cell lines: the 2F3 line, a bcr-abl+ pro–B leukemia cell line (14), and the 4T1 line, a breast carcinoma line that produces spontaneous lung metastasis (15). In the 2F3 leukemia model, a single course of in situ immunomodulation with i.t. CpG and low-dose αOX40/CTLA4 immunotherapy was sufficient to affect the growth of the distant untreated tumors (Figure 7D, left) but also to increase survival (Figure 7D, right). In the 4T1 breast carcinoma model, a single course of in situ immunomodulation in one s.c. tumor had a significant effect on the growth of the distant tumors (Figure 7E) but had little effect on the number of lung metastases (Figure 7E). To overcome the higher aggressiveness of the 4T1 tumor, we added a second course of therapy. Mice were injected with 4T1 tumor cells at one s.c. site and with 4T1-Luc tumor cells at a second s.c. site to distinguish between viable and necrotic tumors at the distant sites. Subsequently, mice received 2 courses of in situ immunomodulation with CpG and αOX40/CTLA4 immunotherapy in 4T1 tumors. This second course of therapy dramatically improved the efficacy against the distant tumors (Figure 8A). The increased effect on lung metastases was especially impressive, as only a single nodule was found in the lungs of the treated mice, as opposed to a median of 25 nodules found in the untreated mice (Figure 8B). Interestingly, in this MHC class II–negative tumor model, the Tregs infiltrating the tumors and their draining lymph nodes also expressed OX40 and CTLA-4 (Figure 8C).
Figure 7. i.t. CpG plus low-dose αOX40/CTLA4 immunotherapy is efficient against aggressive, disseminated tumor models.
(A) Mice bioluminescence on day 1 (d 1) after i.v. challenge with 2 × 10⁶ of A20-Luc tumors cells. Mice were concomitantly injected s.c. with 10 × 106 A20 tumor cells. i.t. immunomodulation with CpG plus low-dose αOX40/CTLA4 was started on day 7 in the s.c. tumors. On day 31, only mice treated locally with CpG plus low-dose αOX40/CTLA4 in their A20 s.c. tumors showed disappearance of their systemic disease. (B) Ascites (black arrows) and metastases (white arrows) in internal organs of 1 representative mouse 32 days after an i.v. tumor challenge with 2 × 10⁶ A20 tumor cells (inset image illustrates predominant metastatic disease of the liver). (C) Long-term survival of mice concomitantly challenged on day 1 with 10 × 106 s.c. and 2 × 10⁶ i.v. A20 tumor cells. On day 7, most of the mice treated with CpG plus low-dose αOX40/CTLA4 in their s.c. tumor were cured (*P < 0.0001). (D) Growth of the distant (untreated) 2F3 leukemia tumors (*P < 0.0001) and survival (†P = 0.0018) after a single course of in situ immunomodulation with CpG plus low-dose αOX40/CTLA4 in mice (n = 5) challenged with 5 × 10⁴ 2F3 leukemia cells into 2 different s.c. sites (black arrows indicate day 1 of therapy). (E) Growth of the distant (untreated) 4T1 breast carcinoma tumors (*P < 0.05) and number of lung metastases on day 22 after a single course of i.t. immunomodulation with CpG plus low-dose αOX40/CTLA4 (mean ± SEM). Mice (n = 5) were challenged with 1 × 10⁴ 4T1 cells in 2 different s.c. sites; only 1 tumor site was treated (black arrows indicate day 1 of therapy). The number of mice per group is shown into parenthesis.
Figure 8. Two courses of i.t. CpG plus low-dose αOX40/CTLA4 immunotherapy enhances the antitumor immune response.
(A) Tumor growth and viability of distant tumors after 2 courses of i.t. CpG plus low-dose αOX40/CTLA4. Mice (n = 5) were challenged with 1 × 10⁴ 4T1 and 1 × 10⁴ 4T1-Luc tumor cells in their right and left flank, respectively, followed by 2 courses of i.t. CpG plus low-dose αOX40/CTLA4 in their right tumor (black arrows indicate day 1 of each course). The viability of the distant (untreated) 4T1-Luc breast carcinoma tumors was assessed by bioluminescence. *P < 0.05. (B) Spontaneous lung metastases of 4T1 tumors on day 29 after s.c. tumor inoculation in untreated mice and after 2 courses of i.t. CpG plus low-dose αOX40/CTLA4 (mean ± SEM). (C) OX40 and CTLA-4 surface expression on CD4+ T cells infiltrating 4T1 breast carcinoma tumors and their draining lymph nodes (FACS analysis; 5 mice per group, *P < 0.0001 for both OX40 and CTLA-4; mean ± SEM).
i.t. CpG plus low-dose αOX40/CTLA4 immunotherapy cures mice with CNS lymphoma.
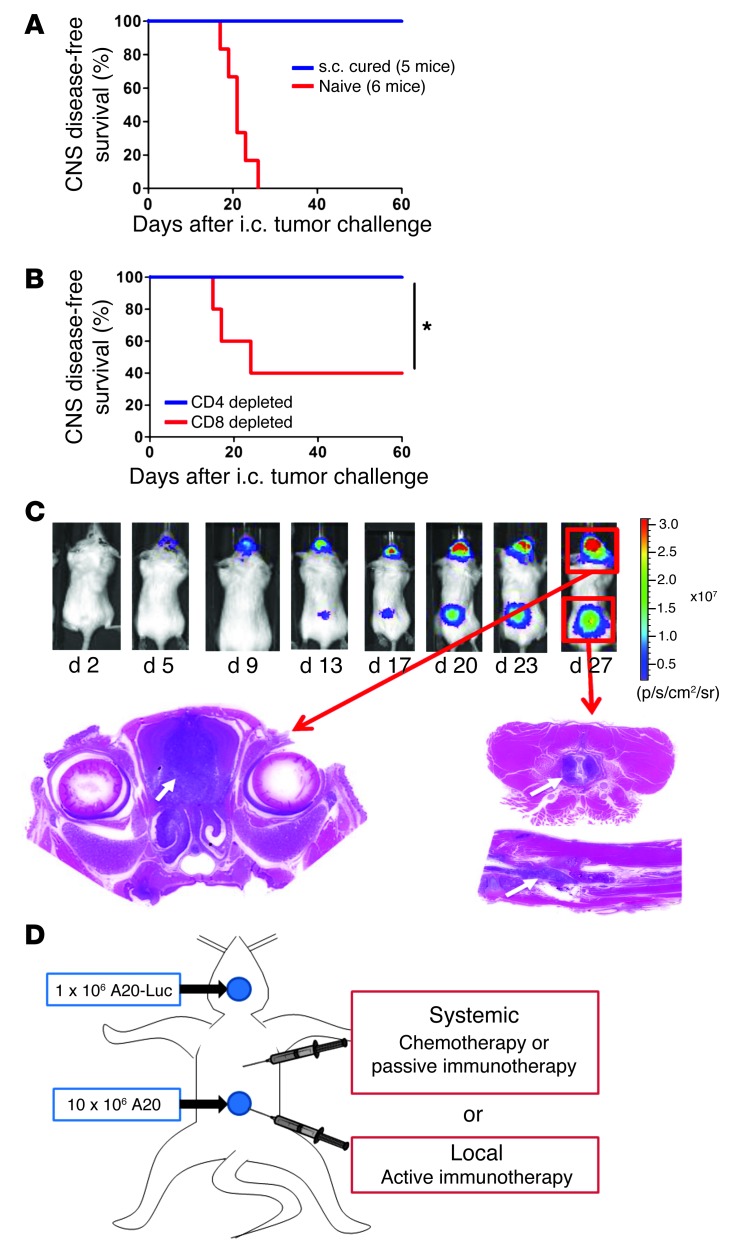
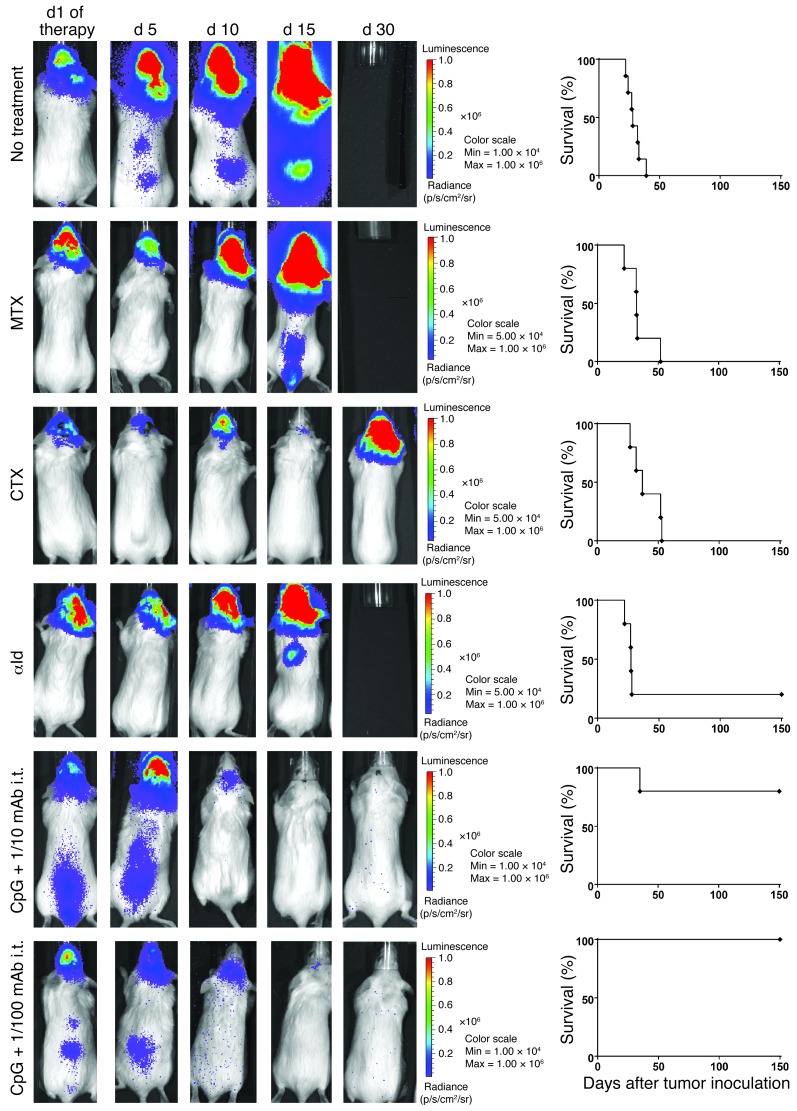
Mice that had been cured by the systemic effect of local immunomodulation (Figure 4F) were later rechallenged with tumor cells injected directly into the brain (i.c.). All the cured mice were resistant to this i.c. challenge (Figure 9A). This CNS protection was dependent on the presence of CD8+ T cells (Figure 9B). To determine whether the in situ immunomodulation with CpG and αOX40/CTLA4 was able to treat a concomitantly growing tumor established in the CNS, we designed a model in which tumor cells were injected both at a s.c. site in the flank and in the brain parenchyma. By using the A20-Luc tumor cell line, we were able to monitor the engraftment and growth of the i.c. tumors (Figure 9C and Supplemental Figure 2) and show that they develop spontaneous leptomeningeal and spinal cord metastases (Supplemental Figure 3). Mice bearing concomitantly established s.c. and CNS tumors (Figure 9D) were treated by in situ immunomodulation with CpG and αOX40/CTLA4 injections in their s.c. tumors. We compared this treatment both to chemotherapy and to passive immunotherapy with a mAb directed against the idiotype of the A20 lymphoma (16). The brain site initially responded to all these treatments but quickly regrew. However, the CpG and low-dose αOX40/CTLA4–treated mice were cured of their CNS disease (Figure 10).
Figure 9. CNS lymphoma development after i.c. tumor challenge.
(A) CNS disease-free survival after i.c. challenge. CNS protection of mice previously cured from s.c. lymphoma with i.t. CpG plus low-dose αOX40/CTLA4. 150 days later, these mice and naive mice were challenged i.c. with 0.5 × 10⁶ A20 tumor cells. Mice were sacrificed when presenting with neurological symptoms. *P < 0.05. (B) CNS disease-free survival in the same experimental settings but with mice depleted of CD4+ or CD8+ T cells a few days prior the i.c. challenge. (C) CNS lymphoma mouse model. 0.5 × 10⁶ to 1 × 10⁶ A20 or A20-Luc lymphoma tumor cells were stereotactically injected into the brain parenchyma of syngeneic BALB/c mice. Tumor development was monitored longitudinally using bioluminescence signal of A20-Luc tumor cells. i.c. tumor engraftment rate was higher than 95%. The bioluminescence signal after A20-Luc injections revealed spontaneous leptomeningeal metastases in 20% to 40% of the cases. The correlation between brain and spinal cord bioluminescent signals and pathological infiltration by tumor cells was confirmed by histology (Supplemental Figures 2 and 3). White arrows indicate the localization of the small blue tumor cells within the brain or the spinal cord after H&E staining. (D) CNS lymphoma treatment groups. Mice were challenged s.c. with 10 × 106 A20 and i.c. with 1 × 10⁶ A20-Luc tumors cells. Once the tumors were established (day 5 after i.c. tumor inoculation), these mice received either systemic conventional therapies (chemotherapies or passive immunotherapy) or local in situ active immunomodulation.
Figure 10. i.t. low-dose immunomodulation cures established CNS lymphoma.
The CNS lymphoma burden assessed over time by bioluminescence for 1 representative mouse of each treatment group and the survival of the whole group (5 mice per group). MTX, 400 mg/kg s.c. MTX, followed by 12 mg/kg s.c. calcium leucovorin rescue started 16 hours later and given once every 2 hours for a total of 5 doses; CTX, 100 mg/kg i.p CTX for 2 subsequent days; αId, 100 mg i.p.; i.t. CpG and 1/10 or 1/100 doses of αOX40/CTLA4.
The triple combination therapy triggers a tumor-specific immune response that infiltrates, cures, and protects the brain.
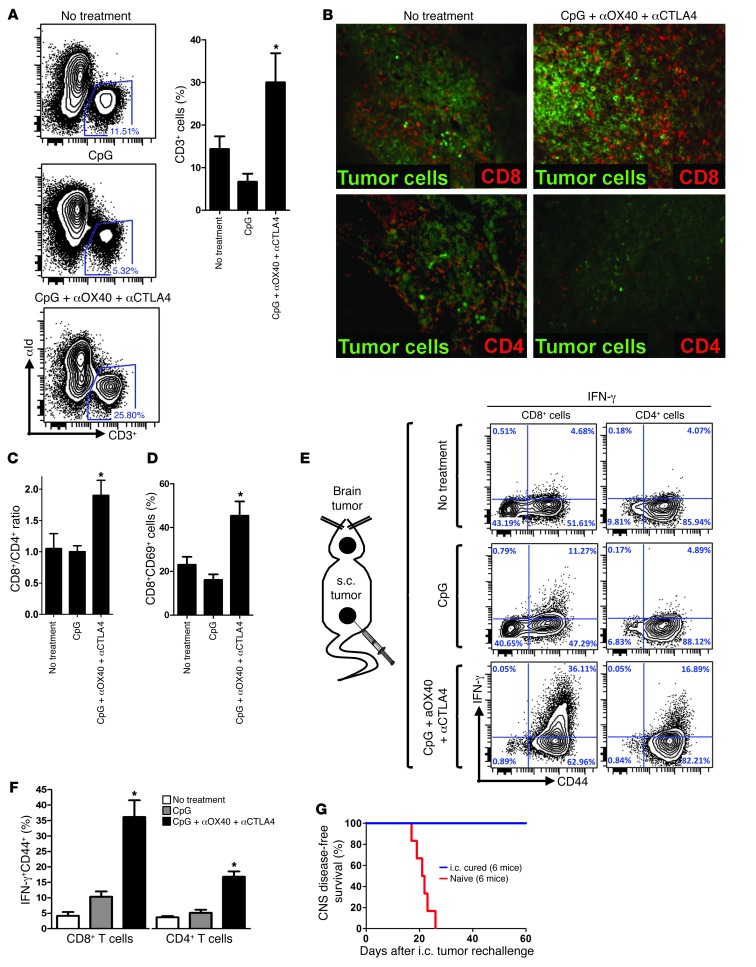
In order to assess whether the addition of immunomodulatory antibodies to CpG therapy was able to trigger a better activation of the antitumor immune response, we took mice bearing both an established CNS and s.c. lymphoma and treated the peripheral s.c. site with i.t. CpG, with or without low-doses of αOX40 and αCTLA4. We found that, with the addition of the immunomodulatory antibodies, the proportion of infiltrating T cells (CD3+ cells) was dramatically increased in the brain (Figure 11A). The majority of these brain-infiltrating T cells were CD8+ (Figure 11, B and C) and presented with a more activated phenotype (Figure 11D). To determine whether these T cells had a tumor-specific reactivity, we exposed them to irradiated tumor cells overnight. We found that after triple combination therapy the proportion of cytotoxic T cells was dramatically increased with high levels of IFN-γ and perforin-secreting CD8+ cells and CD4+ cells (Figure 11, E and F, and Supplemental Figure 4). Mice cured from CNS lymphoma also showed long-term CNS immunity, as all of them subsequently resisted rechallenge of the tumor in the contralateral hemisphere (Figure 11G).
Figure 11. i.t. low-dose immunomodulation conveys a sustainable cytotoxic antitumor immune response, even in an immune sanctuary site.
(A) Mice were challenged with 1 × 10⁶ A20 tumor cells i.c. and 10 × 106 A20 tumor cells s.c. and treated with CpG plus low-dose aOX40/CTLA4 as previously described (see Figure 9D). On day 6 after the beginning of therapy, brains were collected and digested, and mononuclear cells were separated by Percoll. These cell suspensions were analyzed by FACS for T cell (CD3+) infiltration (gate on all viable cells, *P < 0.05). (B) Brains of mice bearing CNS lymphoma were extracted on day 7 of therapy and stained by IF for CD8+ and CD4+ T cells (red). Tumor cells were identified by tumor idiotype staining (green). Original magnification, ×20. (C) Ratio of number of brain-infiltrating CD8+ T cells over CD4+ T cells upon therapy. *P < 0.05. (D) Proportion of activated (CD69+) CD8+ T cells upon therapy. *P < 0.05. (E) Brains from CNS lymphoma-bearing mice were collected on day 8 of s.c. therapy and reexposed overnight to irradiated A20 tumor cells. T cells were subsequently stained for surface CD44 and intracellular IFN-γ. (F) As in E, but median values from 5 mice (*P < 0.0001 for both CD8+ and CD4+ cells). (G) Mice cured from CNS lymphoma were rechallenged i.c. 140 days later in the contralateral hemisphere with 0.5 × 10⁶ A20 lymphoma tumor cells as were naive mice. Survival after rechallenge of i.c. cured is shown (6 mice per group, P < 0.001).
Discussion
Many attempts to treat established cancer by therapeutic vaccination have been unsuccessful (17). The discovery of Tregs in 2001 and their pivotal role in tolerance opened a new chapter in immunology (18–20). Although Tregs are essential to prevent autoimmunity, it is now evident that they also lead to cancer immune tolerance (21) and to a worse prognosis (6, 22) and probably explain many failures of cancer immunotherapy (4, 23, 24). Therefore, Tregs are now identified as a new target in the host that could be neutralized to reverse the suppressive effects of the tumor on the immune system (5, 25, 26). Tregs are usually identified by their expression of FOXP3. However, no markers have been found that selectively identify tumor-specific Tregs. Here we show that OX40 and CTLA-4 are both highly expressed on the surface of i.t. CD4+ cells in mice and in patients with lymphoma. More specifically, in an in vivo model, we show that surface expressions of both OX40 and CTLA-4 are limited to the tumor-specific Treg subset. The expressions of both OX40 and CTLA-4 have been previously studied in immune cells, but the notion that their upregulation happens after TCR engagement is not generally appreciated (27, 28). Notably, several of these previous studies did not distinguish between intracellular and surface expression of these 2 molecules. This information is crucial, as the biological activity of these molecules is thought to be mediated through a surface interaction with ligands expressed on the surface of other immune cells (namely OX40L and CD80/86 for CTLA-4). Surface expression is particularly important if in vivo targeting with mAbs is contemplated. Using a mouse model in which tumor cells expressed an antigen that is specifically recognized by a transgenic CD4+ TCR, we showed that the upregulation of OX40 and CTLA-4 occurs at the cell surface of tumor antigen–specific Tregs. Thus, OX40 and CTLA-4 can be used as targets to address tumor-specific Tregs within the tumor-infiltrating lymphocytes.
Several studies have reported the antitumor efficacy of αOX40 and αCTLA4 when used systemically (i.p. or i.v.) as single agent immunotherapies or in combination to other molecules (13, 27, 29, 30). Once we found that OX40 and CTLA-4 were highly expressed by tumor-specific Tregs at the tumor site, we decided to test whether the same systemic antitumor efficacy could be obtained by administering the therapy locally (i.t.) rather than systemically. Interestingly, there was no difference in terms of immediate antitumor effect, as distant (noninjected) tumors disappeared in both groups. However, most of the mice treated with systemic immunomodulation subsequently developed distant tumor relapse, whereas the mice treated locally with the antibodies did not relapse. This result highlights two subsequent processes operating during the antitumor immune response: an initial response, which eradicates the bulky disease, followed by a second long-term or “memory” response that prevents late relapses from minimal residual disease. Therefore, the superior long-term efficacy of the in situ immunomodulation strategy could be due to a better stimulation and cross presentation of tumor antigens. In order to separate the effects within the injected tumors, without having confounding factors from the systemic action of the immunomodulatory mAbs, we tested lower doses of αOX40 and αCTLA4. Interestingly, we found that the same systemic antitumor immune response was obtained with a 100-fold lower dose of immunomodulatory mAbs if they were administered locally into the tumor. This result has direct clinical implications, since we know from human clinical trials that i.v. αCTLA4 therapy induces early autoimmune toxic events in up to 60% of the patients (9, 31–35). This “local low-dose immunomodulation” strategy might avoid the toxicity of immunomodulatory antibodies, while enhancing the adaptive antitumor immune response. Moreover, this local low-dose strategy has mechanistic implications. We showed that i.t. tumor-specific Tregs express high levels of OX40/CTLA-4 prior to therapy and that tumor-specific Tregs became undetectable after i.t. treatment. One possibility was that they were depleted by the αOX40 and αCTLA4 antibodies. However, these antibodies alone, without CpG, had little effect on Treg depletion and tumor regression. A second possibility was that these tumor-specific Tregs were converted to tumor-specific Teffs. Indeed, others have shown that OX40, CTLA-4, and CpG could all alter the suppressive properties and, in some cases, the phenotype of Tregs (8, 27, 36–44). However, we ruled out this hypothesis by tracking the Tregs in vivo: the addition of CpG to immunomodulatory antibody therapy resulted in the depletion of i.t. tumor-specific Tregs. Most interestingly, these modifications were only occurred at the injected site, whereas the proportion of Tregs at the distant sites was not affected by the therapy. This result shows that antitumor immune effectors elicited by local immunomodulation can proceed to eradication of distant tumor sites, even in the presence of Tregs at these sites.
Having demonstrated the systemic efficacy of our in situ immunotherapy on different models of metastatic tumors, we decided to assess the ability of the antitumor immune response to eradicate tumor cells within the CNS. This question is of the utmost importance both for fundamental immunology and for clinical practice. Indeed, the original experiments of Medawar showed that the brain is an immunologically privileged site for skin allografts (45, 46). In clinical practice, a primary or secondary CNS involvement of any cancer indicates poor prognosis, because all of our treatments, including antitumor mAbs, fail to cross the blood-brain barrier (47, 48). Indeed, in our experiments, chemotherapy and a tumor-targeting mAb showed little effect against the implanted CNS disease. By contrast, injection of CpG and low-dose αOX40/CTLA4 into s.c. tumors eradicated tumor in the brain as well as leptomeningeal and spinal cord metastases. Moreover, cured mice had a long-term, CD8+-dependent, intra-CNS immune protection from late contralateral i.c. tumor rechallenge. Recent murine studies have shown that T cells directed against alloantigens (49) or against nonsyngeneic tumors can access the brain (50–53). Moreover, it has been shown in humans that adoptive antitumor T cell therapy can have an effect against brain tumor sites (54). However, such a strategy requires a conditioning regimen prior to the administration of these ex vivo–generated antitumor T cells. Here we show in a syngeneic tumor model that in situ immunomodulation in a peripheral tumor site generates an antitumor immune response within the distant tumor sites, including in the brain, and is able to eradicate established disseminated disease and provide vaccine protection in the CNS.
Taken together, our results support a paradigm shift in cancer therapy, in which, instead of using mAbs to target the tumor, mAbs will be used to target the immune system in order to stimulate the antitumor immune response. Additionally, instead of systemic treatment, all of the therapies will be delivered locally, with resulting systemic eradication of tumor. This strategy of local tumor immunomodulation could be tested soon in patients, since many of the relevant ligands and antibodies are currently in clinical development.
Methods
Reagents.
CpG 1826 was provided by Pfizer Vaccines Research. αOX40 (CD134) mAb (rat IgG1, clone OX86; European Collection of Cell Cultures) and αCTLA4 (CD152) mAb (hamster IgG, clone 9H10; gift from J. Allison, MD Anderson Cancer Center, Houston, Texas, USA) hybridoma production were collected by Bionexus Inc. from ascites of nude and SCID mice, respectively.
Mice.
Eight- to twelve-week-old female BALB/c and DO11.10 mice were purchased from The Jackson Laboratory and housed in the Laboratory Animal Facility of the Stanford University Medical Center. All experiments were approved by the Stanford Administrative Panel on Laboratory Animal Care and conducted in accordance with Stanford University Animal Facility and NIH guidelines. DO11.10 TCR transgenic mice were crossed with Foxp3-GFP report mice on the BALB/c background (55). The resultant DO11/Foxp3-GFP mice were screened for DO11 TCR expression via PCR and for Foxp3 expression via flow cytometry. Lymph nodes and spleens were harvested from double-transgenic mice and sorted for GFP expression.
Cell lines.
The A20 cell line was obtained from ATCC (ATCC no. TIB-208). It is a BALB/c B cell lymphoma line derived from a spontaneous neoplasm found in an old BALB/cAnN mouse, expressing MHC class I and class II H-2d molecules. A20 WT tumor was transfected with an expression plasmid DNA encoding a fusion of chicken ovalbumin with the transmembrane and cytoplasmic domains of the transferrin receptor (“membrane ovalbumin”) under hygromycin selection. Both MHC I and II epitopes of OVA are presented by the transfectant (56). It was subsequently transfected with a plasmid cDNA encoding firefly luciferase under G418 selection. This A20-OVA-Luc cell line was made by Gang Zhou in the Levitsky laboratory (Johns Hopkins University) and was grown in complete RPMI with 400 μg/ml Geneticin (Cellgro) and 200 μg/ml Hygromycin (Invitrogen). The 4T1 mammary carcinoma cell line is a subclone of a single spontaneously arising mammary tumor of a MMTV+ BALB/c mouse. The 4T1 and 4T1-Luc cell lines were gifts from the S. Strober laboratory and the C. Contag laboratory (both at Stanford University), respectively. The 2F3 leukemia cell line was derived in our laboratory from Bcl/Abl retrovirally infected BALB/c bone marrow (14). This cell line has a pre–B cell phenotype and is able to grow in syngeneic immunocompetent BALB/c mice. Tumor cells were cultured at 37°C in 5% CO2 in RPMI 1640 medium with l-glutamine (Cellgro) supplemented with 10% heat-inactivated FCS (HyClone), 100 U/ml penicillin (Gibco), 100 μg/ml streptomycin (Gibco), and 50 μM 2-ME (Gibco), as complete medium.
Flow cytometry.
Cells were surface stained in wash buffer (PBS, 1% FBS, and 0.01% sodium azide), fixed in 2% paraformaldehyde, and analyzed by flow cytometry on a FACSCalibur or LSRII system (BD Biosciences). Mouse Fc receptors were blocked with 1 μg FcγRIII/II–specific antibody (clone 2.4G2, rat IgG2b κ; BD Bioscience) per 1 × 10⁶ cells. Anti-FOXP3 (clone FJK-16s, eBiosciences) intracellular stainings were performed as recommended by the mAb manufacturer. αOX40 (clone OX86, eBioscience) and αCTLA4 (clone UC10-4F10-11, BD Biosciences) were used for surface staining (together with intracellular anti-FOXP3). Infiltrating cells were isolated from the brain as previously described (57). Briefly, brain homogenates were obtained from perfused animals and incubated with collagenase (2 mg/ml) and DNAse (5 units/ml) for 1 hour at 37°C; mononuclear cells were purified by 2-step Percoll gradient centrifugation. FACS data were analyzed using Cytobank.
Immunohistochemistry.
Animals were injected with a lethal dose of ketamine and monitored. Upon the loss of nociceptive reflexes, animals were perfused transcardially with 20 ml PBS/EDTA, followed by 20 ml 4% paraformaldehyde in 0.1 M PBS at room temperature. The brain was removed, and the tissue was post-fixed for 24 hours in 4% paraformaldehyde at 4°C and then cryoprotected in a 24% sucrose solution in PBS for 24 hours. Brain tissues were embedded in OCT (Tissue-Tek) and frozen at –80°C. After tissue processing, 20-μm-thick cryosections were cut from the brains. Sections were allowed to thaw at room temperature, rehydrated in PBS for 2 hours, and incubated with blocking buffer (25% normal goat serum, 3% BSA, 0.3% Triton X-100) for another 1 hour. FcγR was blocked by incubating the sections with 5 to 10 μg/ml purified anti-CD16/32 antibody on ice for 10 minutes. Primary antibody staining was carried out overnight. Primary antibodies included anti-CD4 (BD Pharmingen, catalog no. 553044), anti-CD8 (Serotec, catalog no. MCA74G), anti-B220 (BD Pharmingen, catalog no. 557390), and Alexa Fluor 488– or Alexa Fluor 647–conjugated mAb specifically directed against the A20 lymphoma idiotype (16). Secondary antibodies were Alexa Fluor 568–conjugated donkey anti-rat (Molecular Probes). All sections were analyzed by using a Leica fluorescence microscope.
ELISA.
Plasma levels of αOX40 and αCTLA4 antibodies were measured by ELISA. Plasma were collected from tumor-bearing mice on day 3 after completion of the CpG plus αOX40/CTLA4 therapy and added to 96-well MaxiSorp plates (Nunc) coated with purified anti-rat and anti-hamster IgG, respectively. Bound antibodies were detected using horseradish peroxidase–conjugated goat anti-rat and goat anti-hamster IgG. Pure αOX40 and αCTLA4 obtained from ascites and with known concentration served as positive controls. Absorbance was determined at 405 nm using a Vmax Microplate Reader (Molecular Devices).
Tumor transplantations.
Tumor cells were implanted into mice while in exponential growth phase (below 1.5 × 10⁶ cells/ml for cells in suspension and below 70% confluence for adherent 4T1 tumor cells). The number of tumor cells injected is specified in each experiment. s.c., i.v., and i.c. injections were done with tumor cells washed twice in FBS-free media and resuspended in 50, 100, and 10 μl RPMI, respectively. s.c. tumors were implanted on the right and left flanks. The orthotopic CNS tumor implantation has been previously described (58). Briefly, mice were maintain under continuous anesthesia with isoflurane and were placed onto a stereotactic frame (Kopf Instruments) and secured by ear bars. Under a dissection microscope, a 1-cm parasagittal incision was made to expose the coronal and superior sagittal sinus. An electric drill was used to create a 1-mm-diameter burr hole 2 mm lateral and 1 mm posterior to the anatomic bregma over the right hemisphere. A 10-μl suspension containing either A20 or A20-Luc tumor cells was prepared in serum-free RPMI. After dural penetration, cells were injected 2.5 mm deep into the parenchyma using a 10-μl microinjector syringe (Hamilton Co.) at a rate of 1 μl per min. The needle was then retracted 1 mm per min, and the scalp was closed using 5-0 Vicryl sutures (Ethicon Inc.). This model results in 99% engraftment, with consistent tumor size and growth. For the s.c. and CNS lymphoma model, mice were first injected s.c. with 10 × 106 A20 tumor cells. On day 5 after s.c. tumor inoculation, these mice were challenged i.c. with 1 × 10⁶ A20-Luc tumor cells. On day 5 after i.c. tumor inoculation, therapy was initiated as described in the Results section.
Tumor assessments.
s.c. tumor sizes were monitored with a digital caliper (Mitutoyo) every 2 to 3 days and expressed either as surface (length × width) or volume (length × width × height).Mice were killed when s.c. tumor size reached 2 cm2. Lungs were analyzed ex vivo for metastasis 28 days after 4T1 or 4T1-Luc tumor challenge by injecting India ink through the trachea. Lungs were then excised, washed once in water, and fixed in Fekete’s solution (100 ml 70% alcohol, 10 ml formalin, and 5 ml glacial acetic acid) at room temperature. Surface metastases subsequently appeared as white nodules at the surface of black lungs and were counted under a microscope. Tumor cell lines transduced with the firefly luciferase could be used in order to monitor in vivo the tumor growth and the antitumor immune response. For bioluminescence assessment, mice were anesthetized with isoflurane gas (2% isoflurane in oxygen, 1 l/min) during injection and imaging procedures. i.p. injections of d-Luciferin (Biosynth AG) were done at a dose of 150 mg/kg, providing a saturating substrate concentration for luciferase enzyme (luciferin crosses the blood-brain barrier). Mice were imaged in a light-tight chamber using an in vivo optical imaging system (IVIS 200; Xenogen Corp.) equipped with a cooled charge-coupled device camera. During image recording, mice inhaled isofluorane delivered via a nose cone, and their body temperature was maintained at 37°C in the dark box of the camera system. Bioluminescence images were acquired between 10 and 20 minutes after luciferin administration. Mice usually recovered from anesthesia within 2 minutes after imaging.
CD4 and CD8 T cell depletions.
Anti-CD4 (rat IgG2b) and anti-CD8 (rat IgG2b) depleting mAbs were produced from GK1.5 and 2.43 hybridomas as previously described (13). Antibodies were injected 2 days and 1 day before therapy, on the day therapy was begun, and at 5, 8, and 19 days after beginning of therapy at a dose of 500 μg per injection. Blood CD4 and CD8 T cell depletions were validated by flow cytometry (>95% depletion).
Immune cell processing and transplant.
Tumors, lymph nodes, and spleens were turned into single cell suspensions by processing them through a 70-μm cell strainer (BD Biosciences). Untouched CD4+ T cells were obtained by negative selection from DO11.10 mice splenocytes and lymph nodes, followed by a CD25+ positive selection (either Dynabeads, Life Technologies, or EasySep, Stem Cell Technologies). These CD4+CD25– and CD4+CD25+ cells (containing around 30% FOXP3+ cells) were mixed at a 1:1 ratio in 50 μl RPMI before transplantation within A20-OVA tumors. A violet in vivo tracking dye was used to assess their proliferation (CellTrace, Life Technologies).
Tumor immunotherapy and chemotherapy.
Treatment modalities are specified in each experiment. Briefly, therapy was started when s.c. tumors reached 0.7–1 cm in largest diameter, which usually occurred around day 7 after tumor inoculation. Typically, CpG was injected i.t. into a single tumor at a dose of 100 μg for each of 5 consecutive days (days 1 to 5 of therapy). αOX40 and αCTLA4 antibodies were injected either i.p. or i.t. on day 1 and day 5 of therapy at 400 μg and 100 μg per injection, respectively, which are generally considered to be the optimal doses according to prior publications (36, 59). These mAbs were subsequently tested with or without CpG at doses 10, 100, and 1,000 fold below these values. The lowest possible volumes of injections were used (minimal volume of 25 μl). The 100-fold dilution was found to be the lowest tested amount of mAbs that was able to trigger a sustained antitumor immune response when injected together with CpG. Therefore, the phrase “CpG plus low-dose αOX40/CTLA4” used throughout refers to 5 days of CpG at 100 μg per day, combined with 4 μg αOX40 and 1 μg αCTLA4 on day 1 and 5, with 25-μl volumes of injections each day into a single s.c. tumor. For the CNS lymphoma therapy, two regimens were tested: one with 1:10 doses of mAbs (40 μg αOX40 and 10 μg αCTLA4 on day 1 and 5), one with 1:100 doses (4 μg αOX40 and 1 μg αCTLA4 on day 1 and 5). Passive immunotherapy was performed by systemically injecting a mAb directed against a tumor antigen (tumor idiotype). This anti-idiotype (αId, clone 1D2, mouse IgG2a) was injected at a dose of 100 mg i.p., which is known to be efficient in the A20 tumor model (16). Chemotherapies tested were chosen based on their relative ability to cross the blood-brain barrier and their use in therapy of human CNS lymphoma. Methotrexate (MTX) was used at the maximal tolerated dose and most efficient dose for mice (400 mg/kg s.c.) followed 16 hours later by calcium leucovorin (12 mg/kg s.c.) given once every 2 hours for a total of 5 doses as previously described (60). Cyclophosphamide (CTX) was used at a dose of 100 mg/kg i.p for 2 subsequent days, which is known to be efficient in the A20 tumor model (1).
Brain histology.
A complete gross necropsy was performed. The entire CNS was collected in situ (brain within the skull, spinal cord within the vertebral column). The samples were placed in a combined preservative and decalcifying solution containing formalin and formic acid solution (Cal Ex II, Fisher Sci) for a minimum of 48 hours. After fixation and decalcification, the samples were routinely processed for light microscopic examination of H&E-stained sections.
Patient samples.
Tumor cells in suspension were isolated from tumor samples of patients with follicular lymphoma and mantle cell lymphoma. Informed consent was received from patients in accordance with the Declaration of Helsinki, and study approval was received from Stanford University’s Administrative Panels on Human Subjects.
Statistics.
Prism software version 5.0 (GraphPad) was used to analyze tumor growth and to determine the statistical significance of differences between groups by applying 2-tailed Student t tests (paired or unpaired depending on the settings of the experiment). Comparisons of means between more than 2 groups were done by ANOVA. These groups were subsequently compared 2 by 2 using a Bonferroni correction. Kaplan-Meier plots were used to analyze survival. Comparisons of survival curves were made using the log-rank test. P values of less than 0.05 were considered significant.
Supplementary Material
Acknowledgments
We thank Shoshana Levy for reviewing the manuscript, Debra Czerwinski from the Levy laboratory for her help with FACS analysis, Tim Doyle for his technical assistance with in vivo bioluminescence in the SCi3 Small Animal Imaging Facility at Stanford University, and Hong-An Truong from UCSF for her help with DO11.10-FOXP3-GFP mice. This work was supported by the William Lawrence and Blanche Hughes Foundation, the Institut National du Cancer (INCa), the Association pour la Recherche sur le Cancer (ARC), and the Fondation Monahan (Fulbright Program).
Footnotes
Conflict of interest: The authors have declared that no conflict of interest exists.
Citation for this article: J Clin Invest. 2013;123(6):2447–2463. doi:10.1172/JCI64859.
See the related Commentary beginning on page 2355.
References
- 1.Li J, et al. Lymphoma immunotherapy with CpG oligodeoxynucleotides requires TLR9 either in the host or in the tumor itself. J Immunol. 2007;179(4):2493–2500. doi: 10.4049/jimmunol.179.4.2493. [DOI] [PubMed] [Google Scholar]
- 2.Brody JD, et al. In situ vaccination with a TLR9 agonist induces systemic lymphoma regression: a phase I/II study. J Clin Oncol. 2010;28(28):4324–4332. doi: 10.1200/JCO.2010.28.9793. [DOI] [PMC free article] [PubMed] [Google Scholar]
- 3.Mellman I, Coukos G, Dranoff G. Cancer immunotherapy comes of age. Nature. 2011;480(7378):480–489. doi: 10.1038/nature10673. [DOI] [PMC free article] [PubMed] [Google Scholar]
- 4.Curiel TJ. Tregs and rethinking cancer immunotherapy. J Clin Invest. 2007;117(5):1167–1174. doi: 10.1172/JCI31202. [DOI] [PMC free article] [PubMed] [Google Scholar]
- 5.Colombo MP, Piconese S. Regulatory-T-cell inhibition versus depletion: the right choice in cancer immunotherapy. Nat Rev Cancer. 2007;7(11):880–887. doi: 10.1038/nrc2250. [DOI] [PubMed] [Google Scholar]
- 6.Ménétrier-Caux C, Gobert M, Caux C. Differences in tumor regulatory T-cell localization and activation status impact patient outcome. Cancer Res. 2009;69(20):7895–7898. doi: 10.1158/0008-5472.CAN-09-1642. [DOI] [PubMed] [Google Scholar]
- 7.Kryczek I, et al. FOXP3 defines regulatory T cells in human tumor and autoimmune disease. Cancer Res. 2009;69(9):3995–4000. doi: 10.1158/0008-5472.CAN-08-3804. [DOI] [PubMed] [Google Scholar]
- 8.Wing K, et al. CTLA-4 control over Foxp3+ regulatory T cell function. Science. 2008;322(5899):271–275. doi: 10.1126/science.1160062. [DOI] [PubMed] [Google Scholar]
- 9.Hodi FS, et al. Improved survival with ipilimumab in patients with metastatic melanoma. N Engl J Med. 2010;363(8):711–723. doi: 10.1056/NEJMoa1003466. [DOI] [PMC free article] [PubMed] [Google Scholar]
- 10.Pardoll DM. The blockade of immune checkpoints in cancer immunotherapy. Nat Rev Cancer. 2012;12(4):252–264. doi: 10.1038/nrc3239. [DOI] [PMC free article] [PubMed] [Google Scholar]
- 11.Quezada SA, Peggs KS, Curran MA, Allison JP. CTLA4 blockade and GM-CSF combination immunotherapy alters the intratumor balance of effector and regulatory T cells. J Clin Invest. 2006;116(7):1935–1945. doi: 10.1172/JCI27745. [DOI] [PMC free article] [PubMed] [Google Scholar]
- 12.Di Giacomo AM, Biagioli M, Maio M. The emerging toxicity profiles of anti-CTLA-4 antibodies across clinical indications. Semin Oncol. 2010;37(5):499–507. doi: 10.1053/j.seminoncol.2010.09.007. [DOI] [PubMed] [Google Scholar]
- 13.Houot R, Levy R. T-cell modulation combined with intratumoral CpG cures lymphoma in a mouse model without the need for chemotherapy. Blood. 2009;113(15):3546–3552. doi: 10.1182/blood-2008-07-170274. [DOI] [PMC free article] [PubMed] [Google Scholar]
- 14.Shoham T, Rajapaksa R, Kuo C-C, Haimovich J, Levy S. Building of the tetraspanin web: distinct structural domains of CD81 function in different cellular compartments. Mol Cell Biol. 2006;26(4):1373–1385. doi: 10.1128/MCB.26.4.1373-1385.2006. [DOI] [PMC free article] [PubMed] [Google Scholar]
- 15.Pulaski BA, Ostrand-Rosenberg S. Mouse 4T1 breast tumor model. Curr Protoc Immunol. 2001;Chapter 20:Unit 20.2. doi: 10.1002/0471142735.im2002s39. [DOI] [PubMed] [Google Scholar]
- 16.Varghese B, et al. Generation of CD8+ T cell-mediated immunity against idiotype-negative lymphoma escapees. Blood. 2009;114(20):4477–4485. doi: 10.1182/blood-2009-05-223263. [DOI] [PMC free article] [PubMed] [Google Scholar]
- 17.Weiner LM. Cancer immunotherapy — the endgame begins. N Engl J Med. 2008;358(25):2664–2665. doi: 10.1056/NEJMp0803663. [DOI] [PMC free article] [PubMed] [Google Scholar]
- 18.Brunkow ME, et al. Disruption of a new forkhead/winged-helix protein, scurfin, results in the fatal lymphoproliferative disorder of the scurfy mouse. Nat Genet. 2001;27(1):68–73. doi: 10.1038/83784. [DOI] [PubMed] [Google Scholar]
- 19.Wildin RS, et al. X-linked neonatal diabetes mellitus, enteropathy and endocrinopathy syndrome is the human equivalent of mouse scurfy. Nat Genet. 2001;27(1):18–20. doi: 10.1038/83707. [DOI] [PubMed] [Google Scholar]
- 20.Bennett CL, et al. The immune dysregulation, polyendocrinopathy, enteropathy, X-linked syndrome (IPEX) is caused by mutations of FOXP3. Nat Genet. 2001;27(1):20–21. doi: 10.1038/83713. [DOI] [PubMed] [Google Scholar]
- 21.Zhou G, Lu Z, McCadden JD, Levitsky HI, Marson AL. Reciprocal changes in tumor antigenicity and antigen-specific T cell function during tumor progression. J Exp Med. 2004;200(12):1581–1592. doi: 10.1084/jem.20041240. [DOI] [PMC free article] [PubMed] [Google Scholar]
- 22.Beyer M, Schultze JL. Regulatory T cells in cancer. Blood. 2006;108(3):804–811. doi: 10.1182/blood-2006-02-002774. [DOI] [PubMed] [Google Scholar]
- 23.Ahmadzadeh M, Rosenberg SA. IL-2 administration increases CD4+ CD25hi Foxp3+ regulatory T cells in cancer patients. Blood. 2006;107(6):2409. doi: 10.1182/blood-2005-06-2399. [DOI] [PMC free article] [PubMed] [Google Scholar]
- 24.Zou W. Regulatory T cells, tumour immunity and immunotherapy. Nat Rev Immunol. 2006;6(4):295–307. doi: 10.1038/nri1806. [DOI] [PubMed] [Google Scholar]
- 25.Nizar S, et al. T-regulatory cell modulation: the future of cancer immunotherapy? Br J Cancer. 2009;100(11):1697–1703. doi: 10.1038/sj.bjc.6605040. [DOI] [PMC free article] [PubMed] [Google Scholar]
- 26.Byrne WL, Mills KHG, Lederer JA, O’Sullivan GC. Targeting regulatory T cells in cancer. Cancer Res. 2011;71(22):6915–6920. doi: 10.1158/0008-5472.CAN-11-1156. [DOI] [PMC free article] [PubMed] [Google Scholar]
- 27.Croft M. Control of immunity by the TNFR-related molecule OX40 (CD134). Annu Rev Immunol. 2010;28:57–78. doi: 10.1146/annurev-immunol-030409-101243. [DOI] [PMC free article] [PubMed] [Google Scholar]
- 28.Rudd CE. The reverse stop-signal model for CTLA4 function. Nat Rev Immunol. 2008;8(2):153–160. doi: 10.1038/nri2253. [DOI] [PubMed] [Google Scholar]
- 29.Korman AJ, Peggs KS, Allison JP. Checkpoint blockade in cancer immunotherapy. Adv Immunol. 2006;90:297–339. doi: 10.1016/S0065-2776(06)90008-X. [DOI] [PMC free article] [PubMed] [Google Scholar]
- 30.Melero I, Hervas-Stubbs S, Glennie M, Pardoll DM, Chen L. Immunostimulatory monoclonal antibodies for cancer therapy. Nat Rev Cancer. 2007;7(2):95–106. doi: 10.1038/nrc2051. [DOI] [PubMed] [Google Scholar]
- 31. Wolchok JD. Phase III randomized study of ipilimumab (IPI) plus dacarbazine (DTIC) versus DTIC alone as first-line treatment in patients with unresectable stage III or IV melanoma. J Clin Oncol. 2011. 29 : suppl ; abstr LBA5 [Google Scholar]
- 32.Wolchok JD, et al. Ipilimumab monotherapy in patients with pretreated advanced melanoma: a randomised, double-blind, multicentre, phase 2, dose-ranging study. Lancet Oncol. 2010;11(2):155–164. doi: 10.1016/S1470-2045(09)70334-1. [DOI] [PubMed] [Google Scholar]
- 33.Weber JS, et al. Phase I/II study of ipilimumab for patients with metastatic melanoma. J Clin Oncol. 2008;26(36):5950–5956. doi: 10.1200/JCO.2008.16.1927. [DOI] [PubMed] [Google Scholar]
- 34.Weber J, et al. A randomized, double-blind, placebo-controlled, phase II study comparing the tolerability and efficacy of ipilimumab administered with or without prophylactic budesonide in patients with unresectable stage III or IV melanoma. Clin Cancer Res. 2009;15(17):5591–5598. doi: 10.1158/1078-0432.CCR-09-1024. [DOI] [PubMed] [Google Scholar]
- 35.O’Day SJ, et al. Efficacy and safety of ipilimumab monotherapy in patients with pretreated advanced melanoma: a multicenter single-arm phase II study. Ann Oncol. 2010;21(8):1712–1717. doi: 10.1093/annonc/mdq013. [DOI] [PubMed] [Google Scholar]
- 36.Leach DR, Krummel MF, Allison JP. Enhancement of antitumor immunity by CTLA-4 blockade. Science. 1996;271(5256):1734–1736. doi: 10.1126/science.271.5256.1734. [DOI] [PubMed] [Google Scholar]
- 37.Vu MD, et al. OX40 costimulation turns off Foxp3+ Tregs. Blood. 2007;110(7):2501–2510. doi: 10.1182/blood-2007-01-070748. [DOI] [PMC free article] [PubMed] [Google Scholar]
- 38.Nagar M, et al. TNF activates a NF-κB-regulated cellular program in human CD45RA– regulatory T cells that modulates their suppressive function. . J Immunol. 2010;184(7):3570–3581. doi: 10.4049/jimmunol.0902070. [DOI] [PubMed] [Google Scholar]
- 39.Chen X, Baumel M, Männel DN, Howard OMZ, Oppenheim JJ. Interaction of TNF with TNF receptor type 2 promotes expansion and function of mouse CD4+CD25+ T regulatory cells. J Immunol. 2007;179(1):154–161. doi: 10.4049/jimmunol.179.1.154. [DOI] [PubMed] [Google Scholar]
- 40.Hamano R, Huang J, Yoshimura T, Oppenheim JJ, Chen X. TNF optimally activatives regulatory T cells by inducing TNF receptor superfamily members TNFR2, 4-1BB, and OX40. Eur J Immunol. 2011;41(7):2010–2020. doi: 10.1002/eji.201041205. [DOI] [PMC free article] [PubMed] [Google Scholar]
- 41.Cao X, et al. Interleukin 12 stimulates IFN-gamma-mediated inhibition of tumor-induced regulatory T-cell proliferation and enhances tumor clearance. Cancer Res. 2009;69(22):8700–8709. doi: 10.1158/0008-5472.CAN-09-1145. [DOI] [PMC free article] [PubMed] [Google Scholar]
- 42.Dominguez-Villar M, Baecher-Allan CM, Hafler DA. Identification of T helper type 1-like, Foxp3(+) regulatory T cells in human autoimmune disease. Nat Med. 2011;17(6):673–675. doi: 10.1038/nm.2389. [DOI] [PMC free article] [PubMed] [Google Scholar]
- 43.Feng T, Cao AT, Weaver CT, Elson CO, Cong Y. Interleukin-12 converts Foxp3+ regulatory T cells to interferon-γ-producing Foxp3+ T cells that inhibit colitis. Gastroenterology. 2011;140(7):2031–2043. doi: 10.1053/j.gastro.2011.03.009. [DOI] [PMC free article] [PubMed] [Google Scholar]
- 44.Ruby CE, Montler R, Zheng R, Shu S, Weinberg AD. IL-12 is required for anti-OX40-mediated CD4 T cell survival. J Immunol. 2008;180(4):2140–2148. doi: 10.4049/jimmunol.180.4.2140. [DOI] [PubMed] [Google Scholar]
- 45.Medawar PB. Immunity to homologous grafted skin; the fate of skin homografts transplanted to the brain, to subcutaneous tissue, and to the anterior chamber of the eye. Br J Exp Pathol. 1948;29(1):58–69. [PMC free article] [PubMed] [Google Scholar]
- 46.Wilson EH, Weninger W, Hunter CA. Trafficking of immune cells in the central nervous system. J Clin Invest. 2010;120(5):1368–1379. doi: 10.1172/JCI41911. [DOI] [PMC free article] [PubMed] [Google Scholar]
- 47.Muldoon LL, et al. Chemotherapy delivery issues in central nervous system malignancy: a reality check. J Clin Oncol. 2007;25(16):2295–2305. doi: 10.1200/JCO.2006.09.9861. [DOI] [PubMed] [Google Scholar]
- 48.Lampson LA. Monoclonal antibodies in neuro-oncology: Getting past the blood-brain barrier. MAbs. 2011;3(2):153–160. doi: 10.4161/mabs.3.2.14239. [DOI] [PMC free article] [PubMed] [Google Scholar]
- 49.Reboldi A, et al. C-C chemokine receptor 6-regulated entry of TH-17 cells into the CNS through the choroid plexus is required for the initiation of EAE. Nat Immunol. 2009;10(5):514–523. doi: 10.1038/ni.1716. [DOI] [PubMed] [Google Scholar]
- 50.Tzeng JJ, Barth RF, Orosz CG, James SM. Phenotype and functional activity of tumor-infiltrating lymphocytes isolated from immunogenic and nonimmunogenic rat brain tumors. Cancer Res. 1991;51(9):2373–2378. [PubMed] [Google Scholar]
- 51.Sughrue ME, et al. Immunological considerations of modern animal models of malignant primary brain tumors. J Transl Med. 2009;7(1):84. doi: 10.1186/1479-5876-7-84. [DOI] [PMC free article] [PubMed] [Google Scholar]
- 52.Parsa AT, et al. Limitations of the C6/Wistar rat intracerebral glioma model: implications for evaluating immunotherapy. Neurosurgery. 2000;47(4):993–999. doi: 10.1097/00006123-200010000-00050. [DOI] [PubMed] [Google Scholar]
- 53.Volovitz I, et al. Split immunity: immune inhibition of rat gliomas by subcutaneous exposure to unmodified live tumor cells. J Immunol. 2011;187(10):5452–5462. doi: 10.4049/jimmunol.1003946. [DOI] [PubMed] [Google Scholar]
- 54.Hong JJ, et al. Successful treatment of melanoma brain metastases with adoptive cell therapy. Clin Cancer Res. 2010;16(19):4892–8. doi: 10.1158/1078-0432.CCR-10-1507. [DOI] [PMC free article] [PubMed] [Google Scholar]
- 55.Fontenot JD, et al. Regulatory T cell lineage specification by the forkhead transcription factor foxp3. Immunity. 2005;22(3):329–41. doi: 10.1016/j.immuni.2005.01.016. [DOI] [PubMed] [Google Scholar]
- 56.Ding Z-C, Blazar BR, Mellor AL, Munn DH, Zhou G. Chemotherapy rescues tumor-driven aberrant CD4+ T-cell differentiation and restores an activated polyfunctional helper phenotype. Blood. 2010;115(12):2397–2406. doi: 10.1182/blood-2009-11-253336. [DOI] [PMC free article] [PubMed] [Google Scholar]
- 57.Sedgwick JD, et al. Isolation and direct characterization of resident microglial cells from the normal and inflamed central nervous system. Proc Natl Acad Sci U S A. 1991;88(16):7438–7442. doi: 10.1073/pnas.88.16.7438. [DOI] [PMC free article] [PubMed] [Google Scholar]
- 58.Sun A, et al. Firefly luciferase-based dynamic bioluminescence imaging: a noninvasive technique to assess tumor angiogenesis. Neurosurgery. 2010;66(4):751–757. doi: 10.1227/01.NEU.0000367452.37534.B1. [DOI] [PMC free article] [PubMed] [Google Scholar]
- 59.Kjaergaard J, et al. Therapeutic efficacy of OX-40 receptor antibody depends on tumor immunogenicity and anatomic site of tumor growth. Cancer Res. 2000;60(19):5514–5521. [PubMed] [Google Scholar]
- 60.Sirotnak FM, Moccio DM, Dorick DM. Optimization of high-dose methotrexate with leucovorin rescue therapy in the L1210 leukemia and sarcoma 180 murine tumor models. Cancer Res. 1978;38(2):345–353. [PubMed] [Google Scholar]
Associated Data
This section collects any data citations, data availability statements, or supplementary materials included in this article.


