

Abstract
Glioblastomas (GBMs) are very aggressive tumors that are resistant to conventional chemo- and radiotherapy. New molecular therapeutic strategies are required to effectively eliminate the subpopulation of GBM tumor–initiating cells that are responsible for relapse. Since EGFR is altered in 50% of GBMs, it represents one of the most promising targets; however, EGFR kinase inhibitors have produced poor results in clinical assays, with no clear explanation for the observed resistance. We uncovered a fundamental role for the dual-specificity tyrosine phosphorylation–regulated kinase, DYRK1A, in regulating EGFR in GBMs. We found that DYRK1A was highly expressed in these tumors and that its expression was correlated with that of EGFR. Moreover, DYRK1A inhibition promoted EGFR degradation in primary GBM cell lines and neural progenitor cells, sharply reducing the self-renewal capacity of normal and tumorigenic cells. Most importantly, our data suggest that a subset of GBMs depends on high surface EGFR levels, as DYRK1A inhibition compromised their survival and produced a profound decrease in tumor burden. We propose that the recovery of EGFR stability is a key oncogenic event in a large proportion of gliomas and that pharmacological inhibition of DYRK1A could represent a promising therapeutic intervention for EGFR-dependent GBMs.
Introduction
High-grade gliomas (including glioblastomas – GBMs) are very aggressive primary brain tumors that are resistant to chemo- and radiotherapy (1). The current standard treatment for GBM includes aggressive surgical resection followed by administration of the alkylating agent, temozolomide, both concurrently and after radiotherapy. Bevacizumab, among other agents, is given as a second-line treatment after relapse (2, 3). However, this aggressive treatment is only palliative, as most deaths occur within 2 years of diagnosis, emphasizing the need to find new ways of effectively curing this cancer.
One approach is based on the cancer stem cell hypothesis. Several groups have demonstrated that there are significant differences in the differentiation status within a given GBM, with those cells resembling normal neural stem cells (NSCs) having a greater potential to initiate tumor formation and to maintain its growth (4–6). This subpopulation of cells is therefore often referred to as tumor-initiating cells (TICs). GBM-TICs share the expression of neural markers with NSCs, as well as their capacity for self-renewal and multipotent differentiation (7–9), and both of these cell types can be enriched in the same culture conditions (10). TICs have been associated with tumor relapse after therapy (11, 12) and with the invasive and proangiogenic capacity of GBM cells, two hallmarks of this type of tumor (13, 14). Therefore, therapeutic strategies that target GBM-TICs are of special interest.
The classical GBM view of mutation-driven tumors and the cancer stem cell hypothesis are reconcilable. Indeed, the key pathways in GBM (p53, PTEN, and pRB-p16) (8, 15) also play important roles in the biology of stem cells. A good example is the epidermal growth factor receptor (EGFR), one of the most prevalent genes altered in GBMs that is mutated and/or amplified in approximately 50% of primary tumors (16). EGF is one of the main mitogens for NSCs and, together with basic fibroblast growth factor (bFGF), it maintains the stem-like properties of both NSCs and GBM-TICs (10, 17). Indeed, it was recently shown that EGFR signaling directly controls the expression of stem cell features in GBMs (18) and that the presence of this receptor at the membrane could indicate a highly aggressive subpopulation of GBM-TICs (19). These findings reinforce the therapeutic potential of targeting EGFR in malignant gliomas.
Small-molecule tyrosine kinase (TK) inhibitors are the most clinically advanced EGFR-targeted agents to treat GBM. However, despite some initial reports on the partial efficacy of these TK inhibitors in patients with recurrent tumors (20), later studies have not been able to confirm their survival benefits (21, 22). Attempts to identify biomarkers that help predict response to EGFR inhibitors have also yielded conflicting results (22–24). It is not even clear if the levels of EGFR expression are correlated with GBM responsiveness to TK inhibitors (16), suggesting that the receptor may contribute to tumor growth independent of its kinase activity.
DYRK1A is a dual-specificity tyrosine phosphorylation–regulated kinase (DYRK) that plays an important role in the development of the central nervous system (CNS), influencing proliferation, neurogenesis, neuronal differentiation, cell death, and synaptic plasticity (25, 26). DYRK1A is also expressed in the adult brain and has been linked to cognitive deficits in neurodegenerative disorders and Down syndrome (27). Interestingly, both overexpression and downregulation of DYRK1A are associated with neurological defects, reflecting the extreme gene-dosage sensitivity of this protein. Our recent data show that DYRK1A is also implicated in the maintenance and expansion of NSC pools, its haploinsufficiency eliciting defects in the self-renewal capacity of NSCs from the subventricular zone (SVZ). Dyrk1A heterozygous SVZ contained fewer EGFR-positive cells, leading to diminished NSC activation in response to EGF. Our data indicate that DYRK1A prevents endocytotic degradation of EGFR through the phosphorylation of the EGFR-signaling modulator Sprouty2 (SPRY2) (28).
In the present study, we found that interfering DYRK1A compromised EGFR stability in established and primary GBM cell lines, affecting tumor growth and survival. We also characterize the important expression of DYRK1A in astrocytic tumors, especially in those that contain high levels of EGFR, and we confirm that DYRK1A inhibition promotes EGFR degradation. Moreover, DYRK1A determined the duration of receptor signaling, its inhibition strongly and irreversibly inhibiting self-renewal in receptor-dependent GBMs. Finally, we demonstrate that pharmacologically blocking DYRK1A kinase activity clearly impairs tumor growth in sensitive lines. We believe that our results allow us to propose, for the first time, that DYRK1A is a promising therapeutic target in GBMs, at least for those depending on EGFR signaling.
Results
DYRK1A modulates EGFR protein levels and the self-renewal of established GBM cell lines.
To understand the role of DYRK1A in GBMs, we first silenced this kinase in established cell lines, grown in the form of neurospheres. The loss of DYRK1A inhibited the self-renewal capacity of U87 and U373 cells, although it did not affect LN18 cells (Figure 1A). Moreover, DYRK1A inhibition strongly reduced the levels of EGFR, evident in Western blots of U87 and U373 cell extracts and as assessed by cytometry of puromycin-selected cells (Figure 1B). This reduction was produced by posttranslational modifications, as lentiviral shDYRK1A did not affect the expression of the EGFR gene (Supplemental Figure 1A; supplemental material available online with this article; doi: 10.1172/JCI63623DS1). The absence of an effect in LN18 cells could reflect the low levels of EGFR surface expression by this cell line (3.4 ± 0.2 % of positive cells) when compared with the sensitive cell lines. Furthermore, reducing DYRK1A did not influence BrdU incorporation in U87 cells (Supplemental Figure 1B), suggesting that it specifically modulates the self-renewal capacity of GBM cells as in normal NSCs (28).
Figure 1. DYRK1A interference affects the levels of EGFR and the tumorigenic capacity of established GBM cell lines.

(A) GBM cell lines were infected with the shControl or shDYRK1A lentivirus, and the capacity to form secondary spheres was measured. Bottom Western blot panels illustrate the inhibition of kinase expression. (B) Flow cytometric analysis of the percentage of EGFR-positive cells after lentiviral infection of 2 GBM cell lines. Bottom Western blot panels display the amount of total EGFR protein. (C) Images show representative vimentin staining of tumors formed after implantation of 10,000 puromycin-selected shControl- or shDYRK1A-infected U87 cells. Graphs on the right show the quantification of tumor volume. (D) Number of EGFR-positive cells per tumorigenic field, with representative images shown on the right. (E) Puromycin-selected shControl- or shDYRK1A-infected U87 cells (3 × 10⁶) were implanted into the flanks of nude mice. Tumor size was measured once every 4–5 days. Relative tumor volume = tumor volume measured/tumor volume at day 25. (F) Proportion of BrdU-positive cells in shControl and shDYRK1A tumor tissues. (G) Number of activated caspase 3–positive (Act. casp3-positive) cells in the tumor tissues. Scale bars: 800 μm (C); 50 μm (D). *P ≤ 0.05; **P ≤ 0.01; ***P ≤ 0.001.
DYRK1A influences U87 tumor growth.
We next assessed whether the effect of DYRK1A inhibition in vitro was reflected in the capacity of GBM neurospheres to form tumors. After checking DYRK1A downregulation, we orthotopically transplanted 10,000 puromycin-selected U87 cells infected with shControl or shDYRK1A lentivirus into nude mice. There were phenotypic signs of disease 6 weeks after intracranial injection, when the animals were sacrificed and the tumor cells detected with a human-specific vimentin antibody. The tumors generated by shDYRK1A cells were much smaller (80% reduction) than those generated by shControl cells (Figure 1C), and immunostaining revealed that shDYRK1A neoplastic tissue contained fewer EGFR-positive cells (Figure 1D), suggesting that DYRK1A downregulation affected EGFR stability in vivo. We performed a competition assay by transplanting a small number of GFP-labeled shControl cells (1,000 cells) along with shDYRK1A cells (9,000 cells), at a ratio of 1:9, into the brains of nude mice. The tumors that arose 1 month later contained approximately 60% of GFP-labeled cells (Supplemental Figure 2), supporting the notion of a lower tumorigenic capacity of cells with reduced levels of DYRK1A.
To further confirm that DYRK1A levels modulate tumor growth, 3 × 10⁶ U87 cells (shControl or shDYRK1A infected) were implanted subcutaneously into the flanks of nude mice. Notably, shDYRK1A cells did not form tumors in 2 of 6 animals, whereas shControl cells had a 100% penetrance rate in terms of tumor formation. Moreover, shDYRK1A tumors grew more slowly than their shControl counterparts, provoking a significant difference at the final endpoint (n = 6 [shControl], n = 4 [shDYRK1A]; P = 0.0381) (Figure 1E). Our analysis of the tumor tissue revealed that there was less proliferation in tissue in which DYRK1A interfered (Figure 1F) and significantly higher numbers of apoptotic cells (Figure 1G). Together, these data indicate that reducing the amount of DYRK1A affects EGFR levels and impairs the self-renewal capacity of GBM cells in vitro. Moreover, the results suggest that high levels of DYRK1A are necessary to maintain tumor growth and survival in vivo.
DYRK1A is strongly expressed in a subset of gliomas and its expression is correlated with EGFR levels.
Although several groups have reported that DYRK1A is expressed in the adult mammalian brain in both neurons and astrocytes (29, 30), this kinase has not been identified in astrocytic tumors. Given the strong effect of DYRK1A downregulation on glioma cell lines, we set out to explore the transcript levels of DYRK1A in normal tissue (obtained from surgery on epileptic patients) and in a panel of gliomas of different grades by quantitative RT-PCR (qRT-PCR). The results showed a higher expression of DYRK1A in gliomas (especially oligodendrogliomas [ODGs] and GBMs), although with a certain degree of variability among the tumors tested (Figure 2A).
Figure 2. DYRK1A is highly expressed in a subset of gliomas and correlates with EGFR expression.

(A) DYRK1A transcript levels were determined by RT-PCR in glioma samples and normal tissue (obtained during surgery on epileptic patients). HPRT expression was used for normalization. (B) Correlation between the levels of EGFR and DYRK1A transcription in the GBM samples. Spearman’s rank correlation parameters are presented in the box. (C) Relative DYRK1A expression in EGFR-amplified (amp) and wild-type (WT) GBM samples. (D) IHC images showing an unstained control and 5 representative images of DYRK1A staining of 4 different GBMs. Relative DYRK1A RT-PCR values are shown in the brackets. (E) Low-magnification images of DYRK1A and EGFR staining of 2 different GBMs. Areas of positive (red box) and negative (blue box) staining of both markers are shown at higher magnification. A, astrocytomas. Scale bars: 50 μm. *P ≤ 0.05; **P ≤ 0.01; ***P ≤ 0.001.
We investigated the expression of EGFR in the same tissue samples and, unsurprisingly, EGFR levels were very high in GBMs when compared with normal tissue, probably due to the high frequency of genomic amplification in such tumors (16). The EGFR gene was also strongly expressed in low-grade astrocytomas and even more so in ODGs, suggesting that increased EGFR expression was common in gliomas of different grades and that it was not only caused by gene amplification (Supplemental Figure 3), as proposed elsewhere (31). Intriguingly, there was a remarkable positive correlation between DYRK1A and EGFR mRNA levels in GBMs (Figure 2B), which was even stronger when gliomas of lower grades were also considered (Supplemental Figure 4). Indeed, DYRK1A expression was significantly higher in those GBMs that showed EGFR amplification (Figure 2C). These analyses suggest that there are 2 subgroups of GBMs with regard to DYRK1A presence.
To obtain more evidence of the relationship between DYRK1A and EGFR, we analyzed paraffin-embedded tumors by immunohistochemistry (IHC). GBM tumor cells exhibited heterogeneous labeling of DYRK1A, with positive areas of staining detected alongside negative ones. Overall, tumors with very low DYRK1A mRNA expression (GBM1) were almost entirely negative for DYRK1A staining, whereas DYRK1A-expressing tumors displayed many areas of positive IHC labeling (Figure 2D). Additionally, IHC analysis confirmed that most of the samples with positive DYRK1A staining also exhibited strong EGFR expression and that even within a given tumor, DYRK1A was found mostly in areas of strong EGFR staining (Figure 2E). Altogether, these data suggest that DYRK1A function is especially relevant for the EGFR-dependent subtype of GBMs.
DYRK1A interference suppresses the self-renewal capacity of GBM-TICs.
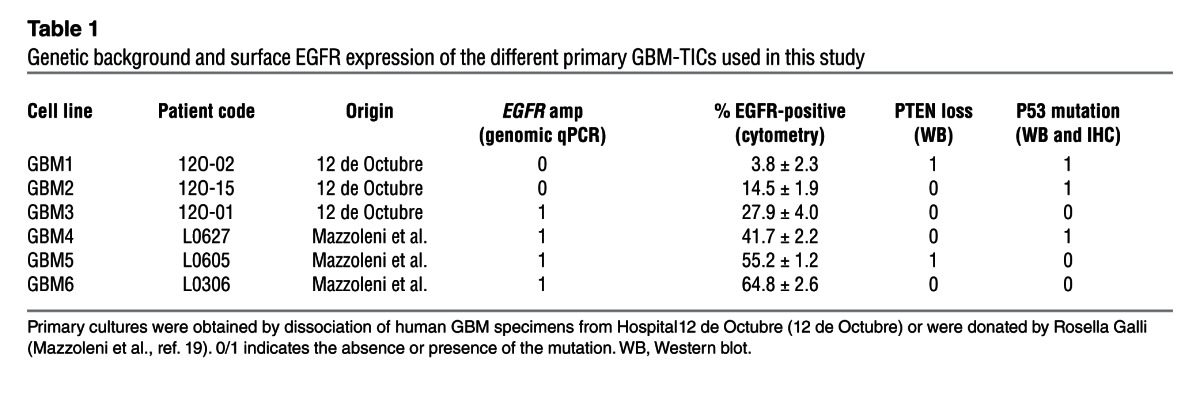
Considering the results of DYRK1A interference in GBM cell lines and the expression of this kinase in human tissue, we evaluated whether DYRK1A levels modulated the behavior of the TICs, enriched in neurosphere culture conditions, that are responsible for tumor growth and relapse (Figure 3A). All the primary lines used in this study could form tumors with high penetrance when injected into nude mice. The levels of membrane EGFR were measured by flow cytometry (Supplemental Figure 5), and 2 distinct subgroups of GBM lines were identified, as recently demonstrated, based on the different levels of EGFR surface expression (19). One of the lines used in this study had very low levels of EGFR (GBM1), whereas the rest had a higher proportion of EGFR-expressing cells, ranging from 15% to 65% (Table 1). DYRK1A expression was observed in all but 1 line (GBM1), as measured by Western blot analysis (Figure 3B) and RT-PCR (Figure 3C).
Figure 3. Characterization of the GBM-TICs used in this study.

(A) Representative phase-contrast images of the different GBM-TICs. (B) DYRK1A protein expression in some of the GBM-TIC lines and U87 cells. (C) DYRK1A transcriptional levels relative to HPRT. Expression of DYRK1A in normal tissue was used for normalization.
Table 1.
Genetic background and surface EGFR expression of the different primary GBM-TICs used in this study
To test DYRK1A function in GBM-TIC–enriched cell lines, we again used an RNA interference strategy. However, we were not able to downregulate DYRK1A in the primary cultures using lentiviral constructs and selection of stably-expressing shDYRK1A cells, so we decided to use a conditional approach. The expression of the red fluorescence protein (RFP) reporter was used to track infected cells. Incubation with doxycycline induced a partial reduction in DYRK1A mRNA levels (Figure 4A), which was correlated with a strong reduction in the amount of EGFR-expressing cells (Figure 4B) without altering the expression of EGFR transcripts (Figure 4C). Three days after shDYRK1A induction, the spheres were dissociated and plated again at a clonal dilution in the absence of doxycycline. DYRK1A interference clearly inhibited the self-renewal capacity of GBM4 and GBM5 cells, but not GBM1 cells, which did not express DYRK1A and have the lowest levels of EGFR (Figure 4D). These data suggest that DYRK1A levels are essential for the expansion of EGFR-expressing GBMs, as downregulation of DYRK1A irreversibly affected the clonal growth of TICs.
Figure 4. Conditional DYRK1A interference affects EGFR levels and the tumorigenic capacity of GBM-TICs.

(A) RT-PCR analysis of DYRK1A transcripts 3 days after shDYRK1A induction with doxycycline (Dox). (B) Flow cytometric analysis of the amount of EGFR-positive cells 3 days after shDYRK1A induction. (C) RT-PCR analysis of EGFR transcripts 3 days after shDYRK1A induction. (D) Quantification of the capacity to form secondary spheres after doxycycline removal. (E) 50,000 GBM5 cells infected with inducible shDYRK1A (GBM5-ishDYRK1A) cells were implanted intracranially into nude mice, and 3 weeks later, doxycycline (indicated with an arrow) was added to the drinking water of 1 group of mice. Animal survival was evaluated using a Kaplan-Meier survival curve, and the differences in survival times were analyzed with a log-rank test (n = 4; P = 0.0316). (F) GBM5-ishDYRK1A cells (3.5 × 10⁶) were injected into the flanks of nude mice. Two weeks later, doxycycline was added to the drinking water of 1 group of mice, and tumor size was measured once every 4–5 days. Graph represents the tumor volume after doxycycline addition. (G) Western blot analysis of DYRK1A and EGFR protein levels in control and doxycycline-treated tumors. (H) RT-PCR analysis of DYRK1A and EGFR transcript levels in control and doxycycline-treated tumors. (I) Number of BrdU-positive cells in the flank tumors. (J) Amount of cells with activated caspase 3 in the flank tumors. *P ≤ 0.05; **P ≤ 0.01; ***P ≤ 0.001.
DYRK1A interference suppresses the tumorigenic capacity of GBM-TICs.
To address whether the effect of DYRK1A inhibition observed in vitro translated into a decreased capacity of primary GBM cells to form tumors, 50,000 puromycin-selected shDYRK1A-infected GBM5 cells were transplanted into the brains of nude mice. Three weeks later, the mice were divided into 2 groups, with doxycycline being administered to one of the groups. Kaplan-Meier analysis demonstrated that DYRK1A downregulation prolonged the survival of the GBM-bearing animals. (Figure 4E). To further analyze the effect of DYRK1A interference on the growth of GBM-TICs in vivo, we injected 3.5 × 10⁶ infected cells into the flanks of nude mice, and when tumors reached a minimal volume, the animals were separated into 2 groups: control and doxycycline-treated mice, and were followed for 3 additional weeks before tumor analysis. Since tumors from the doxycycline-treated animals were much smaller at the final endpoint, this approach demonstrated that the induction of shDYRK1A clearly inhibited tumor progression (Figure 4F and Supplemental Figure 6). Subsequent analysis of the tumor tissue confirmed the downregulation of DYRK1A protein after doxycycline treatment, which correlated with a significant reduction in EGFR protein (Figure 4G) but not of EGFR mRNA transcripts (Figure 4H). As in U87 cells, BrdU was incorporated at a much lower level into shDYRK1A tumors (Figure 4I), and we observed a clear induction of apoptosis (Figure 4J). These results indicate that DYRK1A controls GBM-TIC expansion in vivo and that silencing this kinase prevents GBM growth and survival, thereby decreasing the tumor burden.
Pharmacological inhibition of DYRK1A kinase activity blocks the self-renewal capacity of GBM-TICs and impairs tumor burden.
To explore the therapeutic potential of DYRK1A, it was important to clarify whether its kinase activity was necessary for the self-renewal of normal and tumorigenic stem cells. Therefore, we assessed the influence of DYRK1A inhibitor, the β-carboline alkaloid known as harmine (32) (shown to work in vivo; ref. 33). We first tested the effects of harmine on the growth properties of SVZ-NSCs. Interestingly, harmine (20 μm) had only a small effect on gross viability (Figure 5A), but it significantly inhibited the formation of secondary spheres (grown in the absence of the drug; Figure 5B) without affecting BrdU incorporation (Figure 5C). These results confirm our previous findings and further prove that pharmacological inhibition of DYRK1A inhibits stem cell behavior (28).
Figure 5. Harmine impairs the self-renewal capacity of SVZ-NSCs.

(A) SVZ neurospheres were treated for 2 days in the presence of different concentrations of harmine, and cell viability was measured with a colorimetric WST-1 assay. Percentage of inhibition is represented in the graph. (B) Formation of secondary spheres after pretreatment with harmine (20 μm for 2 days). **P ≤ 0.01. (C) Percentage of BrdU-positive cells in control and harmine-treated cells.
To determine whether DYRK1A inhibition affected the behavior of gliomas, GBM-TIC lines were maintained in the presence of harmine for 3 days, before isolating single cells from dissociated spheres and replating them at clonal densities in the absence of the drug. Harmine significantly inhibited self-renewal in most of the primary lines (Figure 6A). As shown in Figure 6B, similar effects were obtained with another DYRK1A inhibitor, INDY, a benzothiazole compound (34). Notably, neither harmine nor INDY greatly suppressed self-renewal in the DYRK1A-negative GBM1.
Figure 6. Pharmacological inhibition of DYRK1A impairs the self-renewal capacity of EGFR-expressing GBM-TICs.

GBM primary cells were incubated in the presence of (A) harmine or (B) INDY, and 3 days later, the spheres were dissociated and replated in the absence of the drug. A 20-μm concentration was chosen based on SVZ-NSC behavior (Figure 5A and Supplemental Figure 7). The number of secondary spheres is represented in the graphs. (C) 50,000 GBM5 cells were implanted intracranially into nude mice. Two weeks later, the animals started to receive i.p. injections of saline (Control) or harmine (15 mg/kg/day, 5 days per week; indicated by an arrow). Animal survival was evaluated using a Kaplan-Meier survival curve, and the differences in survival times were analyzed with a log-rank test (n = 5; P = 0.09). (D) Number of mitotic cells in control or harmine-treated tumor tissue. (E) Representative images of activated caspase 3 staining in control and harmine-treated tumor tissue. (F) Representative images of EGFR staining in control and harmine-treated tumor tissue. (G) Correlation between the amount of membrane EGFR present in the different GBM-TIC lines and the percentage of self-renewal inhibition induced by harmine. (H) Percentage of self-renewal inhibition induced by harmine in low- or high-passage GBM3 cells. Western blot on the right shows the amount of EGFR and DYRK1A expressed by low- and high-passage GBM3 cells. Scale bar: 40 μm. *P ≤ 0.05; **P ≤ 0.01; ***P ≤ 0.001.
To further prove the oncogenic capacity of DYRK1A and determine the potential therapeutic benefit of targeting its activity in GBM-TICs, we injected 50,000 GBM5 cells into the brains of nude mice. Two weeks later, the animals were treated systemically with harmine (15 mg/kg/day, 5 days per week) or vehicle alone (saline), and their survival rates were monitored. A Kaplan-Meier analysis suggested that there is a protective effect of harmine, though it did not reach significance (Figure 6C). Unfortunately, we could not test higher doses of the drug, as they caused tremors in the animals due to the drug’s ability to target monoamine oxidase (35). Nevertheless, after harmine treatment, brain tumors showed a clear reduction in cell proliferation (Figure 6D), as well as the appearance of numerous apoptotic areas (Figure 6E). Interestingly, harmine-treated tissue also showed a clear decrease in EGFR staining (Figure 6F). Therefore, DYRK1A kinase activity regulated the survival of TICs and the oncogenic capacity of EGFR-dependent GBMs.
The effect of harmine on GBM-TIC self-renewal depends on EGFR expression.
We investigated the genetic background of our panel of GBM-TIC lines in an attempt to identify any specific pattern that could predict the response to DYRK1A inhibition, other than the presence of the protein itself in the tumor cells. We found that harmine could inhibit secondary clonal formation, regardless of PTEN deficiency or p53 mutations (Table 1), two classic GBM alterations. However, there was a very significant positive correlation between surface EGFR expression and harmine sensitivity (Figure 6G). This strongly reinforces the hypothesis that DYRK1A function modulates self-renewal of EGFR-dependent GBMs, as suggested by our earlier studies. To further confirm this proposal, we used one of the GBM-TIC lines (GBM3) that loses EGFR gene amplification and protein expression after long-term culture (without other major genomic changes) (Figure 6H and data not shown), a phenomenon that has been documented in other primary GBM cultures (36). Interestingly, the self-renewal capacity of low-passage GBM3 cells was inhibited in the presence of harmine, although no significant changes were observed in high-passage EGFR-negative cells (Figure 6H). These data concur with our previous observation that shDYRK1A did not inhibit clonal growth of LN18 cells, which do not express EGFR at the membrane (Figure 1A). It also suggests that the main effect of DYRK1A inhibition in GBM cells is mediated through EGFR regulation.
DYRK1A controls EGFR turnover in GBM-TICs.
DYRK1A interference appears to diminish the amount of EGFR protein without affecting mRNA levels and, indeed, harmine incubation accelerated receptor degradation in the presence of EGF in SVZ-NSCs (Figure 7A), consistent with our earlier observations (28). Therefore, we checked whether this mechanism was conserved in GBM cells. Both DYRK1A interference (Supplemental Figure 8) and pharmacological inhibition (Figure 7, B and C) accelerated the rate of EGFR degradation following EGF stimulation in the presence of cycloheximide. In agreement with these results, there was a clear increase in the amount of receptors targeted to lysosomes after EGF induction in harmine-treated cells as opposed to that seen in untreated GBM cells (Figure 7D). Intriguingly, expression of the nonlysosomal-targeted EGFRvIII isoform in U87 cells could not rescue the inhibition of EGFR signaling (Supplemental Figure 9A) or the suppression of self-renewal induced by harmine (Supplemental Figure 9B). This suggests that even in the presence of the mutation, GBM self-renewal depends on full-length receptor signaling, as suggested previously (37). In addition, exposure of GBM-TICs to harmine favored the termination of EGFR signaling, though with some differences between GBM lines, which appear to depend on their genetic background. For instance, harmine mainly affected AKT phosphorylation kinetics in the GBM4 line, whereas in the PTEN-deficient GBM5 line, the kinetics of phospho-ERK1/ERK2 was affected, with no clear effect on AKT activation (Figure 7C). These results indicate that DYRK1A inhibition alters the duration of EGFR signaling and suggest that the kinetics of EGFR turnover determines GBM behavior.
Figure 7. DYRK1A inhibition stimulates EGFR lysosomal degradation and termination of EGF signaling.

Western blot analysis of SVZ-NSCs (A) or U87 cells (B) that were deprived of growth factors for 12 hours and then exposed to EGF for the indicated durations in the presence or absence of harmine. Quantification of EGFR levels relative to β-actin is shown in the bottom graphs. (C) Western blot analysis of the EGFR signaling pathway after EGF stimulation of 2 different GBM-TIC lines in the presence or absence of harmine. Quantification of EGFR, p-AKT, and p-ERK1/2 levels relative to β-actin is shown on the right. (D) GBM-TICs were preincubated in the presence or absence of harmine. Four hours later, EGF Alexa488 was added and the cells were fixed at t = 0 or t = 1 hour, 30 minutes. Representative confocal images of EGFR lysosomal targeting in GBM4 cells are shown. Quantification of the yellow dots for 2 different GBM-TIC lines is represented by the graph on the right. *P ≤ 0.05. Scale bar: 25 μm.
SPRY2 overexpression reverses the effect of DYRK1A inhibition on EGFR stability and GBM-TIC self-renewal.
The mechanism of DYRK1A action appears to be similar in normal NSCs and GBM-TICs. We previously demonstrated that DYRK1A promoted EGFR stability in NSCs through the phosphorylation of SPRY2 (28), a protein that influences receptor turnover through the sequestering of the ubiquitin ligase C-CBL (38). To assess whether similar effects were produced in GBM cells, SPRY2 was overexpressed in GBM-TICs (Figure 8A), and the effect of DYRK1A kinase inhibition was analyzed for clonal growth and EGFR stability. The influence of harmine on EGFR turnover was significantly impaired in the cells overexpressing SPRY2 (Figure 8B), suggesting that DYRK1A functions upstream of this protein. More importantly, SPRY2 expression reversed the suppression of self-renewal induced by harmine (Figure 8C), demonstrating that DYRK1A controls GBM-TIC self-renewal by maintaining higher levels of EGFR at the membrane and inhibiting the termination of its downstream signal.
Figure 8. SPRY2 overexpression reverses the effect of harmine on EGFR degradation and GBM-TIC self-renewal.

(A) GBM5-TICs were infected with control or SPRY2-expressing retrovirus and 48 hours later, the cells were analyzed by Western blotting. (B) Control or SPRY2-expressing GBM5-TICs were deprived of growth factors for 12 hours and then EGF was added in the presence of harmine for the indicated durations. EGFR in the cells was analyzed by Western blotting. (C) Twenty-four hours after retroviral infection of GBM5-TICs, the cells were incubated in the presence or absence of harmine for 3 days. Dissociated cells were plated in the absence of the drug, and the number of secondary spheres formed was counted. ***P ≤ 0.001.
Discussion
Mutations and/or overexpression of EGFR are the most common alterations in GBMs, and they have been associated with tumor initiation and growth, as well as with resistance to chemo- and radiotherapy (39, 40). However, though EGFR kinase inhibitors are useful in treating other types of tumors, they offer poor results in GBM patients. Moreover, the type of EGFR mutations in GBMs often involve deletions in the extracellular domain or cytoplasmic tail, whereas mutations in the kinase domain that are commonly found in lung cancer, for example, are rare in GBMs (41). These results underline the special nature of the EGFR oncogenic network in these neoplasms and suggest that alternative strategies must be adopted to effectively target this signaling pathway in high-grade gliomas. Our data indicate that DYRK1A is a key therapeutic target for a subset of GBMs (those that are EGFR dependent), and we demonstrate that DYRK1A inhibition increases the amount of EGFR targeted for degradation, which causes a large percentage of GBM-TICs to lose their self-renewal potential in vitro and their tumorigenic capacity in vivo.
Several possibilities have been proposed to explain the resistance of GBMs to EGFR inhibitors: coactivation of compensatory pathways, upregulation of escape genes, the presence of permanently active mutations (like EGFRvIII (16, 42), or the fact that first-generation TK inhibitors do not bind to the inactive EGFR conformation that is predominant in GBM cells (43, 44). Additionally, EGFR inhibition has been reported to impair GBM cell proliferation more than it impairs survival, and this effect on GBM-TICs is reversible as tumor cells recover their self-renewal capacity after drug removal (45). More recently, it was proposed that reducing EGFR levels (but not TK inhibition) induces autophagic cancer cell death through modulation of glucose transport (46). The data presented here suggest that DYRK1A blockade exerts an irreversible effect on GBM cells, since they lose their clonogenic capacity even after removing the pharmacological inhibitors or the shRNA inducer. Without ruling out the possibility that DYRK1A affects other signaling pathways in the GBM-TICs, our data show that the blockade inhibits EGFR stability, and therefore targeting EGFR for degradation could be more effective than inhibiting its kinase activity. In fact, a kinase-defective EGFR can stimulate DNA synthesis (47) and enhance cell survival (48). In this regard, it was proposed that one potential mode of action of the monoclonal antibodies directed against EGFR, which are currently undergoing phase III trials for glioma treatment, may involve their ability to target EGFR for lysosomal degradation (49). We propose that small molecules targeting DYRK1A kinase activity could be a good strategy for inhibiting EGFR stability. We used the β-carboline alkaloid harmine (32) and INDY, a benzothiazole compound (34), with harmine being able to inhibit GBM tumor growth and survival. Harmine and INDY have been shown to bind to the ATP pocket of DYRK1A and inhibit its kinase activity (50). They have limited use in vivo, however, as systemic INDY treatment does not reach the brain and harmine is a potent inhibitor of monoamine oxidase (35). However, molecular docking analysis showed that harmine has many degrees of freedom in the ATP-binding pocket of DYRK1A and that this could be exploited to more selectively inhibit the kinase (50).
Our data support the notion that maintaining high levels of EGFR at the membrane is a key oncogenic event, at least in a subset of GBMs. EGFR (also called ErbB1) belongs to the family of ErbB proteins, whose members differ in their signaling potency depending on distinct mechanisms that negatively regulate the receptor’s fate. For example, only EGFR is strongly coupled to the C-CBL adaptor protein, and unlike other ErbB members, it is effectively targeted for lysosomal degradation (51). Impaired endocytic downregulation of receptors is frequently associated with cancer. Indeed, dominant-negative forms of CBL are found as oncogenes in human myeloid neoplasms (52). However, no such mutations have been found in GBMs, although the 19q13 allele containing C-CBL is frequently lost in these tumors (53). More recently, the transmembrane glycoprotein LRIG1 has been found to be attenuated in many astrocytomas and to control CBL recruitment and EGFR downregulation (54); also, LRIG1, which controls CBL recruitment and EGFR downregulation, has been found to be attenuated in many astrocytomas (54). Likewise, a molecule that targets EGFR to lysosomal degradation, MIG6, inhibits anchorage-independent GBM growth and is frequently deleted in these tumors (56). Thus, like DYRK1A inhibition, upregulation of LRIG1 or MIG6 limits the activation of EGFR and causes a strong inhibition of GBM-TIC self-renewal in vitro and impairs tumor survival in vivo, which reinforces the therapeutic potential of targeting EGFR stability in a subset of GBMs.
Our biochemical results suggest that DYRK1A functions upstream of SPRY2 to modulate EGFR lysosomal targeting and GBM-TIC self-renewal. These results are consistent with our previous findings in normal neural progenitors (28). SPRY2 belongs to a family of growth factor–mediated mitogen-activated protein kinase (MAPK) modulators. Paradoxically, SPRY2 also exerts a positive effect on EGFR signaling through its interaction with proteins like C-CBL and the hepatocyte growth factor–regulated tyrosine kinase substrate (HRS), which are involved in the endocytosis and degradation of EGFR (38). Phosphorylation of SPRY2 on THR75 by DYRK1A dampens its inhibitory influence on FGF-induced MAPK activation (57). This phosphorylation could potentially regulate SPRY2 binding to regulatory proteins and help discriminate between the EGF and FGF signaling pathways, as described for other residues (58, 59). Although SPRY2 is a tumor suppressor in different types of cancer, it has a tumor-promoting activity in colon cancer (60). In GBMs, several members of the SPRY family are included in a transcriptome module that was associated with the EGFR amplification status in GBMs (61), suggesting that they could act as oncogenes in at least a subset of glial tumors. Further studies are necessary to explore the DYRK1A-SPRY2 interaction in GBMs, as well as in other types of cancers that might be EGFR dependent.
Our data illustrate that DYRK1A inhibition has a direct effect on GBM-TICs, controlling their self-renewal capacity, although there were small discrepancies between the effects of DYRK1A inhibition in vivo and in vitro. There was a clear blocking of proliferation and the appearance of apoptotic cells in mouse xenografts after DYRK1A suppression, whereas no such effects were detected in the GBM-TIC cultures. DYRK1A levels have been shown to modulate the apoptosis of retinal ganglion cells during development through a regulatory phosphorylation of caspase 9 (33), and it is therefore possible that it also has a protective role in the tumor environment. Moreover, we cannot rule out the possibility that DYRK1A has a paracrine effect in tumors and that it could participate in other aspects of GBM biology, like angiogenesis. It is worth noting that harmine-containing plants have been used as traditional medicine in anticancer therapy. Furthermore, harmine has been shown to inhibit neovessel formation in vitro and in vivo through the regulation of several angiogenic factors and inflammatory cytokines (62). Although it is not known if DYRK1A is the direct mediator of such effects, future studies are needed to ascertain the role of DYRK1A in apoptosis or tumor vessel formation in glial tumors and whether its activity involves EGFR stability.
In recent years, much effort has been made to elucidate the molecular alterations in GBMs and has resulted in a large number of novel, targeted molecular therapies. However, none of these has translated into clinical benefits. The case of EGFR is an exemplary one, in that the therapeutic response was minimal despite the high expectations that EGFR kinase inhibitors would provide important clinical benefits. Here, we propose that recovery of EGFR stability (more than kinase activity per se) is an essential oncogenic event in a large percentage of GBMs. Several molecules can modulate the cell surface expression of EGFR, but none of them can be as easily targeted as DYRK1A. Therefore, targeting this kinase with small molecules, alone or in combination with EGFR inhibitors or DNA-damaging agents, could be extremely beneficial in treating EGFR-dependent GBMs.
Methods
Patients and tumor samples
Samples from patients diagnosed with brain tumors were provided by the Hospital de Madrid Tumor Bank Network, Hospital Universitario 12 de Octubre (Madrid, Spain) and Hospital Universitario La Fe (Valencia, Spain).
Primary lines and culture conditions
GBM1, GBM2, and GBM3 were obtained by cell dissociation of human GBM surgical specimens from patients treated at the “Hospital 12 de Octubre” (Madrid, Spain). Fresh tissue samples were digested enzymatically using Accumax (Millipore), and the isolated cells were purified by a Ficoll gradient (GE Healthcare) and plated at a density of 50,000 cells per milliliter in culture medium consisting of Neurobasal (Invitrogen) supplemented with B27 (1:50) (Invitrogen); GlutaMAX (1:100) (Invitrogen); penicillin-streptomycin (1:100:Lonza); 0.4% heparin (Sigma-Aldrich); and 40 ng/ml EGF and 20 ng/ml bFGF2 (complete medium; Peprotech). The GBM4, GBM5, and GBM6 primary lines were provided by Rosella Galli (San Raffaele Scientific Institute, Milan, Italy) (19), while the U87, U373, and LN18 cell lines were obtained from the ATCC. All human cell lines were grown in complete medium and were passaged after enzymatic disaggregation using Accumax (Millipore). Mouse SVZ primary neural stem cell cultures were obtained as described previously (63) and cultured in complete medium supplemented with 20 ng/ml EGF and 10 ng/ml bFGF2.
Reagents
Harmine hydrochloride (TCI Europe) and INDY (34) were resuspended in water and DMSO, respectively. They were used at a final concentration of 20 μM unless otherwise noted. PCR primers and antibodies used throughout the study are listed in Supplemental Tables 1 and 2.
Retroviral and lentiviral vectors
The lentiviral vectors pLKO.1-shRNASCRAMBLE and pLKOshDYRK1A (Sigma-Aldrich) were used for the stable DYRK1A interference. For DYRK1A–inducible interference, the pTRIPZ lentiviral shRNAmir (V3THS-376671 clone) was used (Open Biosystems). Infected cells were selected with 1 μg/ml of puromycin, and shRNAmir expression was induced by 1 μg/ml of doxycycline (Sigma-Aldrich). Retroviral vectors used were: pLPCX (Clontech), pLPCX-SPRY2 (a gift from J.M. Rojas, ISCIII, Madrid, Spain), MSCV-PIG, and MSCV-EGFRvIII (Addgene).
EGFR degradation assays
Growth factor–starved NSC and GBM cells were incubated in the presence or absence of doxycycline (12 hours) or harmine (4 hours). Cycloheximide (30 μg/ml; Sigma-Aldrich) was added to the cells and 1 hour later, EGF (100 ng/ml) was added for the indicated durations. The cells were chilled on ice and cell pellets were processed for Western blot analysis.
EGFR lysosomal targeting
Growth factor–starved primary cultures were incubated in the presence or absence of harmine (20 μM) for 3 hours. Afterwards, 100 ng/ml of Alexa Fluor 488–conjugated EGF (Invitrogen) and 50 nM of LysoTracker Red (Invitrogen) were added, and cells were incubated at 4°C for 30 minutes. The cultures were then washed twice with cold PBS and either fixed immediately (t = 0) or incubated at 37°C in 5% CO2 for an additional 90 minutes to allow EGFR internalization before fixing. DAPI (0.1 μg/ml) was used to stain the nuclei. Fluorescence images were obtained on a confocal microscopy (Leica TCS SP5 AOBS) and yellow colocalization spots were quantified.
Mouse xenograft assays
Orthotopic xenografts.
Stereotactically guided intracranial injections in athymic nude Foxn1nu mice (Harlan Iberica) were performed by administering 10,000 (U87) to 50,000 (primary lines) cells resuspended in 2 μl of culture medium. The injections were made into the striatum (coordinates: A-P, –0.5 mm; M-L, +2 mm; D-V, –3 mm; related to Bregma) using a Hamilton syringe, and the animals were sacrificed at the onset of symptoms.
Heterotopic xenografts.
Cells (3 × 10⁶) were resuspended 1:1 in culture media and Matrigel (BD) and then subcutaneously injected into athymic nude Foxn1nu mice. The tumor volume was measured with a caliper when it reached a visible size.
Mouse drug treatments
Harmine treatment.
Two weeks after intracranial injection, mice were treated with harmine (15 mg/kg/day) or vehicle (saline) i.p. until they were sacrificed.
Doxycycline treatment.
Mice were given 2 mg/ml doxycycline in their drinking water at the indicated times.
Statistics
A Kruskal-Wallis test was used to analyze the expression of DYRK1A and EGFR in the human samples. A Spearman’s correlation test was used to assess the relationship between the expression of DYRK1A and EGFR. The survival of nude mice was analyzed by the Kaplan-Meier method and evaluated with a 2-sided log-rank test. A 2-tailed Student’s t test was performed for statistical analysis of the in vitro studies. The data in the graphs are presented as the means ± SEM. *P ≤ 0.05; **P ≤ 0.01; ***P ≤ 0.001. Statistical values of P > 0.05 were not considered significant.
Study approval
The present studies with animals and human samples were reviewed and approved by the Research Ethics and Animal Welfare Committee at the Instituto de Salud Carlos III, Madrid, in agreement with the European Union and national directives. The human tissues were procured after obtaining the patients’ written consent and with the approval of the ethics committees of each participating hospital (Clinical Research Ethics Committee from Hospital Universitario 12 de Octubre, Madrid; Hospital Universitario La Fe, Valencia; and Hospital de Madrid, Madrid).
Further information can be found in the Supplemental Methods.
Supplementary Material
Acknowledgments
We thank R. Galli for providing the primary GBM lines, J.M.Rojas for providing the SPRY2 plasmids, and S. de la Luna and A. Ruiz i Altaba for helpful comments. We also thank R. Pérez and F. González for helping with the mouse histology and confocal images, respectively. This work was supported by grants from the Ministerio de Educación y Ciencia (MEC; SAF2008-04531), the Ministerio de Ciencia e Innovación (MICINN, PLE2009-0115), and the Ministerio de Asuntos Exteriores y Cooperación (MAEC-AECID A/023963/09; to P. Sánchez-Gómez), as well as by grants from the Fondo de Investigación Sanitaria (FIS-PS09-01977) and Fundación Mutua-madrileña grants (FMM 2007/057, to J.R. Ricoy; and FMM2011/89, to J.M. Sepúlveda).
Footnotes
Conflict of interest: The authors have declared that no conflict of interest exists.
Citation for this article: J Clin Invest. 2013;123(6):2475–2487. doi:10.1172/JCI63623.
References
- 1.Louis DN, Ohgaki H, Wiestler OD, Cavenee WK. WHO Classification of Tumours of the Central Nervous System. 4th ed. Lyon, France: International Agency for Research on Cancer; 2007. [Google Scholar]
- 2.Stupp R, et al. Radiotherapy plus concomitant and adjuvant temozolomide for glioblastoma. N Engl J Med. 2005;352(10):987–996. doi: 10.1056/NEJMoa043330. [DOI] [PubMed] [Google Scholar]
- 3.Chamberlain MC. Emerging clinical principles on the use of bevacizumab for the treatment of malignant gliomas. Cancer. 2010;116(17):3988–3999. doi: 10.1002/cncr.25256. [DOI] [PubMed] [Google Scholar]
- 4.Singh SK, et al. Identification of human brain tumour initiating cells. Nature. 2004;432(7015):396–401. doi: 10.1038/nature03128. [DOI] [PubMed] [Google Scholar]
- 5.Galli R, et al. Isolation and characterization of tumorigenic, stem-like neural precursors from human glioblastoma. Cancer Res. 2004;64(19):7011–7021. doi: 10.1158/0008-5472.CAN-04-1364. [DOI] [PubMed] [Google Scholar]
- 6.Yuan X, et al. Isolation of cancer stem cells from adult glioblastoma multiforme. Oncogene. 2004;23(58):9392–9400. doi: 10.1038/sj.onc.1208311. [DOI] [PubMed] [Google Scholar]
- 7.Sutter R, Yadirgi G, Marino S. Neural stem cells, tumour stem cells and brain tumours: dangerous relationships? Biochim Biophys Acta. 2007;1776(2):125–137. doi: 10.1016/j.bbcan.2007.07.006. [DOI] [PubMed] [Google Scholar]
- 8.Nicolis SK. Cancer stem cells and “stemness” genes in neuro-oncology. Neurobiol Dis. 2007;25(2):217–229. doi: 10.1016/j.nbd.2006.08.022. [DOI] [PubMed] [Google Scholar]
- 9.Dirks PB. Brain tumor stem cells: the cancer stem cell hypothesis writ large. Mol Oncol. 2010;4(5):420–430. doi: 10.1016/j.molonc.2010.08.001. [DOI] [PMC free article] [PubMed] [Google Scholar]
- 10.Lee J, et al. Tumor stem cells derived from glioblastomas cultured in bFGF and EGF more closely mirror the phenotype and genotype of primary tumors than do serum-cultured cell lines. Cancer Cell. 2006;9(5):391–403. doi: 10.1016/j.ccr.2006.03.030. [DOI] [PubMed] [Google Scholar]
- 11.Bao S, et al. Glioma stem cells promote radioresistance by preferential activation of the DNA damage response. Nature. 2006;444(7120):756–760. doi: 10.1038/nature05236. [DOI] [PubMed] [Google Scholar]
- 12.Beier D, Schulz JB, Beier CP. Chemoresistance of glioblastoma cancer stem cells — much more complex than expected. Mol Cancer. 2011;10:128. doi: 10.1186/1476-4598-10-128. [DOI] [PMC free article] [PubMed] [Google Scholar]
- 13.Wang R, et al. Glioblastoma stem-like cells give rise to tumour endothelium. Nature. 2010;468(7325):829–833. doi: 10.1038/nature09624. [DOI] [PubMed] [Google Scholar]
- 14.Ricci-Vitiani L, et al. Tumour vascularization via endothelial differentiation of glioblastoma stem-like cells. Nature. 2010;468(7325):824–828. doi: 10.1038/nature09557. [DOI] [PubMed] [Google Scholar]
- 15.Stiles CD, Rowitch DH. Glioma stem cells: a midterm exam. Neuron. 2008;58(6):832–846. doi: 10.1016/j.neuron.2008.05.031. [DOI] [PubMed] [Google Scholar]
- 16.Lo HW. EGFR-targeted therapy in malignant glioma: novel aspects and mechanisms of drug resistance. Curr Mol Pharmacol. 2010;3(1):37–52. doi: 10.2174/1874467211003010037. [DOI] [PMC free article] [PubMed] [Google Scholar]
- 17.Soeda A, et al. Epidermal growth factor plays a crucial role in mitogenic regulation of human brain tumor stem cells. J Biol Chem. 2008;283(16):10958–10966. doi: 10.1074/jbc.M704205200. [DOI] [PubMed] [Google Scholar]
- 18.Jin X, et al. EGFR-AKT-Smad signaling promotes formation of glioma stem-like cells and tumor angiogenesis by ID3-driven cytokine induction. Cancer Res. 2011;71(22):7125–7134. doi: 10.1158/0008-5472.CAN-11-1330. [DOI] [PubMed] [Google Scholar]
- 19.Mazzoleni S, et al. Epidermal growth factor receptor expression identifies functionally and molecularly distinct tumor-initiating cells in human glioblastoma multiforme and is required for gliomagenesis. Cancer Res. 2010;70(19):7500–7513. doi: 10.1158/0008-5472.CAN-10-2353. [DOI] [PubMed] [Google Scholar]
- 20.Raizer JJ. HER1/EGFR tyrosine kinase inhibitors for the treatment of glioblastoma multiforme. J Neurooncol. 2005;74(1):77–86. doi: 10.1007/s11060-005-0603-7. [DOI] [PubMed] [Google Scholar]
- 21.Peereboom DM, et al. Phase II trial of erlotinib with temozolomide and radiation in patients with newly diagnosed glioblastoma multiforme. J Neurooncol. 2010;98(1):93–99. doi: 10.1007/s11060-009-0067-2. [DOI] [PubMed] [Google Scholar]
- 22.van den Bent MJ, et al. Randomized phase II trial of erlotinib versus temozolomide or carmustine in recurrent glioblastoma: EORTC brain tumor group study 26034. J Clin Oncol. 2009;27(8):1268–1274. doi: 10.1200/JCO.2008.17.5984. [DOI] [PMC free article] [PubMed] [Google Scholar]
- 23.Mellinghoff IK, et al. Molecular determinants of the response of glioblastomas to EGFR kinase inhibitors. N Engl J Med. 2005;353(19):2012–2024. doi: 10.1056/NEJMoa051918. [DOI] [PubMed] [Google Scholar]
- 24.Haas-Kogan DA, et al. Epidermal growth factor receptor, protein kinase B/Akt, and glioma response to erlotinib. J Natl Cancer Inst. 2005;97(12):880–887. doi: 10.1093/jnci/dji161. [DOI] [PubMed] [Google Scholar]
- 25.Aranda S, Laguna A, de la LS. DYRK family of protein kinases: evolutionary relationships, biochemical properties, and functional roles. FASEB J. 2011;25(2):449–462. doi: 10.1096/fj.10-165837. [DOI] [PubMed] [Google Scholar]
- 26.Tejedor FJ, Hammerle B. MNB/DYRK1A as a multiple regulator of neuronal development. FEBS J. 2011;278(2):223–235. doi: 10.1111/j.1742-4658.2010.07954.x. [DOI] [PubMed] [Google Scholar]
- 27.Wegiel J, Gong CX, Hwang YW. The role of DYRK1A in neurodegenerative diseases. FEBS J. 2011;278(2):236–245. doi: 10.1111/j.1742-4658.2010.07955.x. [DOI] [PMC free article] [PubMed] [Google Scholar]
- 28.Ferron SR, et al. Regulated segregation of kinase Dyrk1A during asymmetric neural stem cell division is critical for EGFR-mediated biased signaling. Cell Stem Cell. 2010;7(3):367–379. doi: 10.1016/j.stem.2010.06.021. [DOI] [PubMed] [Google Scholar]
- 29.Marti E, et al. Dyrk1A expression pattern supports specific roles of this kinase in the adult central nervous system. Brain Res. 2003;964(2):250–263. doi: 10.1016/S0006-8993(02)04069-6. [DOI] [PubMed] [Google Scholar]
- 30.Wegiel J, et al. Cell type- and brain structure-specific patterns of distribution of minibrain kinase in human brain. Brain Res. 2004;1010(1–2):69–80. doi: 10.1016/j.brainres.2004.03.008. [DOI] [PubMed] [Google Scholar]
- 31.Reifenberger J, Reifenberger G, Ichimura K, Schmidt EE, Wechsler W, Collins VP. Epidermal growth factor receptor expression in oligodendroglial tumors. Am J Pathol. 1996;149(1):29–35. [PMC free article] [PubMed] [Google Scholar]
- 32.Bain J, et al. The selectivity of protein kinase inhibitors: a further update. Biochem J. 2007;408(3):297–315. doi: 10.1042/BJ20070797. [DOI] [PMC free article] [PubMed] [Google Scholar]
- 33.Laguna A, et al. The protein kinase DYRK1A regulates caspase-9-mediated apoptosis during retina development. Dev Cell. 2008;15(6):841–853. doi: 10.1016/j.devcel.2008.10.014. [DOI] [PubMed] [Google Scholar]
- 34.Ogawa Y, et al. Development of a novel selective inhibitor of the Down syndrome-related kinase Dyrk1A. Nat Commun. 2010;1:86. doi: 10.1038/ncomms1090. [DOI] [PubMed] [Google Scholar]
- 35.Coates GH, Cox B. Harmine tremor after brain monoamine oxidase inhibition in the mouse. Eur J Pharmacol. 1972;18(2):284–286. doi: 10.1016/0014-2999(72)90255-5. [DOI] [PubMed] [Google Scholar]
- 36.Pandita A, Aldape KD, Zadeh G, Guha A, James CD. Contrasting in vivo and in vitro fates of glioblastoma cell subpopulations with amplified EGFR. Genes Chromosomes Cancer. 2004;39(1):29–36. doi: 10.1002/gcc.10300. [DOI] [PubMed] [Google Scholar]
- 37.Ramnarain DB, et al. Differential gene expression analysis reveals generation of an autocrine loop by a mutant epidermal growth factor receptor in glioma cells. Cancer Res. 2006;66(2):867–874. doi: 10.1158/0008-5472.CAN-05-2753. [DOI] [PubMed] [Google Scholar]
- 38.Cabrita MA, Christofori G. Sprouty proteins, masterminds of receptor tyrosine kinase signaling. Angiogenesis. 2008;11(1):53–62. doi: 10.1007/s10456-008-9089-1. [DOI] [PubMed] [Google Scholar]
- 39.Karpel-Massler G, Schmidt U, Unterberg A, Halatsch ME. Therapeutic inhibition of the epidermal growth factor receptor in high-grade gliomas: where do we stand? Mol Cancer Res. 2009;7(7):1000–1012. doi: 10.1158/1541-7786.MCR-08-0479. [DOI] [PubMed] [Google Scholar]
- 40.Squatrito M, Holland EC. DNA damage response and growth factor signaling pathways in gliomagenesis and therapeutic resistance. Cancer Res. 2011;71(18):5945–5949. doi: 10.1158/0008-5472.CAN-11-1245. [DOI] [PubMed] [Google Scholar]
- 41.Frederick L, Wang XY, Eley G, James CD. Diversity and frequency of epidermal growth factor receptor mutations in human glioblastomas. Cancer Res. 2000;60(5):1383–1387. [PubMed] [Google Scholar]
- 42.Wheeler DL, Dunn EF, Harari PM. Understanding resistance to EGFR inhibitors-impact on future treatment strategies. Nat Rev Clin Oncol. 2010;7(9):493–507. doi: 10.1038/nrclinonc.2010.97. [DOI] [PMC free article] [PubMed] [Google Scholar]
- 43.Vivanco I, et al. Differential sensitivity of glioma- versus lung cancer-specific EGFR mutations to EGFR kinase inhibitors. Cancer Discov. 2012;2(5):458–471. doi: 10.1158/2159-8290.CD-11-0284. [DOI] [PMC free article] [PubMed] [Google Scholar]
- 44.Barkovich KJ, et al. Kinetics of inhibitor cycling underlie therapeutic disparities between EGFR-driven lung and brain cancers. Cancer Discov. 2012;2(5):450–457. doi: 10.1158/2159-8290.CD-11-0287. [DOI] [PMC free article] [PubMed] [Google Scholar]
- 45.Jun HJ, et al. Acquired MET expression confers resistance to EGFR inhibition in a mouse model of glioblastoma multiforme. Oncogene. 2012;31(25):3039–3050. doi: 10.1038/onc.2011.474. [DOI] [PMC free article] [PubMed] [Google Scholar]
- 46.Weihua Z, et al. Survival of cancer cells is maintained by EGFR independent of its kinase activity. Cancer Cell. 2008;13(5):385–393. doi: 10.1016/j.ccr.2008.03.015. [DOI] [PMC free article] [PubMed] [Google Scholar]
- 47.Coker KJ, Staros JV, Guyer CA. A kinase-negative epidermal growth factor receptor that retains the capacity to stimulate DNA synthesis. Proc Natl Acad Sci U S A. 1994;91(15):6967–6971. doi: 10.1073/pnas.91.15.6967. [DOI] [PMC free article] [PubMed] [Google Scholar]
- 48.Ewald JA, Wilkinson JC, Guyer CA, Staros JV. Ligand- and kinase activity-independent cell survival mediated by the epidermal growth factor receptor expressed in 32D cells. Exp Cell Res. 2003;282(2):121–131. doi: 10.1016/S0014-4827(02)00014-9. [DOI] [PubMed] [Google Scholar]
- 49.Friedman LM, et al. Synergistic down-regulation of receptor tyrosine kinases by combinations of mAbs: implications for cancer immunotherapy. Proc Natl Acad Sci U S A. 2005;102(6):1915–1920. doi: 10.1073/pnas.0409610102. [DOI] [PMC free article] [PubMed] [Google Scholar]
- 50.Adayev T, Wegiel J, Hwang YW. Harmine is an ATP-competitive inhibitor for dual-specificity tyrosine phosphorylation-regulated kinase 1A (Dyrk1A). Arch Biochem Biophys. 2011;507(2):212–218. doi: 10.1016/j.abb.2010.12.024. [DOI] [PMC free article] [PubMed] [Google Scholar]
- 51.Levkowitz G, et al. c-Cbl/Sli-1 regulates endocytic sorting and ubiquitination of the epidermal growth factor receptor. Genes Dev. 1998;12(23):3663–3674. doi: 10.1101/gad.12.23.3663. [DOI] [PMC free article] [PubMed] [Google Scholar]
- 52.Kales SC, Ryan PE, Nau MM, Lipkowitz S. Cbl and human myeloid neoplasms: the Cbl oncogene comes of age. Cancer Res. 2010;70(12):4789–4794. doi: 10.1158/0008-5472.CAN-10-0610. [DOI] [PMC free article] [PubMed] [Google Scholar]
- 53.Mizoguchi M, Nutt CL, Louis DN. Mutation analysis of CBL-C and SPRED3 on 19q in human glioblastoma. Neurogenetics. 2004;5(1):81–82. doi: 10.1007/s10048-003-0164-x. [DOI] [PubMed] [Google Scholar]
- 54.Guo D, et al. Perinuclear leucine-rich repeats and immunoglobulin-like domain proteins (LRIG1-3) as prognostic indicators in astrocytic tumors. Acta Neuropathol. 2006;111(3):238–246. doi: 10.1007/s00401-006-0032-5. [DOI] [PubMed] [Google Scholar]
- 55.Ye F, et al. Upregulation of LRIG1 suppresses malignant glioma cell growth by attenuating EGFR activity. J Neurooncol. 2009;94(2):183–194. doi: 10.1007/s11060-009-9836-1. [DOI] [PubMed] [Google Scholar]
- 56.Ying H, et al. Mig-6 controls EGFR trafficking and suppresses gliomagenesis. Proc Natl Acad Sci U S A. 2010;107(15):6912–6917. doi: 10.1073/pnas.0914930107. [DOI] [PMC free article] [PubMed] [Google Scholar]
- 57.Aranda S, Alvarez M, Turro S, Laguna A, de la LS. Sprouty2-mediated inhibition of fibroblast growth factor signaling is modulated by the protein kinase DYRK1A. Mol Cell Biol. 2008;28(19):5899–5911. doi: 10.1128/MCB.00394-08. [DOI] [PMC free article] [PubMed] [Google Scholar]
- 58.Kim HJ, Taylor LJ, Bar-Sagi D. Spatial regulation of EGFR signaling by Sprouty2. Curr Biol. 2007;17(5):455–461. doi: 10.1016/j.cub.2007.01.059. [DOI] [PubMed] [Google Scholar]
- 59.Rubin C, Zwang Y, Vaisman N, Ron D, Yarden Y. Phosphorylation of carboxyl-terminal tyrosines modulates the specificity of Sprouty-2 inhibition of different signaling pathways. J Biol Chem. 2005;280(10):9735–9744. doi: 10.1074/jbc.M408308200. [DOI] [PubMed] [Google Scholar]
- 60.Barbachano A, et al. SPROUTY-2 and E-cadherin regulate reciprocally and dictate colon cancer cell tumourigenicity. Oncogene. 2010;29(34):4800–4813. doi: 10.1038/onc.2010.225. [DOI] [PubMed] [Google Scholar]
- 61.Ivliev AE, ‘t Hoen PA, Sergeeva MG. Coexpression network analysis identifies transcriptional modules related to proastrocytic differentiation and sprouty signaling in glioma. Cancer Res. 2010;70(24):10060–10070. doi: 10.1158/0008-5472.CAN-10-2465. [DOI] [PubMed] [Google Scholar]
- 62.Hamsa TP, Kuttan G. Harmine inhibits tumour specific neo-vessel formation by regulating VEGF, MMP, TIMP and pro-inflammatory mediators both in vivo and in vitro. Eur J Pharmacol. 2010;649(1–3):64–73. doi: 10.1016/j.ejphar.2010.09.010. [DOI] [PubMed] [Google Scholar]
- 63.Ferron SR, Andreu-Agullo C, Mira H, Sanchez P, Marques-Torrejon MA, Farinas I. A combined ex/in vivo assay to detect effects of exogenously added factors in neural stem cells. Nat Protoc. 2007;2(4):849–859. doi: 10.1038/nprot.2007.104. [DOI] [PubMed] [Google Scholar]
Associated Data
This section collects any data citations, data availability statements, or supplementary materials included in this article.