

Abstract
Study Objectives:
To validate the Multiple Suggested Immobilization Test (m-SIT), a symptom-provocation test measuring restless legs syndrome (RLS) severity multiple times a day while the patient is awake and resting under controlled conditions. The m-SIT was designed to overcome some limitations in measuring RLS severity with rating scales.
Design:
Patients completed two m-SITs on 2 consecutive days while on 24-h dopaminergic medication. After treatment discontinuation, they completed one more m-SIT 3 days later. Controls performed only one m-SIT.
Setting:
Sleep laboratory.
Participants:
Nineteen patients with RLS and 10 healthy controls.
Interventions:
The original m-SIT consisted of seven modified 60-min SITs performed every 2 h between noon and midnight. During each SIT, the subject reclined quietly but could move his or her legs without restriction to alleviate symptoms. Every 10 min, periodic leg movements during wakefulness (PLMW) were evaluated and the m-SIT Disturbance Scale (m-SIT-DS; range 0-10) was completed.
Measurements and Results:
The m-SIT, composed of 6:00pm, 8:00pm, 10:00pm, and 12:00pm SITs, discriminated patients from controls (mean m-SIT-DS: 2.68 ± 2.35 versus 0.08 ± 0.26; mean PLMW/h, P = 0.0001) and between treatment groups (on medication versus taken off medication; mean m-SIT-DS, P = 0.0001; mean PLMW/h, P < 0.01). It proved reliable on retest and covariated well with the International Restless Legs Scale (IRLS) and scales measuring daytime symptoms (Spearman ρ > 0.4).
Conclusions:
The m-SIT is a valid and reliable test to evaluate RLS severity and treatment response, and could be useful in the future to confirm diagnosis and identify daytime symptoms. Although it was primarily designed for clinical trials, it might be useful in clinical settings because it provides a standardized testing condition to measure RLS symptoms.
Citation:
Garcia-Borreguero D; Kohnen R; Boothby L; Tzonova D; Larrosa O; Dunkl E. Validation of the Multiple Suggested Immobilization Test: a test for the assessment of severity of restless legs syndrome (Willis-Ekbom disease). SLEEP 2013;36(7):1101-1109.
Keywords: Daytime symptoms, laboratory tests, restless legs syndrome, Willis-Ekbom disease
INTRODUCTION
Restless legs syndrome (RLS), also known as Willis-Ekbom disease, is normally evaluated by rating scales such as the International Restless Legs Scale (IRLS).1 Although such scales are easy to use, their validity is limited because they rely exclusively on subjective assessment and memory recall (usually for periods of up to 7 days). Also, their scores are highly dependent on the patient′s degree of physical activity. The most frequently used scale, the IRLS scale, has also proven to be quite sensitive to placebo effects.2,3 Therefore, a test evaluating severity of subjective and objective RLS symptoms under controlled conditions is necessary.
During the past decade, actimetry and polysomnography (PSG) have played secondary roles in the evaluation of RLS. Actimetry provides a good estimate of the day-to-day variation in periodic limb movement (PLM)4 and PSG reflects sleep and motor dysfunction during sleep. However, neither test evaluates sensory symptoms occurring during wakefulness.5 Furthermore, the evaluation of motor dysfuntion taking place in PSGs or in actimetry does not occur under reproducible, immobilized conditions.
Additionally, daytime symptoms should be evaluated. In recent surveys of moderate to severe RLS, up to 55% of subjects have reported daytime symptoms.6,7 Moreover, patients with moderate to severe RLS normally increase their daytime physical activity in order to alleviate these symptoms.8 Thus, any comprehensive evaluation should assess daytime symptoms and be performed under standardized conditions for activity.
Thus, the Suggested Immobilization Test (SIT) was developed to better evaluate RLS.9 In the validated version of the SIT, the patient reclines with legs outstretched for 60 min at 9:00pm. The SIT controls for activity because patients are encouraged to resist as much as possible the urge to move.10 Also, the SIT can evaluate propensity to symptom onset because immobilization can provoke RLS symptoms.5,11–15
Although an improved measure, the validated SIT is still limited due to its single administration time (9:00pm).12 Propensity to RLS symptom onset may fluctuate over the course of the afternoon/evening,16,17 and a single 60-min SIT cannot evaluate any symptoms occurring outside of its administration time. This may lead to false-negative results in patients with RLS who happen to experience fewer or no symtoms during the SIT. In addition, PLM during wakefulness (PLMW) indices during periods of increased leg activity, such as during the SIT, correlate poorly with the PLM during sleep (PLMS) index during PSG, as a recent study has shown.18 Furthermore, the SIT is limited in that some patients are more apt to move instead of staying still at the first sign of discomfort or pain, which might affect their individual objective score.19 Last, the SIT has not been validated to treatment response and has been seldomly used in clinical trials. Taken together, there is a need to develop a new test with higher sensitivities and specificities for diagnosis and evaluation of RLS severity.
With these limitations in mind, we developed the Multiple Suggested Immobilization Test (m-SIT), a test consisting of multiple tests throughout the afternoon and evening, with slightly modified instructions compared to the validated SIT.
The objectives of this study were:
To investigate the validity and reliability of the m-SIT as a tool to evaluate symptom severity in RLS.
To investigate the validity and reliability of the m-SIT as a potential diagnostic tool for RLS; particularly, to evaluate which timing, frequency, and number of SITs increased the m-SIT's diagnostic value.
To investigate the sensitivity of the m-SIT under different treatment conditions (in patients with RLS on and taken off medication).
METHODS
Subject Population
Idiopathic RLS had been diagnosed in all patients. Patients with concomitant diagnoses of disorders that might confound RLS (peripheral neuropathy, pain syndromes, generalized anxiety disorder, motor manifestations during sleep, etc.), those taking drugs that might influence sleep architecture, shift workers or those with irregular sleep wake schedules or recent surgeries, or patients with any medical or psychiatric disorder were excluded from study participation.
Healthy controls were recruited by means of advertisement. Similar to patients with RLS, controls underwent a clinical evaluation and laboratory blood tests, and provided a urine sample. Controls were excluded from analysis if their periodic limb movement index (PLMI) was greater than 10 or any significant abnormalities in sleep architecture were detected. In sleep diaries before the study′s start, controls reported no sleep complaints. They also documented regular sleep-wake schedules with habitual bedtimes between 11:00pm and midnight for 1 week.
The study was performed at the Sleep Research Institute in Madrid, Spain, and was approved by the local Institutional Review Board (IRB). Every participant signed a consent form before beginning the study. Subjects were compensated by an IRB-approved minimal fee for time spent in the laboratory.
Study Schedule
At a screening 1 week prior to the beginning of the study, the symptom severity of patients with RLS was assessed using the IRLS,1 the RLS-6,20 and the Johns Hopkins Restless Legs Severity Scale (JHRLSS).21 These patients provided urine and blood samples at this time.
For 1 week after the screening, all subjects completed a 24-h sleep diary. Each h they rated the severity of their RLS symptoms (0: no symptoms; 1: mild symptoms; 2: severe symptoms) and degrees of activity (mainly active/inactive, or sleeping). After diary completion patients who qualified for the study completed two m-SITs on 2 consecutive days (m-SIT-1 in visit 1 and m-SIT-2 in visit 2).
All patients with RLS were taking dopaminergic medication during visits one and two, after which medication was discontinued. One to 3 days later (visit three), a third m-SIT (m-SIT-3) was performed after the patient had been taken off medication. Following visit three, patients with RLS reinitiated dopaminergic treatment, and a follow-up visit was performed 1 week later.
Like patients with RLS, controls attended a screening visit and completed a sleep diary for 1 week. However, they only completed one m-SIT.
m-SIT Procedures
The m-SIT performed in this study for exploratory purposes consisted of seven SITs at 12:00pm, 2:00pm, 4:00pm, 6:00pm, 8:00pm, 10:00pm, and midnight. During each 60-min SIT, the patient reclined quietly on top of the bed covers at a 45° angle with legs outstretched. Lower back support was provided as needed with a pillow, the head remained unsupported, and another pillow was placed under the knees. The test was performed without any distractions in a room illuminated with soft light at approximately 50 lux. The patient remained alone with the door shut and windows and curtains closed to keep noise and bright light at a minimum. Wall clocks, watches, and other timepieces were removed from the room. Cell phones, MP3 players, and any other portable electronic devices were switched off and were prohibited for the duration of the test.
Before each test, laboratory staff allowed the subject to use the toilet if necessary. Staff set a 60-min timer with alarms at 10-min intervals, when they were reminded to ask the subject to rate the severity of their RLS symptoms. The patient was also connected to the PSG (electrodes were placed according to the international 10 × 20 system), and an electromyograph (EMG) electrode was placed on the bilateral anterior tibialis muscle (according to standard procedures).
At the beginning of each SIT, subjects were told to remain still and keep their legs outstretched at a 170° angle. Yet in contrast to the validated version of the SIT,9 patients could move their legs as much as needed to lessen bothersome or painful sensations. However, they were then required to resume the 170° outstretched position as soon as possible. Patients were also told to refrain from tightening their muscles to avoid movements. Also, before each SIT, patients were reminded of the m-SIT Disturbance Scale (m-SIT DS) (e-attachment), a numerical symptom severity scale ranging between 0 (no symptoms) and 10 (severe symptoms). During the test, patients verbally communicated these ratings to laboratory staff every 10 min.
Patients were monitored by video, audio, and PSG recordings to ensure that they complied with test instructions; additionally, patients kept their eyes open and could not sleep, read, or talk. If a patient fell asleep, the technician awoke him or her and allowed the test to continue. Technicians avoided speaking to subjects during the SIT except to ask for severity ratings and to remind patients of test instructions.
In the event that symptoms became too bothersome or painful, subjects could request to terminate the current SIT, and began the next SIT at the scheduled time. If a patient discontinued or interrupted a SIT and ratings were available for the remainder of the test, the staff specified why. Staff could write “intolerable symptoms,” and assign a rating of 10 per each 10-min interval, or could specify “other” (i.e., patient wish and not due to symptoms, used restroom, technical problems, etc.).
Sleeping was prohibited between SITs, but the patient could use any electronic devices, read, or move about the laboratory until the next SIT.
Measurements
Motor and sensory measurements during the m-SIT included periodic limb movements during wakefulness (PLMW) and severity discomfort scales (m-SIT-DS). PLMWs were measured during each SIT with a bilateral anterior tibialis surface electro-myogram,22 and were quantified hourly and in 10-min intervals. Scoring of the PLMW index was performed by blinded raters.
Also during the SIT, patients rated the severity of symtoms in the legs every 10 min on the m-SIT-DS. The m-SIT-DS rating was communicated by the patient to the staff verbally, after which the rating was recorded on the chart. It consisted of six rows (for each 10-min rating) and three columns (min [10, 20, 30, etc.], clock time, and severity rating – see supplementary material). While rating their symptoms for a given SIT, subjects were not reminded of any previous severity scores. As mentioned, if a patient discontinued a SIT due to extreme discomfort, the maximum m-SIT-DS score (10) was assigned to each missing 10-min rating. Any missing PLMW values were substituted by the patient′s highest previous 10-min PLMW value in that SIT.
Statistical Analysis
Validity and Reliability
We examined the stability of assessments between two consecutive visits performed under comparable, medicated conditions (m-SIT-1 versus m-SIT-2) to determine the m-SIT′s test-retest reliability. Differences in mean m-SIT-DS and mean PLMW/h between patients on medication (m-SIT-1) and those taken off medication (m-SIT-3), as well as between patients on medication (m-SIT-1) and controls were evaluated to test the m-SIT's discriminant validity.
To assess the m-SIT's concurrent validity, we examined the capacity of patients' mean m-SIT-DS to covariate with severity rating scales evaluating daytime symptom severity. Scales evaluating daytime severity were the JHRLSS and the Restless Legs Syndrome-6 [RLS-6] items 4 and 5: presence of daytime symptoms without activity and when active, respectively.
Additionally, we examined the correlation between the m-SIT-1 (on medication) and m-SIT-3 (taken off medication) and the IRLS scale, an approved RLS scale supposedly serving the same objective as the m-SIT. Correlation analysis to evaluate validity and reliability was performed with Spearman rho.
Statistical Methods
Comparisons between patients with RLS and controls were conducted with a t-test with unequal variances (m-SIT-1 versus controls). We used the signed rank test for paired data to compare changes in symptom severity between m-SITs (m-SIT-1 versus m-SIT-3 and m-SIT-1 versus m-SIT-2).
Sensitivity and specificity were calculated according to standard methods23 using 2 × 2 tables (m-SIT-1 or m-SIT-3 versus cutoffs for mean m-SIT-DS and mean PLMW/h) both with the seven single SITs and combinations of three, four, five, and seven SITs. As an outcome measure for combinations we used the maximum m-SIT-DS or PLMW/h from all single SITs that were included in the SIT combination. We considered the maximum score to be indicative of sensory or motor symptoms because symptoms usually worsened both during the 1-h SIT and over all seven SITs.
To determine the diagnostic accuracy of individual SITs and combinations of SITs, we calculated area under the receiver operating characteristic curves (ROCs) from logistic regression analysis.24 Several cutoffs for presence or absence of sensory or motor symptoms were chosen in the lower range in both variables to give healthy volunteers a chance to score positively in either variable and to take into account the study′s small sample size. For the m-SIT-DS, we used scores of ≥ 1, ≥ 2, and > 2, and PLMIs of ≥ 5, ≥ 10, and ≥ 15.
Statistical analyses were performed in an exploratory manner. P ≤ 0.05 (two-tailed) was considered as indicative for non-random differences. The SAS Statistical Package V.9.1 (SAS Institute, Cary, NC) was used for all analyses.
Estimation of the Sample Size
Due to the novel nature of the m-SIT and lack of empirical information on the validation of the SIT from previous trials, no formal sample size calculation was performed. However, we expected large differences when comparing patients with RLS to controls and between treatment groups. With 19 patients with RLS and 10 controls in the final analysis, effect sizes of larger than 1.0 were demonstrated (power of 80%, type I error rate of α = 0.05). This sample size was considered adequate to evaluate the m-SIT's sensitivity to differences between patients with RLS and controls and between treatment groups.
RESULTS
Demographics of Subjects in Statistical Analysis
Twenty patients (13 women and 7 men) enrolled in the study, but one man discontinued the study before initiating the first m-SIT for personal reasons. Remaining patients aged 60.7 ± 12.1 y (mean ± standard deviation [SD]). Patients in whom idiopathic RLS had been diagnosed13 had total symptom durations of 25.3 ± 17.2 y, and had been treated for 5.3 ± 4.9 y. At the study′s start, patients had been taking long-acting (> 24 h) dopaminergic agents for 4 weeks or longer and had IRLS scores of 12.5 ± 8.2. Seventeen patients were on the dopaminergic agent rotigotine (2-4 mg/day, transdermal patch applied in the morning), one on pergolide (1 mg/day) and one on cabergoline (2 mg/day). Ten healthy controls (6 women and 4 men, age 59.5 ± 5.53 y) also participated in the study.
Sensory and Motor Disturbances across Time of Day and Treatment Conditions
Figure 1A shows mean m-SIT-DS scores for all seven SITs in patients on medication (m-SIT-1 and m-SIT-2), patients taken off medication (m-SIT-3), and controls. All healthy controls scored zero at all times on the m-SIT-DS. Therefore, no statistical tests were performed to compare controls with patients in the mean m-SIT-DS scores.
Figure 1.

Mean (A) m-SIT-DS scores and (B) PLMW/h (± standard error) during the m-SIT in patients on medication (m-SIT-1 and m-SIT-2) and taken off medication (m-SIT-3), as well as healthy controls. One control missed a SIT at 10:00pm, so we substituted these m-SIT-DS and PLMW scores with 0. Black bars represent the final 4-SIT combination recommended in this paper. m-SIT-1 versus m-SIT-3: *P < 0.05 and ‡P < 0.0001; controls versus m-SIT-3: †P < 0.05; §P < 0.001. DS, disturbance scale; PLMW, periodic limb movement during wakefulness; m-SIT, Multiple Suggested Immobilization Test.
On average, patients reported subjective symptoms both when on and taken off dopaminergic medication, with increasing severity in the evening. Despite treatment, 13 patients reported symptoms in both m-SIT-1 and m-SIT-2, three patients reported symptoms in either m-SIT-1 or m-SIT-2, and only three patients had no symptoms in either SIT. While taken off medication, all but one patient with RLS reported increased subjective symptoms. Over the two consecutive visits on medication, mean m-SIT-DS scores were comparable (m-SIT-1: 0.75 ± 0.88 [mean ± SD] versus m-SIT-2: 0.96 ± 1.15, P = 0.6229). However, following discontinuation of treatment for 1-3 days, mean m-SIT-DS scores clearly increased (m-SIT-1 versus m-SIT-3: 2.08 ± 2.09, P < 0.0001; m-SIT-2 versus m-SIT-3: 1.87 ± 2.17, P = 0.0002).
Figure 1B displays mean PLMW/h in all subjects for all seven SITs. PLMWs were observed in all patients with RLS and in eight controls. When occurring in controls, PLMWs occurred in a single SIT during one (five controls) or two (two controls) 10-min intervals. However, one control showed continuous PLMWs during four consecutive SITs beginning at 6:00pm (with a mean PLMW/h of approximately 60).
During m-SIT-1, mean PLMW/h was lower in controls (6.12 ± 11.19/h [mean ± SD]) than in patients on medication (m-SIT-1: 29.94 ± 24.,1, P = 0.0012; m-SIT-2: 33.60 ± 29.9, P = 0.0015, both t-tests with unequal variances) or taken off medication (m-SIT-3: 67.62 ± 52.5, P < 0.0001). From m-SIT-1 to m-SIT-2, there was no statistical difference in mean PLMW/h (P = 0.3736). Yet after discontinuation of treatment, mean PLMW/h was significantly higher (m-SIT-1 versus m-SIT-3, difference d = 34.0/h ± 48.78, P = 0.0008; m-SIT-2 versus m-SIT-3, d = 37.7/h ± 43.26, P = 0.0033, sign-rank test).
Cutoff Scores Differentiating Patients from Controls and Evaluating Sensitivity to Treatment Change
We determined which cutoff scores separated patients from controls using mean m-SIT-DS scores and mean PLMW/h. ROC analyses compared patients taken off medication (m-SIT-3) with healthy controls. Figure 2 shows the percentage of patients and controls who met the established cutoff scores for sensory (mean m-SIT-DS > 2) and motor (mean PLMW/h ≥ 10) symptoms during m-SIT-3. Following ROC analysis, cutoff scores > 2 for the m-SIT-DS and a PLMI ≥ 10 were determined to optimally differentiate patients from controls. Although mean cutoff scores were established (if ≥ 1 and ≥ 2 for m-SIT-DS and ≥ 5 and ≥ 15 for PLMW/h), they are not shown in Figure 2.
Figure 2.

Frequency distributions of subjects meeting (A and B) mean m-SIT-DS and (C and D) mean PLMW cutoff scores during m-SIT-3 in patients with RLS (A and C) and healthy controls (B and D). Out of the scores shown, cutoff scores of > 2 for mean m-SIT-DS and ≥ 10 for mean PLMW/h were chosen. Black bars represent the final 4-SIT combination recommended in this article. As shown in Figure 2B, none of the controls met these cutoff scores in a single SIT. DS, disturbance scale; PLMW, periodic limb movement during wakefulness; m-SIT, Multiple Suggested Immobilization Test.
We analyzed the sensitivity of the m-SIT to treatment change by evaluating the percentage of patients who did not meet cutoff criteria (m-SIT-DS > 2 and PLMI of ≥ 10) while on dopaminergic medication, but did so while off medication. At 10:00pm, 52.6% of the patients who had not met cutoff criteria during the treated condition (M-SIT-1) did so in the untreated condition (M-SIT-3).
Sensitivity and Specificity of Different SIT Combinations
Using the cutoff scores described previously, we tested the sensitivity and specificity of single SITs versus different combinations of SITs to find which m-SIT combinations would have the highest power to evaluate severity and predict diagnosis. As shown in Tables 1 and 2, sensitivity, specificity, and area under the curve (AUC) increased continuously between the noon and midnight SITs. Also, combinations rather than single SITs better distinguish between treatment conditions. For example, the combination of four SITs between 2:00pm and 10:00pm perfectly discriminates between patients and controls, whereas each of these SITs alone has considerably lower sensitivities and specificities (-21% at 10:00pm and 10:00pm to -42% at 4:00pm). In addition, the gain in diagnostic accuracy for patients taken off medication (m-SIT-3) using combinations of five or seven SITs is quite minor when compared with the combination of four SITs between 4:00pm and 10:00pm (see AUC in Tables 1 and 2). Similar findings were revealed in a comparison between RLS patients on dopaminergic medication (m-SIT-1) and controls; however, sensitivities and specificities were lower.
Table 1.
Sensitivities and specificities of single SITs and various combinations of multiple SITs calculated in patients taken off dopaminergic medication (m-SIT-3) versus controls using a cut-off score of m-SIT-DS > 2
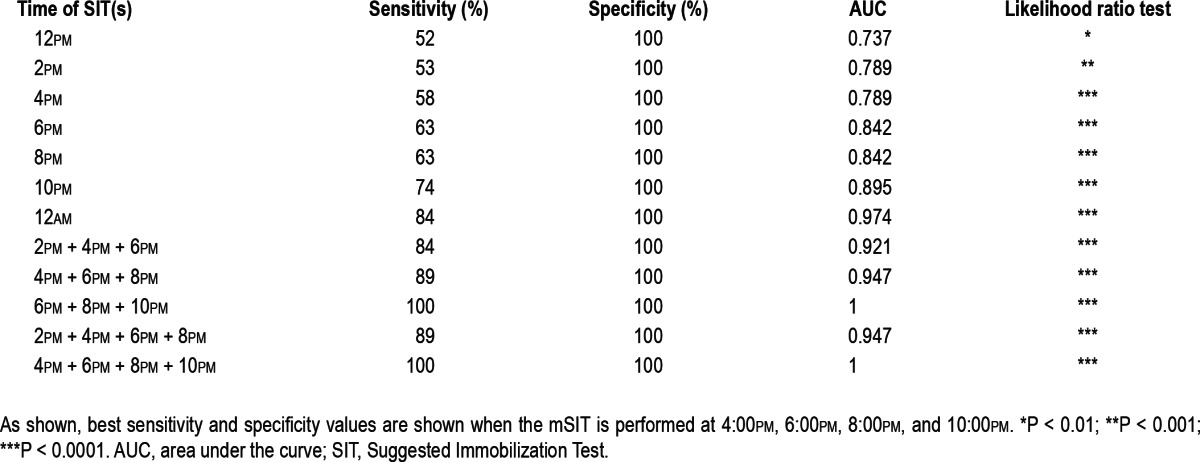
Table 2.
Sensitivities and specificities of single SITs and various combinations of multiple SITs calculated in patients taken off dopaminergic medication (m-SIT-3) versus controls using a cut-off score of PLMW/h > 10
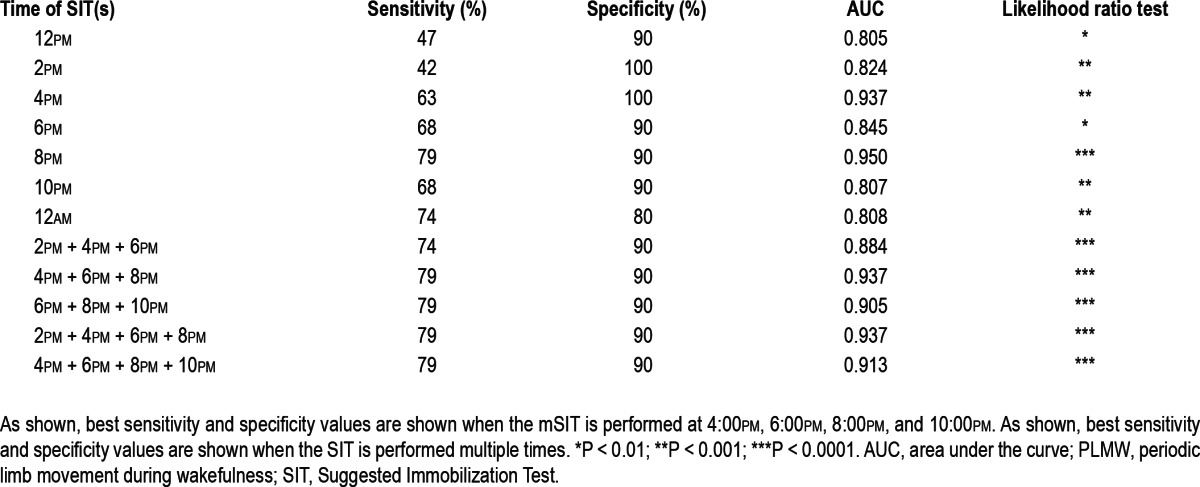
With these calculations in mind, and also for practical testing reasons, our final recommended version of the m-SIT consisted of the four SITs performed at 4:00pm, 6:00pm, 8:00pm, and 10:00pm. Using a mean m-SIT-DS cutoff of > 2, sensitivity, specificity, and AUC were all 100% for this SIT combination. Using a mean PLMW/h cutoff of ≥ 10, sensitivity was 79%, specificity 90%, and the AUC was 91.3%. These measures indicate that this SIT combination is valid to distinguish patients with RLS from healthy controls.
If necessary, an even shorter version of the m-SIT consisting of three SITs performed at 6:00pm, 8:00pm, and 10:00pm may be used for routine clinical purposes. However, because this version provided slightly lower sensitivities when patients were on medication compared to when taken off medication, it is possible that this shortened version might be less capable of discriminating between treatments in a research setting.
Validity and Reliability of the m-SIT
Table 3 summarizes the discriminant, concurrent, convergence validities, and the test-retest reliability of the recommended version of the m-SIT.
Table 3.
Summary of the discriminant, concurrent, and convergence validities, and the test-retest reliability of the final version of the m-SIT
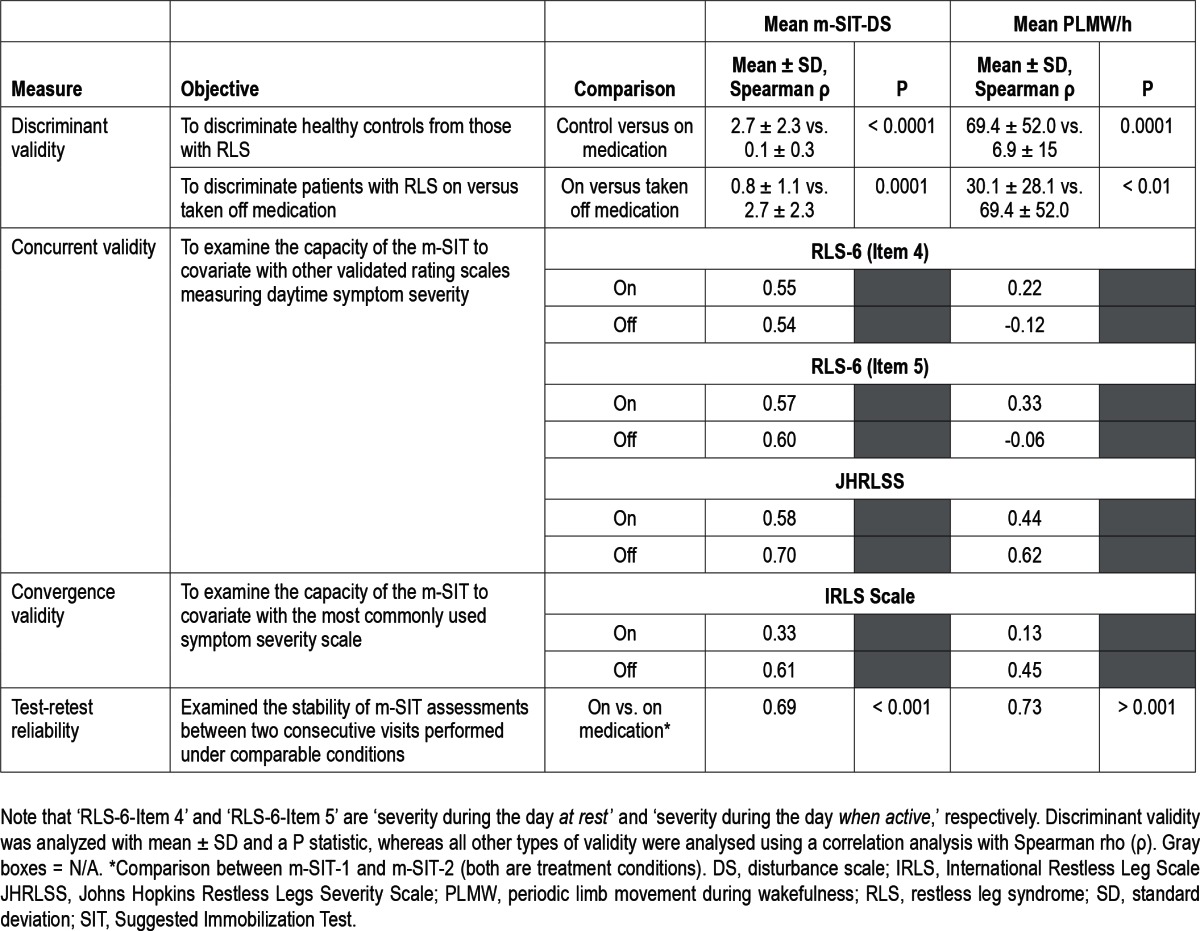
Correlations between the mean m-SIT-DS and severity scales measuring symptoms during the daytime were highly positive regardless of treatment condition, but particularly so when patients were taken off medication. Conversely, low positive correlations were found between mean PLMW/h and the RLS-6 items tested when patients were on medication. However, these measures were not correlated or slightly negatively correlated when medication was discontinued. In contrast, correlations between mean PLMW/h and JHRLSS were almost as positive as correlations with the mean m-SIT-DS.
As shown in Table 3, the mean m-SIT-DS scores correlated moderately with the IRLS scale when patients were on medication, and correlated highly when patients were taken off medication. Mean PLMW/h correlated with the IRLS in much the same way: slightly when patients were on medication and moderately when patients had not taken medication for 1-3 days.
Reliability
The test-retest reliability comparing the two m-SITs occurring under treatment conditions (m-SIT-1 and m-SIT-2) was r = 0.689 (mean m-SIT-DS) and r = 0.748 (mean PLMW/h). These values are considered acceptable for a complex measure such as the m-SIT.
DISCUSSION
Our analysis shows that the m-SIT consisting of four SITs between 4:00pm can measure propensity to symptoms under standardized, reproducible conditions. It allows for an assessment of at least three diagnostic criteria of RLS, including the urge to move, the provocation of symptoms at rest, and the increase in severity in the evening.25
As mentioned previously, following an analysis of sensitivity and specificity for each of the SITs and their combinations, only four SITs (performed at 2-h intervals between 4:00pm and 10:00pm and 10:00pm) were chosen for the final version of the m-SIT. We also reduced the total number of SITs in order to make the m-SIT more accessible and feasible under routine practice conditions. Our results prove the validity and test-retest reliability of the m-SIT composed of this SIT four-SIT combination. They also show that the m-SIT is valid to differentiate between RLS patients on or taken off medication.
The m-SIT evaluates the severity of RLS based on two different types of symptoms, namely sensory and motor disturbance. In principle, both sensory and motor symptoms could be combined in the future into a single integrated measure (i.e., after z-transformation of both single scores) or by combining cut-off score results. Nonetheless, because the m-SIT prohibits physical activity at different times of day, it is a thorough, reliable tool to evaluate RLS symptom severity and can be used to assess the real effect of symptoms without the confounding effect caused by changing degrees of such activity.
Additionally, because the m-SIT is administered during the afternoon and evening, the test allows for a comprehensive, objective evaluation of symptoms throughout the latter part of the day. Subscores can be developed for SITs taking place before (daytime) and after (evening) 6:00pm. This conclusion is reinforced by the m-SIT′s strong correlation with rating scales measuring daytime symptoms (RLS-6 daytime scales 4 and 5).
A recent study has shown a low correlation between PLMW at the beginning of the sleep study and PLMS indices. Thus, PLMW indices during the early portion of the night, or on any circumstances in the late evening when leg activity is increased, are not helpful to predict PLMS.18 This might further explain the limited value of the SIT to predict PLMS indices.9 Also, 26.3% of the patients who scored negative for daytime symptoms on the RLS-6 or JHRLSS were actually symptomatic on the m-SIT. This suggests that because the RL6-6 and JHRLSS do not quantify and/or control for physical activity (in contrast to the m-SIT), and because they cover a longer period of time (ie. up to 7 days, such as in the IRLS), they may underestimate symptom severity. Also, m-SIT scores correlate with the IRLS at a moderate level. This result shows that the m-SIT indeed measures severity and that it has its own specific validity; in other words, it measures RLS symptoms at the time they occur.
In addition to measuring RLS severity, the m-SIT proved useful in differentiating patients from controls. Using a mean m-SIT-DS cutoff score of > 2 and a PLMI score ≥ 10, the m-SIT had sensitivities and specificities of 100% in differentiating untreated patients from controls, whereas single SITs performed at 8:00pm and 10:00pm had sensitivities and specificities of 63% and 100%, and 74% and 100%, respectively. However, given the small number of controls, any evaluation of the discriminative power of the m-SIT to differentiate patients from controls should be considered preliminary. Furthermore, the capacity of the m-SIT to differentiate RLS symptoms from mimics remains to be tested. In any case, our findings show that compared with the single SIT, repetition of the SIT increases the likelihood of provoking symptoms and therefore increases its diagnostic power. Furthermore, the high sensitivity of the m-SIT might prove to be particularly useful in evaluating patients with less severe symptoms or patients who temporarily alleviate and thus mask their RLS symptoms by increasing their physical activity.
When comparing patients on and off medication we used a withdrawal design: patients were assessed without medication 3 days after discontinuation of their current dopaminergic medication. Most patients (17 of 19 patients) were treated with a rotigotine patch. Although the terminal half-life of rotigotine following patch removal was determined to be 5-7 h26 and the washout interval in our study was planned to be more than five half-lives, it cannot be excluded that those who metabolized the drug slowly were still under dopaminergic stimulation. Therefore, we consider the diagnostic accuracy of the 4-SIT m-SIT and the effect size of the differences between the on and off conditions as preliminary.
Moreover, because the m-SIT evaluates symptoms at multiple times earlier in the day, it is feasible that the test may be a useful measure of augmentation, which is the main complication of dopaminergic treatment over the long term.27 The cardinal feature of augmentation is the occurrence of symptoms earlier in the afternoon than was normal at the beginning of dopaminergic treatment; this is the result of dopaminergic medication itself.28 The Augmentation Severity Rating Scale has been validated to measure symptoms of augmentation,29 but the m-SIT might provide an objective test to measure an earlier symptom onset: augmentation's hallmark feature. This hypothesis should be tested in future studies.
Although small, the study population consisted of otherwise healthy subjects with a good overall response to dopaminergic treatment. Furthermore, sensory symptoms were provoked by the m-SIT in 18 of 19 patients, and in none of the controls. These results are robust and reproducible. However, future studies would benefit from being larger and including groups of patients with RLS mimics. Furthermore, given the fact that the m-SIT was able to detect symptoms in patients who were judged to be adequately treated with a dopamine agent that delivers a stable 24-h dosing, we believe that it might be a useful tool in treatment of patients with less severe RLS. Our group is currently investigating this question in treatment-naive patients.
Interestingly, m-SIT showed that patients presented symptoms despite being treated. These symptoms mainly manifested in high PLMW scores in patients with relatively low discomfort scores (m-SIT-DS). It is likely that the high PLMW score shown during the m-SIT reflects the fact that these patients' symptoms are not sufficiently controlled by medication. Thus, the m-SIT could be indicated to evaluate patients whose RLS symptoms are not well controlled.
Finally, the m-SIT elicited symptoms during the daytime in patients controlling their symptoms with dopaminergic medication. Because symptoms could be provoked by immobility during the m-SIT despite treatment, physical activity may be the principal mechanism patients use to alleviate RLS symptoms during the day. Hence, it is reasonable to think that in patients with moderate to severe RLS, symptomatic periods can occur whenever activity is reduced (i.e., sitting, driving, or doing office work). A previously mentioned study recently performed by our group showed that 55% of 224 patients reported daytime symptoms > 3 days per week, and that 41% suffered daytime symptoms every day.7 Unfortunately, it is difficult to ascertain whether the presence of daytime symptoms is an effect of dopaminergic medication (as an emerging RLS augmentation) or whether it is a consequence of the natural progression of the disease. Regardless, daytime RLS symptoms are often ignored in symptom evaluation and RLS investigation and deserve further study.
In summary, the current study offers comprehensive results on the m-SIT, a new test that could be useful in evaluating RLS treatment response and/or discriminate between varying degrees of symptom severity. The m-SIT may be used for diagnostic purposes or clinical trials. Its main advantage over the single SIT is a significant increase in sensitivity and specificity15 and the possibility to evaluate daytime symptoms and accordingly adjust treatment. Furthermore, the m-SIT may even be completed with leg actigraphy, because it does not strictly require polysomnography. So, in addition to sleep laboratories, objective sensory and motor RLS symptom evaluation could become available to neurological practices, nonneurologic specialists, and other outpatient settings.
DISCLOSURE STATEMENT
This was not an industry supported study. Dr. Garcia-Borreguero has received honoraria for advisory boards or lectures from Boehringer Ingelheim, GlaxoSmithKline, UCB Pharma, Pfizer, Xenoport, Otsuka, Jazz Pharma, Impax laboratories and MSD. Dr. Kohnen has received honoraria for advisory boards and consultancy from UCB Pharma, Pfizer, Axxonis and Jazz Pharma. The other authors have indicated no financial conflicts of interest. Off-label or investigational use: Off-label pharmaceutical agents used (Europe): cabergoline, pergolide.
SUPPLEMENTAL MATERIAL
Multiple SIT Disturbance Scale. RLS patients and controls rated their symptoms verbally every 10 minutes to the laboratory staff.
REFERENCES
- 1.Walters AS, LeBrocq C, Dhar A, et al. Validation of the International Restless Legs Syndrome Study Group rating scale for restless legs syndrome. Sleep Med. 2003;4:121–32. doi: 10.1016/s1389-9457(02)00258-7. [DOI] [PubMed] [Google Scholar]
- 2.Allen R, Becker PM, Bogan R, et al. Ropinirole decreases periodic leg movements and improves sleep parameters in patients with restless legs syndrome. Sleep. 2004;27:907–14. doi: 10.1093/sleep/27.5.907. [DOI] [PubMed] [Google Scholar]
- 3.Fulda S, Wetter TC. Where dopamine meets opioids: a meta-analysis of the placebo effect in restless legs syndrome treatment studies. Brain. 2008;131:902–17. doi: 10.1093/brain/awm244. [DOI] [PubMed] [Google Scholar]
- 4.Gschliesser V, Frauscher B, Brandauer E, et al. PLM detection by actigra phy compared to polysomnography: a validation and comparison of two actigraphs. Sleep Med. 2009;10:306–11. doi: 10.1016/j.sleep.2008.03.015. [DOI] [PubMed] [Google Scholar]
- 5.Allen RP. Improving RLS diagnosis and severity assessment: polysom nography, actigraphy and RLS-sleep log. Sleep Med. 2007;8:S13–8. doi: 10.1016/j.sleep.2007.04.011. [DOI] [PubMed] [Google Scholar]
- 6.Benes H, Reketat N, Berkels R. Symptoms and treatment of restless legs syndrome–a patient survey. Akt Neurol. 2011;38:476–80. [Google Scholar]
- 7.Tzonova D, Larrosa O, Calvo E, et al. Breakthrough symptoms during the daytime in patients with restless legs syndrome (Willis-Ekbom disease) Sleep Med. 2012;13:151–5. doi: 10.1016/j.sleep.2011.09.015. [DOI] [PubMed] [Google Scholar]
- 8.Michaud M, Dumont M, Paquet J, Desautels A, Fantini ML, Montplaisir J. Circadian variation of the effects of immobility on symptoms of restless legs syndrome. Sleep. 2005;28:843–6. doi: 10.1093/sleep/28.7.843. [DOI] [PubMed] [Google Scholar]
- 9.Michaud M, Paquet J, Lavigne G, Desautels A, Montplaisir J. Sleep labo ratory diagnosis of restless legs syndrome. Eur Neurol. 2002;48:108–13. doi: 10.1159/000062996. [DOI] [PubMed] [Google Scholar]
- 10.Michaud M. Is the suggested immobilization test the “gold standard” to assess restless legs syndrome? Sleep Med. 2006;7:541–3. doi: 10.1016/j.sleep.2006.05.014. [DOI] [PubMed] [Google Scholar]
- 11.Hening W, Walters AS, Allen RP, Montplaisir J, Myers A, Ferini-Strambi L. Impact, diagnosis and treatment of restless legs syndrome (RLS) in a primary care population: the REST (RLS epidemiology, symptoms, and treatment) primary care study. Sleep Med. 2004;5:237–46. doi: 10.1016/j.sleep.2004.03.006. [DOI] [PubMed] [Google Scholar]
- 12.Michaud M, Lavigne G, Desautels A, Poirier G, Montplaisir J. Effects of immobility on sensory and motor symptoms of restless legs syndrome. Mov Disord. 2002;17:112–5. doi: 10.1002/mds.10004. [DOI] [PubMed] [Google Scholar]
- 13.Haba-Rubio J, Sforza E. Test-to-test variability in motor activity during the suggested immobilization test in restless legs patients. Sleep Med. 2006;7:561–6. doi: 10.1016/j.sleep.2006.02.007. [DOI] [PubMed] [Google Scholar]
- 14.Kohnen R, Allen RP, Benes H, et al. Assessment of restless legs syndrome--methodological approaches for use in practice and clinical trials. Mov Disord. 2007;22(Suppl 18):S485–94. doi: 10.1002/mds.21588. [DOI] [PubMed] [Google Scholar]
- 15.De Cock VC, Bayard S, Yu H, et al. Suggested immobilization test for diagnosis of restless legs syndrome in Parkinson's disease. Mov Disord. 2012;27:743–9. doi: 10.1002/mds.24969. [DOI] [PubMed] [Google Scholar]
- 16.Karatas M. Restless legs syndrome and periodic limb movements during sleep: diagnosis and treatment. Neurologist. 2007;13:294–301. doi: 10.1097/NRL.0b013e3181422589. [DOI] [PubMed] [Google Scholar]
- 17.Allen RP, Dean T, Earley CJ. Effects of rest-duration, time-of-day and their interaction on periodic leg movements while awake in restless legs syndrome. Sleep Med. 2005;6:429–34. doi: 10.1016/j.sleep.2005.05.010. [DOI] [PubMed] [Google Scholar]
- 18.Ferri R, Manconi M, Plazzi G, et al. Leg movements during wakefulness in restless legs syndrome: Time structure and relationships with periodic leg movements during sleep. Sleep Med. 2012;13:529–35. doi: 10.1016/j.sleep.2011.08.007. [DOI] [PubMed] [Google Scholar]
- 19.Birinyi PV, Allen RP, Lesage S, Dean T, Earley CJ. Investigation into the correlation between sensation and leg movement in restless legs syndrome. Mov Disord. 2005;20:1097–103. doi: 10.1002/mds.20498. [DOI] [PubMed] [Google Scholar]
- 20.Kohnen R, Oertel WH, Stiasny-Kolster K, Benes H, Trenkwalder C. Severity rating of restless legs syndrome: validation of the RLS-6 scales. Sleep. 2004;27:A304. [Google Scholar]
- 21.Allen RP, Earley CJ. Validation of the Johns Hopkins restless legs severity scale. Sleep Med. 2001;2:239–42. doi: 10.1016/s1389-9457(00)00080-0. [DOI] [PubMed] [Google Scholar]
- 22.Zucconi M, Ferri R, Allen R, et al. The official World Association of Sleep Medicine (WASM) standards for recording and scoring periodic leg movements in sleep (PLMS) and wakefulness (PLMW) developed in collaboration with a task force from the International Restless Legs Syndrome Study Group (IRLSSG) Sleep Med. 2006;7:175–83. doi: 10.1016/j.sleep.2006.01.001. [DOI] [PubMed] [Google Scholar]
- 23.Farr BM, Shapiro DE. Diagnostic tests: distinguishing good tests from bad and even ugly ones. Infect Control Hosp Epidemiol. 2000;21:278–84. doi: 10.1086/501760. [DOI] [PubMed] [Google Scholar]
- 24.Hanley JA, McNeil BJ. The meaning and use of the area under a receiver operating characteristic (ROC) curve. Radiology. 1982;143:29–36. doi: 10.1148/radiology.143.1.7063747. [DOI] [PubMed] [Google Scholar]
- 25.Allen RP, Picchietti D, Hening WA, Trenkwalder C, Walters AS, Mont-plaisir J. Restless legs syndrome: diagnostic criteria, special considerations, and epidemiology. A report from the restless legs syndrome diagnosis and epidemiology workshop at the National Institutes of Health. Sleep Med. 2003;4:101–19. doi: 10.1016/s1389-9457(03)00010-8. [DOI] [PubMed] [Google Scholar]
- 26.Boroojerdi B, Wolff HM, Braun M, Scheller DK. Rotigotine transdermal patch for the treatment of Parkinson's disease and restless legs syndrome. Drugs Today (Barc) 2010;46:483–505. doi: 10.1358/dot.2010.46.7.1463530. [DOI] [PubMed] [Google Scholar]
- 27.Garcia-Borreguero D, Williams AM. Dopaminergic augmentation of restless legs syndrome. Sleep Med Rev. 2010;14:339–46. doi: 10.1016/j.smrv.2009.11.006. [DOI] [PubMed] [Google Scholar]
- 28.Garcia-Borreguero D, Allen RP, Benes H, et al. Augmentation as a treatment complication of restless legs syndrome: Concept and management. Mov Disord. 2007;22:S476–84. doi: 10.1002/mds.21610. [DOI] [PubMed] [Google Scholar]
- 29.Garcia-Borreguero D, Kohnen R, Hogl B, et al. Validation of the Augmentation Severity Rating Scale (ASRS): a multicentric, prospective study with levodopa on restless legs syndrome. Sleep Med. 2007;8:455–63. doi: 10.1016/j.sleep.2007.03.023. [DOI] [PubMed] [Google Scholar]
Associated Data
This section collects any data citations, data availability statements, or supplementary materials included in this article.
Supplementary Materials
Multiple SIT Disturbance Scale. RLS patients and controls rated their symptoms verbally every 10 minutes to the laboratory staff.