

Abstract
Wetting properties of biomaterials, in particular nanomaterials, play an important role, as these influence interactions with biological elements, such as proteins, bacteria, and cells. In this study, the wetting phenomenon of titanium substrates coated with selenium nanoparticles was studied using experimental and mathematical modeling tools. Importantly, these selenium-coated titanium substrates were previously reported to increase select protein adsorption (such as vitronectin and fibronectin), to decrease bacteria growth, and increase bone cell growth. Increased selenium nanoparticle coating density resulted in higher contact angles but remained within the hydrophilic regime. This trend was found in disagreement with the Wenzel model, which is widely used to understand the wetting properties of rough surfaces. The trend also did not fit well with the Cassie–Baxter model, which was developed to understand the wetting properties of composite surfaces. A modified wetting model was thus proposed in this study, to understand the contributing factors of material properties to the hydrophilicity/hydrophobicity of these nanostructured selenium-coated surfaces. The analysis and model created in this study can be useful in designing and/or understanding the wetting behavior of numerous biomedical materials and in turn, biological events (such as protein adsorption as well as bacteria and mammalian cell functions).
Keywords: hydrophilicity, hydrophobicity, Wenzel model, Cassie; Baxter model, free energy, implant material, proteins, cells, bacteria
Introduction
Hydrophilicity/hydrophobicity is of paramount importance in the interaction of an implant with the biological entities in the body, often demonstrating a nonlinear behavior. When an implant is inserted into humans or animals, proteins adsorb onto the implant surface within seconds. Cells arrive at the implant surface much later (within minutes), therefore, directly interacting with such adsorbed proteins. As a result, the early responses of cells to a biomaterial (such as adhesion, migration, spreading, etc) depend largely on the nature and bioactivity of the adsorbed proteins which, in turn, depend on the specific properties of the material surface (such as hydrophilicity/hydrophobicity, surface charge, surface roughness, etc). Among the protein–surface interactions, the hydrophobic/hydrophilic interactions play an important role. Hydrophilicity and hydrophobicity are clearly the water-attracting and water-repelling properties of a material. If the material is water-repelling, it is hydrophobic. If it is water-attracting, it is hydrophilic. The most common and straightforward method to determine the hydrophobicity/hydrophilicity of a material is to measure the water contact angles on that material.
Hydrophobic/hydrophilic interactions play an important role in dictating the adsorption and folding of proteins on biomaterial surfaces. Protein molecules often have regions of different hydrophilicity. The hydrophilic regions in protein molecules tend to have attractive interactions with hydrophilic surfaces and repulsive interactions with hydrophobic surfaces. Similar observations can be deduced for the hydrophobic regions in protein molecules.1,2 These interactions, in theory, might lead to selectively increased adsorption of specific proteins and/or increased protein unfolding that can result in a higher number of binding sites for adherent cells.3
Along this line, nanostructured materials (ie, materials with at least one dimension less than 100 nm) represent an important class of biomaterials that are attracting a lot of attention from researchers due to their unconventional properties. One of these unique properties is the change in wetting behavior in the presence of nanostructured surface features. Nanostructured materials, especially materials with surface nanofeatures, have increased surface area, increased exposure of surface chemistry, altered surface roughness, etc, which importantly result in different hydrophilicity/hydrophobicity properties compared with flat surfaces of the same chemistry. In this manner, it is possible to change surface hydrophilicity/hydrophilicity through the creation of nanostructured surface features (and without changing chemistry). Such changes in surface energy will influence protein interactions, since proteins have different degrees of hydrophobic to hydrophilic regions. Hydrophobic regions on a protein attach to the hydrophobic regions on a material surface and, vice versa, hydrophilic regions attach to the hydrophilic regions on a material surface.
While the above has been discussed before, few studies have attempted to model such changes in surface energy created using nanomaterials, on protein adsorption and subsequently, cell functions. In the current study, nanoparticle selenium (Se) coatings were created on titanium (Ti) surfaces. Compared with uncoated Ti, these Se-coated Ti surfaces have been shown to be more hydrophobic and to increase the absorption of fibronectin and vitronectin, important cell-adhesive proteins that improve osteoblast (bone-forming cell) functions and inhibit bacteria functions.4–7 In this study, a more detailed analysis of the contributing factors to the wetting behavior of the coatings was conducted. A modified mathematical model was proposed and used to quantify these different distributions. Such results will help to mechanistically understand the influence of nanostructured coatings in controlling biological functions.
Materials and methods
Materials
Ti substrates (Alfa Aesar, Ward Hill, MA, USA) were individually degreased and sonicated in acetone and ethanol for 10 minutes. Cleaned Ti substrates were used as a base substrate for coating with Se nanoparticles. The substrates were exposed to 4:1 molar mixtures of glutathione (GSH, reduced form) (TCI America, Portland OR, USA) and sodium selenite (Na2SeO3) (Alfa Aesar), in the concentration ranges shown in Table 1. Selenium nanoparticles were formed on the Ti surfaces through a nucleation and growth process4 based on the following reduction reaction:
Table 1.
Reagent volumes used in the colloidal precipitation of Se nanoparticles on titanium in the present study
| Reagent | Preparation method
|
||
|---|---|---|---|
| [Se] = 0.42 mM “Low dose” | [Se] = 5 mM “Medium dose” | [Se] = 11.7 mM “High dose” | |
| Deionized water | 14.5 mL | 9 mL | 1 mL |
| 100 mM GSH | 0.25 mL | 3 mL | 7 mL |
| 25 mM Na2SeO3 | 0.25 mL | 3 mL | 7 mL |
| Final volume | 15 mL | 15 mL | 15 mL |
Abbreviations: GSH, glutathione; Na2SeO3, sodium selenite; Se, selenium; [Se], final concentration of selenium in the colloidal synthesis solution.
Note: Copyright © 2009. John Wiley and Sons. Reproduced with permission Tran PA, Sarin L, Hurt RH, Webster TJ. Titanium surfaces with adherent selenium nanoclusters as a novel anticancer orthopedic material. J Biomed Mater Res A. 2010;93(4):1417–1428.4
It is believed that the Se particles were formed to reduce the high free energy of defects and grain boundaries on the surface of the Ti substrates.
Specifically, the cleaned and sterilized Ti substrates were first placed in a 50 mL beaker, with the side to be coated facing upward. The reduced GSH solution was added to the beaker followed by the Na2SeO3 solution. Three different solution concentrations (Table 1) were used to achieve different doses, denominated as low dose, medium dose, and high dose. After a gentle mixing of the solutions in the reaction beaker, 1 M NaOH was introduced to bring the pH into the alkaline regime. The reaction mixture was once again gently mixed and left undisturbed for 10 minutes. The Ti substrates were withdrawn from the beaker and rinsed in deionized water.
Topography and surface area analysis
Surfaces of the uncoated and Se-coated Ti substrates were visualized (without a conductive coating) using a scanning electron microscope (SEM) (LEO 1530VP; Carl Zeiss Meditec, Jena, Germany), with an accelerating voltage from 3 kV to 10 kV. Surface area coverage of the Se nanoparticles was determined from SEM images, using ImageJ software (National Institutes of Health, Bethesda, MD, USA).
Contact angle measurements
Contact angles provide information about the hydrophilicity or hydrophobicity of a surface, which plays an important role in understanding the interaction of the surface with biological entities (such as proteins and cells). A contact angle measuring system (Drop Shape Analysis System DSA-10; KRÜSS GmbH, Hamburg, Germany) with analysis software (DSA1 v 1.80; KRÜSS) was used to determine the surface contact angles for the samples. A 2 μL drop of water was placed onto the substrates, and contact angles were recorded within 10 seconds, at room temperature. Pipettes with a controlled suction speed (Rainin R-10; Mettler-Toledo Inc, Columbus, OH, USA) were used, with appropriately sized pipette tips (Optimum pipette tip, catalog number 7560-100, Sigma-Aldrich, St Louis, MO, USA), to ensure accurate liquid volumes. Measurements were repeated nine times for each sample. Statistical analysis was conducted using a one-tailed Student’s t-test to compare the contact angles of the uncoated and coated substrates.
Theoretical framework and consideration
Here, a theoretical framework of contact angles and their relationship to surface energy, as well as two models for understanding contact angles on heterogeneous surfaces, are discussed to provide a background for the introduction of the modified model.
Contact angle and Young’s equation
The hydrophilicity/hydrophobicity of a material can be determined by measuring the contact angles of water drops on the material surface (as illustrated in Figure 1). If the material is water repelling (hydrophobic), a water drop on the surface of a material will have a contact angle (θ) greater than 90 degrees. Otherwise, if the material is water attracting (hydrophilic), the contact angle will be less than 90 degrees. Consider a drop of liquid on a solid substrate. If the liquid–solid interface is displaced by dx, the increase in the liquid–vapor interface is dx ⋅ cos(θ) (Figure 2). The change in total energy associated with this displacement is:
Figure 1.

Contact angle, θ, of a liquid on a solid surface depends on the interaction of the liquid with the solid, liquid with vapor, and solid with vapor.
Notes: γSL, γSV, and γLV are interfacial energies at the solid–liquid interface, solid–vapor interface, and liquid–vapor interface, respectively.
Figure 2.

Schematic illustration of the derivation of Young’s equation.
Notes: When the solid–liquid interface is displaced by dx, the increase in liquid–vapor interface is dx ⋅ cos(θ). Data from Wood et al.7
Abbreviations: θ, contact angle; cos, cosine.
| (1) |
A stable contact angle corresponds to dE/dx = 0:
| (2) |
or
| (3) |
where γSL, γSV, and γLV are the interfacial energies at the solid–liquid interface, solid–vapor interface, and liquid–vapor interface, respectively. This is Young’s contact angle equation.7
Young’s equation provides a quantitative relationship between the contact angles and physical properties of a solid, liquid, and vapor. In Young’s equation, the solid surface is assumed to be perfectly flat.
Wenzel model
To describe the effects of different degrees of surface roughness on the wetting behavior of a solid surface, Wenzel considered a drop of water on a solid surface.8 The surface energy of the wetted area (ie, under the drop [σwetted]) will be, in general, different from that of the nonwetted area (ie, not covered by the drop [σnonwetted]). Assuming σwetted < σnonwetted, the wetting process is involved in the decrease of the surface energy or wetting is energetically favorable, in another words, the surface is hydrophilic. Now, if the surface under the drop is rough instead of flat (as would be the case for nanostructured surfaces), the decrease in the surface energy of the wetting process will be greater. Therefore, rough surfaces will be more easily wetted, or more hydrophilic.
The same reasoning applies to the case of a surface that has σwetted > σnonwetted, or a water-repelling (hydrophobic) surface. There will be a net increase in surface energy during the wetting progresses. If the surface under the drop is rough instead of flat, the actual wetted surface area will be greater than the geometric area. As a result, a net increase in surface energy during wetting will be greater. In this case, roughness will make the surface more hydrophobic.
Wenzel introduced the concept of a “roughness factor” (r) that describes the increase in surface area of a rough surface compared with the geometric area:8
| (4) |
where r is always greater than 1 except in the case of a perfectly flat surface, where the actual surface and geometric surface are identical.
Considering a drop of a liquid on a rough surface, which has roughness factor of r, at equilibrium, the contact angle is θ. Imagine if the liquid–solid interface is displaced by dx, the increase in the liquid–vapor interface is dx ⋅ cos(θ), while the actual liquid–solid interface increase associated with this displacement is r ⋅ dx (Figure 3).
Figure 3.

Schematic illustration of the derivation of the Wenzel equation.8
Notes: When the solid–liquid interface is displaced by dx, the increase in liquid–vapor interface is dx ⋅ cos(θ), while the actual liquid–solid interface increase associated with this displacement is r ⋅ dx.
Abbreviations: θ, contact angle; cos, cosine.
The total energy change is then:
| (5) |
where E is the total energy of the system, and γSL, γSV, and γLV are the surface tensions at the solid–liquid interface, solid–vapor interface, and liquid–vapor interface, respectively.
A stable contact angle (θ*) corresponds to dE/dx = 0; or
| (6) |
or:
| (7) |
where θ is the contact angle of the same solid, but with a smooth surface.
The above equation indicates that if the surface, which is hydrophilic (contact angle θ < 90 degrees, cos(θ) > 0), is roughened, the cos(θ*) will be greater than cos(θ), or θ* will be smaller than θ, or the surface becomes more hydrophilic after being roughened. In other words, hydrophilic surfaces become more hydrophilic after being roughened. Similarly, if θ is greater than 90 degrees, or cos(θ) < 0, cos(θ*) will be more negative (compared with cos(θ)) or θ* will become greater than θ (and greater than 90 degrees). In other words, hydrophobic surfaces become more hydrophobic after being roughened. The underlying assumption in the Wenzel model is that the liquid–solid interface follows the solid surface, ie, wetting is homogeneous (Figure 4).
Figure 4.
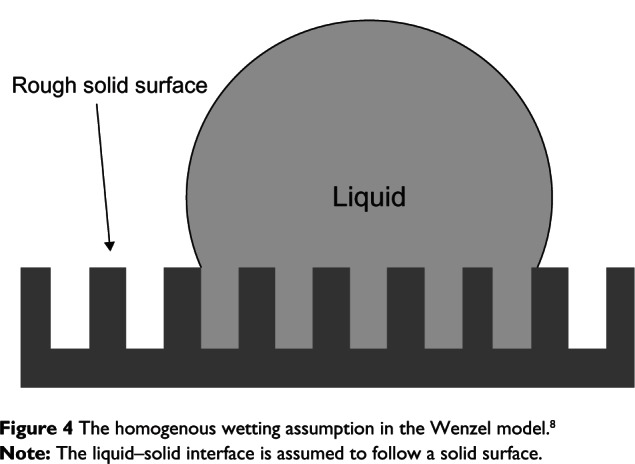
The homogenous wetting assumption in the Wenzel model.8
Note: The liquid–solid interface is assumed to follow a solid surface.
Cassie–Baxter model
Cassie and Baxter proposed a model for the wetting of a heterogeneous surface consisting of two different materials.9 The derivation of the Cassie–Baxter equation is summarized here. Consider a composite surface of two species with a surface fraction of f1 and f2 (f1 + f2 = 1). Suppose that the liquid drop is at equilibrium with a contact angle θ. Now imagine the interfacial boundary is displaced by a small amount, dx (Figure 5).
Figure 5.

A schematic illustration of the derivation of the Cassie–Baxter model.
Note: When the solid–liquid interface increases by dx, the liquid–vapor interface increases by dx ⋅ cos(θ).
Abbreviations: θ, contact angle; cos, cosine.
The energy change associated with this increase will be:
| (8) |
where γSL, γSV, and γLV are surface tensions at the solid–liquid interface, solid–vapor interface, and the liquid–vapor interface, respectively. Indices 1 and 2 denote species 1 and 2, respectively.
A stable contact angle θ corresponds to dE/dx = 0, or
| (9) |
The above equation can be re-written to obtain the Cassie–Baxter equation, as follows:
| (10) |
or
| (11) |
The Cassie–Baxter model of wetting can be applied to the case of a rough surface, where the roughness can create air pockets when wetting happens (Figure 6). In this case, because the contact angle of a liquid drop on air is considered be 180 degrees, the above equation can be rewritten as:
Figure 6.

The Cassie–Baxter model of heterogeneous wetting.
Notes: In this case, the liquid is considered to contact a surface consisting of the solid material and air. The width of spikes as well as the spacing between them is very small compared with the size of the liquid drop. To aid in visualization of the air pockets, the picture was not drawn to scale.
| (12) |
or
| (13) |
where f1 is the area fraction of the solid–liquid interface.
It was shown that the Wenzel model has been typically applied to surfaces with low or moderate roughness (r less than 1.2).10,11 However, the range of roughness, r, for the Cassie–Baxter “regime” is less consistent among different reports. Some have reported the Cassie–Baxter regime at r values greater than 1.2,10 while others have reported the regime at r values greater than 2.3.10,11 In practical terms, the latter is usually used for surfaces that have spike-structures, where air can be trapped between the spikes.
Experimental results and the modified contact angle model
SEM and surface area coverage analysis
The reduction of Na2SeO3 by GSH a mild reducing agent, in the presence of Ti substrates resulted in a Se nanoparticle coating (Figure 7). The substrates were coated with a low, medium, or high density of Se nanoparticles. It has been shown that these coatings were the result of the nucleation and growth of Se nanoparticles to reduce the surface free energy of Ti substrates.4 The zero oxidation state of Se was confirmed using X-ray photoelectron spectroscopy.4
Figure 7.

Representative SEM images of (A) uncoated Ti; (B) low-nSe-Ti; (C) medium-nSe-Ti; and (D) high-nSe-Ti.
Notes: The surface area coverage of selenium on the selenium-coated substrates were determined to be 2.7%, 5.1%, and 7.5% for low-nSe-Ti, medium-nSe-Ti, and high-nSe-Ti, respectively (n = 3), using an image processing program (ImageJ; National Institutes of Health, Bethesda, MD, USA).
Abbreviations: High-nSe-Ti, Ti substrates coated with a high density of Se nanoparticles; low-nSe-Ti, Ti substrates coated with a low density of Se nanoparticles; medium-nSe-Ti, Ti substrates coated with a medium density of Se nanoparticles; Se, selenium; SEM, scanning electron microscope; Ti, titanium.
The particles were in the range from 20 to 100 nm in diameter and were uniformly distributed on the Ti surfaces. The surface area coverage of Se nanoparticles was analyzed using image processing software (ImageJ). Results showed an increase in surface coverage, from 2.7% to 5.1% and 7.5%, with increased Se-coating density (Figure 7). This information was used in the following section for developing the new contact angle model of nano-Se-Ti substrates.
Contact angle measurements
The contact angle measurements on the uncoated Ti and Se-coated Ti substrates provided some interesting findings (Figure 8). Specifically, the uncoated Ti substrates were hydrophilic (ie, had contact angles less than 90 degrees). Coating the Ti substrates with Se increased the substrate roughness (r greater than (1)). Therefore, if the differences in chemistry between Se and Ti are ignored, the coated substrates should become more hydrophilic (ie, the contact angle should decrease) according to the Wenzel theory. However, the experimental data showed an opposite trend. Therefore, the differences in the chemistry between Se and Ti should be taken into account. Thus, the Cassie–Baxter model, which describes the contact angle of a composite surface as a function of the contact angles of the components, was used here to explain the wetting behavior of the Se-coated surfaces:
Figure 8.

Water contact angles on the uncoated (u) Ti and Ti coated with increasing Se nanoparticle densities.
Notes: Data are expressed as mean ± standard error of the mean, n = 5. *P < 0.05, compared with Se-coated substrates. Representative images of water drops were displayed on top of the bar graph.
Abbreviation: High-nSe-Ti, Ti substrates coated with a high density of Se nanoparticles; low-nSe-Ti, Ti substrates coated with a low density of Se nanoparticles; medium-nSe-Ti, Ti substrates coated with a medium density of Se nanoparticles; Se, selenium; Ti, titanium.
| (14) |
where θ is the water contact angle on the Se-coated Ti substrates, θ1 is the water contact angle on the uncoated Ti substrate, θ2 is the water contact angle on the Se substrate, f1 is the surface fraction of Ti, and f2is the surface area coverage fraction of Se, ρ, (f1 + ρ = 1); ρ was determined from SEM images and is given in Table 2.
Table 2.
Characteristics of the Ti substrates coated with different densities of Se nanoparticles
| Substrate | Selenium surface fraction, ρ,* (%) | Relative surface roughness, r** | Relative RMS, R† | cos(θ)‡ |
|---|---|---|---|---|
| uTi | 0 | 1 | 1 | 0.433 |
| Low-nSe-Ti | 2.4 | 1.0373 | 1.204 | 0.274 |
| Medium-nSe-Ti | 5.0 | 1.050 | 1.556 | 0.262 |
| High-nSe-Ti | 6.2 | 1.054 | 1.748 | 0.220 |
Notes:
Determined from SEM images;
determined from AFM, normalized by that of the uncoated substrates;
normalized to that of uncoated substrates;
calculated from measured contact angles.
Abbreviations: AFM, atomic force microscopy; high-nSe-Ti, Ti substrates coated with a high density of Se nanoparticles; low-nSe-Ti, Ti substrates coated with a low density of Se nanoparticles; medium-nSe-Ti, Ti substrates coated with a medium density of Se nanoparticles; RMS, root mean square roughness; Se, selenium; SEM, scanning electron microscope; Ti, titanium; uTi, uncoated Ti substrates.
The relative surface roughness ratio was calculated by dividing the surface roughness ratio of the sample by the surface roughness ratio of the uncoated substrates. Similarly, the relative root mean square roughness (RMS) was calculated by dividing the RMS of the sample by the RMS of the uncoated substrate. Data was obtained from atomic force microscopy (AFM) experiments4 (data not shown here). θ2 was measured on a flat elemental Se surface and found to be 83.5 ± 1.4 degrees.
Using Equation 12, a cos(θ) versus f2 curve was constructed, based on the Cassie–Baxter model, for the Se-Ti composite surfaces. However, the experimental data did not fit well to this curve (Figure 9). The experimental values of cos(θ) were lower than that were predicted by the Cassie–Baxter model.
Figure 9.

The Cassie–Baxter model curve and the experimental curve of the cosine of water contact angles on uncoated titanium substrates and titanium substrates coated with various amounts of selenium nanoparticles.
Abbreviations: θ, contact angle; cos, cosine.
From the comparison of the cos(θ) versus Se surface percentage curves between the Cassie–Baxter model and the experimental data, it can be speculated that during contact angle measurements on the Se-coated surfaces, there was formation of air pockets on the Se-coated samples that made the contact angles larger (consequentially, smaller values of cos(θ)). It can be imagined that the higher Se-coating density had higher RMS roughness values that, according to the Wenzel theory, made the contact angles decrease. However, the surfaces with higher roughness could also have had more air pockets that made the contact angles increase. Therefore, with the contribution from both roughness and air pockets, the contact angles of the three different coating densities were not significantly different (Figure 10).
Figure 10.

Possible mechanisms for the plateau in contact angles in the substrates with different selenium-coating densities.
Notes: Increasing coating density of selenium nanoparticles increased the roughness and resulted in both increase in the roughness factor (which is the actual surface area to geometric area ratio) and increase in the formation of air pockets. The former made contact angles decrease, while the latter made contact angles increase. The opposite contribution of the roughness factor and air pockets is likely the mechanism underlying the similar contact angles for the three selenium-coating densities on titanium studied here.
To quantify the contribution of each factor to contact angles, a modified Cassie–Baxter model was introduced to take into account the contribution of surface roughness, Se chemistry, and the contribution of air pockets.
Modified wetting model
It can be seen from the discussion of the Cassie–Baxter model that air pockets that form during contact angle measurements will increase the contact angles. Therefore, from the comparison of the cos(θ) versus Se surface percentage curves between the Cassie–Baxter model and experimental data, it can be speculated that there were air pockets, which increased the contact angles (and consequently, decreased the values of cos(θ)). Also, because the roughness ratio, r of the Se-coated substrates was smaller than 1.1, it is reasonable to adapt the Wenzel model to the Cassie–Baxter model as follows:
| (15) |
where r is the surface roughness ratio as defined by Equation 2; f1, f2, and f3 are the surface area fractions of Ti, Se, and air, respectively; and θ1, θ2, and θ3 are the contact angles on Ti, Se, and air, respectively (f1 + f2 + f3 = 1 and θ3 = 180°). In this modified model, the liquid drop is in contact with all three materials: Ti, Se, and air (as seen in Figure 11).
Figure 11.

Schematic representation of the modified Cassie–Baxter model on the wetting process.
Notes: A drop of liquid makes contact to all three materials, titanium, selenium nanoparticles, and air, when placed on a selenium–titanium composite surface.
Clearly, f2 now is not necessarily the same as the surface fraction, ρ, of the Se nanoparticles, as determined from SEM pictures. In the most general sense, all three parameters (f1, f2, and f3) are dependent on ρ, r and R. To simplify this problem, it is assumed that f2 and ρ are equal and that f3 is a function of ρ, R, and r. To further simplify the model, since the values of r do not vary significantly among the substrates (see Table 2), it was assumed that f2 had no dependence on r and had the following form:
| (16) |
where A, B, and C are fitting parameters. Because ρ, r, and R are dimensionless by their definitions (see Table 2), A, B, and C are also dimensionless. Physically, A and B represent the contribution to the air-pocket formation from (1) the surface coverage of Se on Ti and (2) the increased RMS roughness of the composite surface, respectively, whereas C represents the interplay of both (1) and (2) in air-pocket formation because they are not independent (specifically, increasing ρ increases R). The factor (R–1) comes from the requirement that f3 is 0 when ρ = 0 and R = 1.
Now, f1 can be calculated by:
| (17) |
Equation 13 can now be rewritten as:
| (18) |
Solving a set of three linear equations with three unknowns, one can determine that A = 0.089, B = −0.184, and C = −0.030.
Recall that:
| (19) |
and
| (20) |
The positive value of A and negative value of B indicate the different contributions to the air-pocket formation and, eventually, to the value of cos(θ). This different (in fact, counteractive) contribution explains the plateau of the values of cos(θ) for the three coating densities in this study. However, the negative value of B implies that increasing surface roughness led to a decrease in air-pocket formation, which is nonintuitive because one expects there would be more air pockets trapped between the gaps created by the rough features on the Se-coated surface. This analysis can be understood as follows. The underlying assumption of the Wenzel model is that the liquid–solid interface follows the solid surface. In the meantime, the underlying assumption in the Cassie–Baxter model for the case of air-pocket formation is that the liquid–solid interface does not follow the solid surface. Therefore, the formation of air pockets can be considered as the indication of the degree of “non-Wenzel properties” in the contact angle measurement. In other words, f3 also contains information about the “Wenzel properties”. The fact that B is negative is in an agreement with this statement; increasing surface roughness (ie, increasing R) led to decreased f3, therefore, increased value of cos(θ) or decreased contact angle. Similarly, a negative value of C indicates another contribution of the Wenzel model, in the modified model proposed in this thesis.
Discussion
Nanostructured materials possess unusual properties, many of which were shown to be valuable for implantable materials. Studies have shown an increased adsorption of proteins, such as fibronectin and vitronectin (important cell-adhesive proteins), leading to improved functions of cells (such as the deposition of calcium by osteoblasts) on nanorough surfaces.12–15 Protein–implant interactions, in turn, are dictated by several factors, among which surface wetting is of paramount importance.
However, the wetting behavior of a nanostructured surface is far from being completely understood because of the complex morphology and interactions that lead to potentially reduced surface energy. The problem becomes more complicated when the surface is heterogeneous in terms of chemical composition and topology. Understanding the different contributing factors to surface hydrophilicity/hydrophobicity will help researchers to engineer surface structures to have desirable interactions with biological entities.
However, it is a complex problem to differentiate and quantify the various contributions affecting the wetting properties of such surfaces. The current study examined closely the wetting phenomenon of Ti surfaces coated with Se nanoparticles. These coated surfaces were previously reported to promote protein (such as fibronectin) adsorption and increase osteoblast functions (such as adhesion, proliferation, and differentiation).4 In this study, these coated surfaces were shown to have significantly larger water contact angles compared with the uncoated surface. However, they were still in the hydrophilic regime (ie, water contact angles less than 90 degrees). This trend was found to be in contrast with predictions made by the Wenzel model, which predicts lower contact angles on rougher hydrophilic surfaces.
Another well-known mathematical model of contact angles was then used to interpret the experimental results. The Cassie–Baxter model of contact angles is usually used to understand the wetting behavior of composite surfaces. However, the experiment data did not fit with the theoretical prediction based on this model. Therefore, a modified wetting model was proposed in this study, to take into account both the increased roughness and multicomponent properties of the Se-coated Ti substrates. The modified model was used to quantify the contributions of surface roughness and air-pocket formation on the measured values of the contact angles. It was demonstrated that these two factors contributed counteractively to the final wetting properties, and through mathematical fitting, these effects were quantified. Experiments should be designed to validate these calculations as well as to correlate with the experimental results of protein adsorption.
Conclusion
This current study examined the wetting behavior of complex, nanostructured surfaces: Ti coated with Se nanoparticles. Ti implants coated with Se nanoparticles have been shown to decrease bacterial density and increase bone forming cell functions. The wetting properties of the coated surfaces (ie, more hydrophobic compared with the uncoated surface) contradicted the prediction of the Wenzel model, which implies increased hydrophilicity with increased surface roughness. These properties also did not follow the prediction of the Cassie–Baxter model, which was developed for surfaces of multiple compositions. A modified wetting model was proposed to take into account the contributing factors in both the Wenzel and Cassie–Baxter models as well as the formation of air pockets. This model was shown to explain the wetting properties of these nanostructured surfaces. In summary, this new model has the potential to be used by researchers in designing or engineering nanostructured surfaces to optimally interact with biological entities (such as proteins, bacteria and cells). It can also be used to help understand the wetting phenomena of nanostructured materials.
Acknowledgment
The authors would like to thank the Hermann Foundation for funding.
Footnotes
Disclosure
The authors report no conflicts of interest in this work.
References
- 1.Roach P, Farrar D, Perry CC. Interpretation of protein adsorption: surface-induced conformational changes. J Am Cheml Soc. 2005;127(22):8168–8173. doi: 10.1021/ja042898o. [DOI] [PubMed] [Google Scholar]
- 2.Song SW, Hidajat K, Kawi S. Functionalized SBA-15 materials as carriers for controlled drug delivery: influence of surface properties on matrix-drug interactions. Langmuir. 2005;21(21):9568–9575. doi: 10.1021/la051167e. [DOI] [PubMed] [Google Scholar]
- 3.Horbett TA. Adsorption of proteins from plasma to a series of hydrophilic-hydrophobic copolymers. II. Compositional analysis with the prelabeled protein technique. J Biomed Mater Res. 1981;15(5):673–695. doi: 10.1002/jbm.820150506. [DOI] [PubMed] [Google Scholar]
- 4.Tran PA, Sarin L, Hurt RH, Webster TJ. Titanium surfaces with adherent selenium nanoclusters as a novel anticancer orthopedic material. J Biomed Mater Res A. 2010;93(4):1417–1428. doi: 10.1002/jbm.a.32631. [DOI] [PubMed] [Google Scholar]
- 5.Tran PA, Webster TJ. Webster TJ. Nanomedicine: Technologies and Applications. Cambridge, UK: Woodhead Publishing; 2012. Nanostructured selenium anti-cancer coatings for orthopaedic applications; pp. 180–235. [Google Scholar]
- 6.Good RJ. Contact angle, wetting, and adhesion: a critical review. Journal of adhesion science and technology. 1992;6(12):1269–1302. [Google Scholar]
- 7.Tran PA, Webster TJ. Selenium nanoparticles inhibit Staphylococcus aureus growth. Int J Nanomedicine. 2011;6:1553–1558. doi: 10.2147/IJN.S21729. [DOI] [PMC free article] [PubMed] [Google Scholar]
- 8.Wenzel RN. Surface roughness and contact angle. J Phys Chem. 1949;53(9):1466–1467. [Google Scholar]
- 9.Cassie ABD, Baxter S. Wettability of porous surfaces. Trans Faraday Soc. 1944;40:546–551. [Google Scholar]
- 10.Yoshimitsu Z, Nakajima A, Watanabe T, Hashimoto K. Effects of surface structure on the hydrophobicity and sliding behavior of water droplets. Langmuir. 2002;18(15):5818–5822. [Google Scholar]
- 11.Ishino C, Okumura K, Quéré D. Wetting transitions on rough surfaces. Europhys Lett. 2004;68(3):419. [Google Scholar]
- 12.Webster TJ, Ejiofor JU. Increased osteoblast adhesion on nanophase metals: Ti, Ti6Al4V, and CoCrMo. Biomaterials. 2004;25(19):4731–4739. doi: 10.1016/j.biomaterials.2003.12.002. [DOI] [PubMed] [Google Scholar]
- 13.Webster TJ, Ergun C, Doremus RH, Siegel RW, Bizios R. Enhanced functions of osteoblasts on nanophase ceramics. Biomaterials. 2000;21(17):1803–1810. doi: 10.1016/s0142-9612(00)00075-2. [DOI] [PubMed] [Google Scholar]
- 14.Webster TJ, Ergun C, Doremus RH, Siegel RW, Bizios R. Specific proteins mediate enhanced osteoblast adhesion on nanophase ceramics. J Biomed Mater Res. 2000;51(3):475–483. doi: 10.1002/1097-4636(20000905)51:3<475::aid-jbm23>3.0.co;2-9. [DOI] [PubMed] [Google Scholar]
- 15.Webster TJ, Schadler LS, Siegel RW, Bizios R. Mechanisms of enhanced osteoblast adhesion on nanophase alumina involve vitronectin. Tissue Eng. 2001;7(3):291–301. doi: 10.1089/10763270152044152. [DOI] [PubMed] [Google Scholar]