

Abstract
Measuring intracellular temperature is critical to understanding many cellular functions but still remains challenging. Here, we present a technique–fluorescence-assisted photoacoustic thermometry (FAPT)–for intracellular temperature mapping applications. To demonstrate FAPT, we monitored the intracellular temperature distribution of HeLa cells with sub-degree (0.7 °C) temperature resolution and sub-micron (0.23 μm) spatial resolution at a sampling rate of 1 kHz. Compared to traditional fluorescence-based methods, FAPT features the unique capability of transforming a regular fluorescence probe into a concentration- and excitation-independent temperature sensor, bringing a large collection of commercially available generic fluorescent probes into the realm of intracellular temperature sensing.
Many cell events are accompanied by intracellular temperature change, such as cell division, nutrient metabolism, and gene expression.1, 2, 3 Accurately measuring cellular temperature can, in turn, contribute to a deeper understanding of biochemical processes inside a cell. Although cellular thermometry has been realized at the single-cell level by employing tools, such as micro- or nano-scale thermocouples,4, 5 fluorescence nanoparticles or nanogels,6, 7 and a photoacoustic (PA) thermometer,8 most of these techniques have treated a cell as a whole and measured its average temperature. Knowledge of the average cellular temperature is insufficient for exploring thermogenesis and thermal dynamics at the level of subcellular structures.2
The difficulty of achieving intracellular temperature mapping lies in a fact that it requires measuring a physical quantity sensitive to local temperature changes but independent of the sensor's concentration and excitation strength. Only two fluorescence-based techniques have realized intracellular temperature mapping, utilizing fluorescence lifetime9 and polarization anisotropy,10 respectively. Despite the high spatial (sub-micron) and temperature resolution (∼0.5 °C) they have accomplished in cellular imaging experiments, both methods rely on custom-developed fluorescent biosensors, limiting their accessibility to only a few laboratories.
A major impetus towards the widespread application of fluorescence microscopy is the ongoing development of fluorescent probes, which display excellent selective labeling of cellular structures.11 However, most commercially available fluorescent probes were not intended to be temperature sensitive. To expand the toolbox of intracellular temperature mapping technique and make it accessible to a much broader biological research community, here we present a method–fluorescent-assisted photoacoustic thermometry (FAPT), which integrates fluorescence microscopy with photoacoustic thermometry on one platform. FAPT features the unique capability of transforming a generic fluorescent probe into a concentration- and excitation-independent intracellular temperature sensor.
Upon absorbing a photon, a fluorophore's electron transits from the ground state to an excited state. The electron's energy is released primarily via two paths:12, 13 radiative decay, i.e., fluorescence, or non-radiative decay, i.e., thermal dissipation. The possibility of an electron following either of these two decay approaches is described by the fluorophore's quantum yield η. After excitation, the emitted fluorescence intensity equals13
| (1) |
where A is a constant, F is optical fluence (J/cm2), and is the absorption coefficient (cm−1). is dependent on the fluorophore's concentration and its molecular absorption cross-section.
On the other hand, if the excitation light is a short pulse, the generated heat during non-radiative decay produces an ultrasonic wave via thermoelastic expansion. The detected photoacoustic amplitude is13, 14
| (2) |
In Eq. 2, B is a constant and Γis the Grüneisen coefficient, which is temperature dependent by an empirical relation15
| (3) |
where T is the local temperature, and C1 and C2 are constants.
Traditional photoacoustic thermometry15, 16, 17 calculates the temperature map from Eq. 2 and Eq. 3, i.e.,
| (4) |
However, the temperature mapping derived by Eq. 4 is affected by the F and distributions–it is accurate only when can be considered as uniform and F can be accurately measured.
To eliminate the effect of and F on the temperature mapping measurement, we collect fluorescence and PA signals simultaneously at each scanning point. Substituting in Eq. 4 with the corresponding fluorescence intensity in Eq. 1 gives
| (5) |
In FAPT, a new quantity R is defined as the ratio of the photoacoustic amplitude P to the fluorescence intensity If. For a fluorophore whose quantum yield η is insensitive to temperature changes, Eq. 5 can be simplified as
| (6) |
where the coefficients and are independent of and F and remain constant for the same fluorophore, and R = P/If. Since and can be calibrated for, by measuring the ratio R at each scanning point, the corresponding local temperature can be derived.
The FAPT was built on a previously described sub-micron resolution PAM system.18 The system setup is shown in Fig. 1. A pulsed laser (wavelength: 532 nm, pulse duration: ∼5 ns) both excited the fluorescence and generated photoacoustic signals. Two objectives, with NA = 0.32 (Leitz Wetzlar Phaco 10×) and NA = 1.40 (Olympus PLAPO 60×), focused the excitation laser and collected fluorescence signal. The spatial resolutions corresponding to these two objectives were 0.82 μm and 0.23 μm, respectively. A combination of an excitation filter (central wavelength 532 nm, bandwidth 3 nm), a dichroic beamsplitter (transmission wavelength 400–530 nm, reflection wavelength 575 nm-725 nm), and an emission filter (central wavelength 559 nm, bandwidth 34 nm) separated excitation light from fluorescence. The fluorescent light was detected by a photomultiplier tube (PN: PMM01, Thorlabs Inc.), while the PA signal was acquired by a custom-made focused ultrasound transducer with a central frequency of 40 MHz and a numerical aperture of 0.5. In order to obtain a 2D temperature map, the sample was raster scanned across the region of interest.
Figure 1.
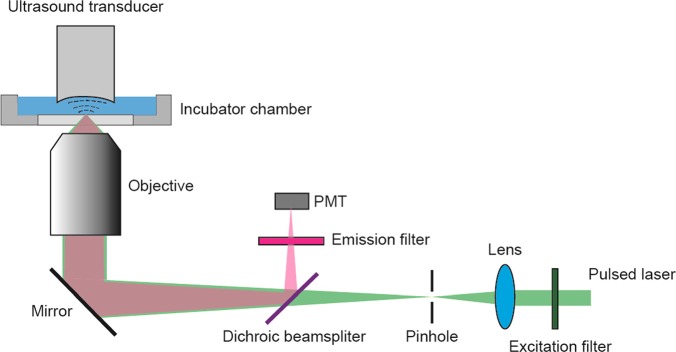
FAPT system set up. The fluorescence and PA signals were measured simultaneously at each scanning point. PMT: Photomultiplier tube.
The sample was immersed in phenol-red free medium (PN: 21063–029, Life technologies) in an incubator chamber (PN: CSC-25, Bioscience Tools), whose temperature could be finely adjusted (step: 0.01 °C) by the accompanying controller (PN: TC-1-100 s, Bioscience Tools). The temperature of the incubator chamber was monitored by a thermocouple (ON-401-PP, Omega) immersed in the bath.
To demonstrate FAPT, we imaged the temperature of a phantom, using a common fluorescent dye, Rhodamine 6 G, as the temperature sensor. The excitation and emission maxima of Rhodamine 6 G are at 530 nm and 552 nm, respectively, with a stable quantum yield over a wide temperature range.19, 20
To calibrate the relation between the PA/fluorescence ratio R and temperature for Rhodamine 6 G, first we measured the PA and fluorescence signals simultaneously from a thin layer of Rhodamine 6 G in aqueous solution (0.5 mM concentration) at different temperatures. The results are shown in Figs. 2a, 2b, 2c. Here, the PA signals were averaged over a 0.1 × 0.1 mm2 area for 10 s, and the temperature T was measured by the thermocouple in the bath while it rose from 25 °C to 37 °C (Fig. 2a). Fig. 2b implies that the PA signal generally increased with temperature T. However, fluctuations in both laser pulse energy and dye concentration caused by photobleaching and diffusion diverted this relation from linearity and were also revealed by the corresponding fluorescence variations as shown in Fig. 2c. However, the PA/fluorescence ratio, R, had a close linear relationship with the temperature (Fig. 2d), where the coefficient of determination for the linear fit is 0.98. Hence, the influences of laser pulse energy and dye concentration fluctuations were eliminated by taking the ratio. The relative increase of R per degree at 25 °C was 4%, which is in good agreement with previous studies.21
Figure 2.

Calibration of PA/fluorescence ratio versus temperature. (a) Temperature versus measurement index. (b) PA amplitude versus measurement index. (c) Fluorescence intensity versus measurement index. (d) PA/fluorescence ratio R versus temperature T. The coefficient of determination is 0.98 for the linear fit.
The uncertainty of the derived temperature from Eq. 5 was estimated as
| (7) |
The noise contributed by the fluorescence was considered as shot-noise limited, and calculated as
| (8) |
where N is the number of fluorescent photons that the system acquired. On the other hand, the noise item contributed by PA was normally dominated by thermal noise and interference noise,22 which are highly dependent on the specifics of the experimental setup. In this particular experiment, we measured the signal-to-noise (SNR) of PA and fluorescence at each calibration temperature. The average values were 21 dB and 40 dB, respectively. Since , Eq. 7 was simplified as
| (9) |
Thus, the uncertainty of the derived temperature approximates 0.08 T. At 25 °C, this value is around 2 °C. The relative low temperature resolution here is due to the weak PA signal generated by the fluorophore. To keep the excitation within the linear excitation range, we used moderate excitation pulse energy, ∼70 nJ (laser fluence at the focus: 2.2 J/cm2). Since the quantum yield of Rhodamine 6 G is around 95%, the majority of absorbed light energy is converted to fluorescence, resulting in unbalanced signal distribution between the fluorescence and PA channels. However, if higher temperature resolution is desired, PA signals can be averaged over time to improve their SNR.
Next, based on this calibration, we measured the 2D temperature gradient of a heated phantom. A thin layer of Rhodamine 6 G aqueous solution (0.5 mM concentration) was smeared on a piece of glass slide, which was then heated at one end by a metal wire illuminated by a 50 mW near-infrared laser at 1064 nm. The microscope objective (Leitz Wetzlar Phaco 10×) with NA = 0.32 focused excitation light and collected fluorescence. The temperature gradients close to the wire, imaged by FAPT before and after heating, are shown in Figs. 3a, 3c, respectively. As expected, before heating, the temperature was uniform across the field (Fig. 3b); after heating, the measured temperature gradually decreased from the heated end (right) to the un-heated end (left) (Fig. 3d). The temperature profiles shown in Figs. 3b, 3d were calculated by averaging over the entire range along the y axis.
Figure 3.

2D temperature mapping of a thin layer of Rhodamine 6 G dye. The phantom sample was heated at the right end. The FAPT-recovered temperature mapping (a) before and (c) after heating. Vertically averaged temperature profile along the horizontal direction (b) before and (d) after heating.
We applied FAPT to cellular temperature imaging. A mitochondrion is a cellular organelle that produces energy and heat via oxidization. Temperature imaging of mitochondria would help to understand cellular metabolism.2 Here, we stained HeLa cells (30–40 μm in diameter) with a commercially available fluorescent dye–MitoTracker orange (PN: M-7510, Life technologies, Inc.) and monitored the mitochondria temperature during environmental temperature changes.
The HeLa cells grew in Dulbecco's Modified Eagle Medium with 10% fetal bovine serum and 1% penicillin/streptomycin supplement. The cells were incubated at 37 °C in 5% CO2 and split every 72 h. After being dispersed in 0.25% EDTA-trypsin, they were seeded at 2–4 × 10⁴ cells per square centimeter. Culture medium was removed 24 h after imbedding cells on a cover glass and replaced by staining solution, a fresh culture medium containing 10 μM MitoTracker Orange probes (PN: M-5710, Life technologies). After incubation in staining solution for 60 min, the cells were rinsed twice with fresh medium. After staining, cells were trypsinized, collected, and suspended in extraction buffer (PN: FNN0011, Life technologies). To inhibit proteolysis, 50 μL of protease inhibitor cocktail (PN: P2714, Sigma-Aldrich) for each milliliter of buffer and 0.5 mM phenylmethanesulfonyl fluoride (PN: P7626, Sigma-Aldrich) were added before the extraction. Cells with the extraction solution were kept on ice for 40 min with occasional vortexing. The lysate was clarified by centrifugation at 13000× g for 15 min.
To be eligible for FAPT imaging, the quantum yield of the chosen fluorescent dye must be temperature-insensitive. Since insensitivity had not been reported for the fluorescent dye MitoTracker orange, we first measured it in aqueous solution. By exciting the fluorophore and collecting the corresponding fluorescence at each temperature, the relation between fluorescence intensity and temperature was acquired (Fig. 4a). The result shows that the quantum yield of MitoTracker orange is stable over 25 °C–37 °C, a temperature range of interest in cellular studies.9, 10
Figure 4.

Intracellular mitochondrial temperature mapping by FAPT. (a) The temperature dependence of fluorescence intensity for the fluorophore MitoTracker orange. The quantum yield of MitoTracker orange is stable over a temperature range of 25 °C–37 °C. (b) The PA/fluorescence ratio R versus temperature for the Mito Tracker orange fluorophore. The coefficient of determination is 0.995 for the linear fit. (c)–(e) PA, fluorescence, and FAPT-recovered mitochondrial temperature map at 36 °C. (f)–(h) PA, fluorescence, and FAPT-recovered mitochondrial temperature map at 27 °C. The dark blue background in (e) and (h) denotes unknown temperatures. (i) and (j) The temperature histograms of (e) and (h). The mean values are 35.9 and 27.0 °C, respectively.
Then, by following a procedure similar to that in the phantom experiment, we calibrated the relation between the PA/fluorescence ratio R and temperature for MitoTracker orange in cell extract (Fig. 4b). The coefficient of determination is 0.995 for the linear fit. The SNR of the measured PA and fluorescence signals were 33 and 49 dB, respectively, resulting in ∼0.7 °C temperature resolution in the presented experiment. Note that the temperature resolution is higher here than that measured in the phantom experiment, because MitoTracker orange has a lower quantum yield than Rhodamine 6 G and thus a more balanced PA signal versus fluorescence.
Next, the HeLa cells stained with MitoTracker orange were imaged by FAPT at environmental temperatures of 36.0 and 27.0 °C. The microscope objective (Olympus PLAPO 60×) with NA = 1.4 focused excitation light and collected fluorescence. Figs. 4c, 4d, 4e show the measured PA, fluorescence, and FAPT-recovered mitochondrial temperature map acquired at 36 °C, respectively. Figs. 4f, 4g, 4h show the corresponding images acquired at 27 °C. Since MitoTracker orange was selectively stained on the mitochondria, few photoacoustic and fluorescence signals were measured in other cellular organelles. The unknown temperature outside mitochondria was pseudo-colored as dark blue in Figs. 4e, 4h. Additionally, the histograms of measured intracellular temperature distribution were also calculated (Figs. 4i, 4j). The mean values are 35.9 and 27.0 °C, respectively, in good agreement with the corresponding environmental temperatures. Note that the standard deviation of measured cellular temperature (0.4 °C) at 36.0 °C is higher than that (0.2 °C) at 27.0 °C, which may indicate the cells being more active in heat production and consumption at body temperature.
In summary, we presented a generic technique, FAPT, for intracellular temperature mapping applications. Phantom and cellular experiments demonstrated that FAPT is capable of measuring the 2D temperature distribution of an optically thin sample with sub-micron spatial resolution and sub-degree temperature resolution.
Compared to previous fluorescence-based methods, FAPT features the unique capability of transforming a regular fluorescence dye into a concentration- and excitation-independent temperature sensor, a fact that opens up the possibility of utilizing a large collection of commercially available fluorescent probes for intracellular temperature sensing applications. This advantage should facilitate the conversion of intracellular temperature mapping into a routine lab tool and make it accessible to a much broader research community. Additionally, since environmental temperature can affect cellular activities by changing enzyme activity,23 membrane characteristics,24 or ion channel gating,25 FAPT can be utilized to study the dependence of cellular thermogenesis or reaction on environmental temperature changes, a knowledge that would promote our understanding of cellular metabolism regulation and diagnosis of related diseases.
Acknowledgments
We would like to thank Dr. Lijun Ma, Dr. Lidai Wang, Yan Liu, and Yu Wang for their constructive suggestions on the experiments. This work was sponsored by the National Institutes of Health (NIH) under Grant Nos. R01 EB000712, R01 EB008085, R01 CA134539, U54 CA136398, R01 CA157277, R01 CA159959, and DP1 EB016986 (NIH Director's Pioneer Award). L. V. Wang has a financial interest in Microphotoacoustics, Inc., and Endra, Inc.; however, neither provided support for this work.
References
- Bahat A., Tur-Kaspa I., Gakamsky A., Giojalas L. C., Breitbart H., and Eisenbach M., Nat. Med. 9(2), 149–150 (2003). 10.1038/nm0203-149 [DOI] [PubMed] [Google Scholar]
- Lowell B. B. and Spiegelman B. M., Nature 404(6778), 652–660 (2000). 10.1038/35007527 [DOI] [PubMed] [Google Scholar]
- Kamei Y., Suzuki M., Watanabe K., Fujimori K., Kawasaki T., Deguchi T., Yoneda Y., Todo T., Takagi S., Funatsu T., and Yuba S., Nat. Methods 6(1), 79–81 (2009). 10.1038/nmeth.1278 [DOI] [PubMed] [Google Scholar]
- Suzuki M., Tseeb V., Oyama K., and Ishiwata S., Biophys. J. 92(6), L46–L48 (2007). 10.1529/biophysj.106.098673 [DOI] [PMC free article] [PubMed] [Google Scholar]
- Wang C. L., Xu R. Z., Tian W. J., Jiang X. L., Cui Z. Y., Wang M., Sun H. M., Fang K., and Gu N., Cell Res. 21(10), 1517–1519 (2011). 10.1038/cr.2011.117 [DOI] [PMC free article] [PubMed] [Google Scholar]
- Vetrone F., Naccache R., Zamarron A., de la Fuente A. J., Sanz-Rodriguez F., Maestro L. M., Rodriguez E. M., Jaque D., Sole J. G., and Capobianco J. A., ACS Nano 4(6), 3254–3258 (2010). 10.1021/nn100244a [DOI] [PubMed] [Google Scholar]
- Gota C., Okabe K., Funatsu T., Harada Y., and Uchiyama S., J. Am. Chem. Soc. 131(8), 2766–2767 (2009). 10.1021/ja807714j [DOI] [PubMed] [Google Scholar]
- Gao L., Wang L., Li C., Liu Y., Ke H., Zhang C., and Wang L. V., J. Biomed. Opt. 18(2), 026003 (2013). 10.1117/1.JBO.18.2.026003 [DOI] [PMC free article] [PubMed] [Google Scholar]
- Okabe K., Inada N., Gota C., Harada Y., Funatsu T., and Uchiyama S., Nat. Commun. 3, 705 (2012). 10.1038/ncomms1714 [DOI] [PMC free article] [PubMed] [Google Scholar]
- Donner J. S., Thompson S. A., Kreuzer M. P., Baffou G., and Quidant R., Nano Lett 12(4), 2107–2111 (2012). 10.1021/nl300389y [DOI] [PubMed] [Google Scholar]
- Johnson I. and Spence M. T. Z., Molecular Probes Handbook, A Guide to Fluorescent Probes and Labeling Technologies (Invitrogen, 2011). [Google Scholar]
- Lakowicz J. R., Principles of Fluorescence Spectroscopy, 3rd ed. (Springer, New York, 2006). [Google Scholar]
- Wang Y. and Wang L. V., J. Biomed. Opt. 17(8), 086007 (2012). 10.1117/1.JBO.17.8.086007 [DOI] [PMC free article] [PubMed] [Google Scholar]
- Wang L. V. and Wu H.-i., Biomedical Optics: Principles and Imaging (Wiley-Interscience, Hoboken, N.J., 2007). [Google Scholar]
- Larina I. V., Larin K. V., and Esenaliev R. O., J. Phys. D: Appl. Phys. 38(15), 2633–2639 (2005). 10.1088/0022-3727/38/15/015 [DOI] [Google Scholar]
- Chitnis P. V., Mamou J., McLaughlan J., Murray T., and Roy R. A., in IEEE International Ultrasonics Symposium (IUS) (2009), pp. 1757–1760.
- Shah J., Park S., Aglyamov S., Larson T., Ma L., Sokolov K., Johnston K., Milner T., and Emelianov S. Y., J. Biomed. Opt. 13(3), 034024 (2008). 10.1117/1.2940362 [DOI] [PMC free article] [PubMed] [Google Scholar]
- Zhang C., Maslov K., and Wang L. H. V., Opt. Lett. 35(19), 3195–3197 (2010). 10.1364/OL.35.003195 [DOI] [PMC free article] [PubMed] [Google Scholar]
- Ali M. A., Moghaddasi J., and Ahmed S. A., Appl. Opt. 29(27), 3945–3949 (1990). 10.1364/AO.29.003945 [DOI] [PubMed] [Google Scholar]
- Drexhage K. H., Top. Appl. Phys. 1, 155–200 (1990). [Google Scholar]
- Ke H., Guo Z., Erpelding T. N., Jankovic L., Grubb Iii R. L., and Wang L. V., Proc. SPIE 7899, 789938 (2011). 10.1117/12.875073 [DOI] [Google Scholar]
- Telenkov S. and Mandelis A., Rev. Sci. Instrum. 81(12), 124901–124907 (2010). 10.1063/1.3505113 [DOI] [PubMed] [Google Scholar]
- Peterson M. E., Daniel R. M., Danson M. J., and Eisenthal R., Biochem. J. 402, 331–337 (2007). 10.1042/BJ20061143 [DOI] [PMC free article] [PubMed] [Google Scholar]
- Beney L. and Gervais P., Appl. Microbiol. Biotechnol. 57(1–2), 34–42 (2001). 10.1007/s002530100754 [DOI] [PubMed] [Google Scholar]
- Cesare P., Moriondo A., Vellani V., and McNaughton P. A., Proc. Natl. Acad. Sci. U.S.A. 96(14), 7658–7663 (1999). 10.1073/pnas.96.14.7658 [DOI] [PMC free article] [PubMed] [Google Scholar]