Abstract
Cationic liposome (lipoplex) and polymer (polyplex)-based vectors have been developed for nonviral gene delivery. These vectors bind DNA and enter cells via endosomes, but intracellular transfer of DNA to the nucleus is inefficient. Here we show that lipoplex and polyplex vectors enter cells in endosomes, activate autophagy and generate tubulovesicular autophagosomes. Activation of autophagy was dependent on ATG5, resulting in lipidation of LC3, but did not require the PtdIns 3-kinase activity of PIK3C3/VPS34. The autophagosomes generated by lipoplex fused with each other, and with endosomes, resulting in the delivery of vectors to large tubulovesicular autophagosomes, which accumulated next to the nucleus. The tubulovesicular autophagosomes contained autophagy receptor protein SQSTM1/p62 and ubiquitin, suggesting capture of autophagy cargoes, but fusion with lysosomes was slow. Gene delivery and expression from both lipoplex and polyplex increased 8-fold in atg5−/− cells unable to generate tubulovesicular autophagosomes. Activation of autophagy and capture within tubulovesicular autophagosomes therefore provides a new cellular barrier against efficient gene transfer and should be considered when designing efficient nonviral gene delivery vectors.
Keywords: autophagy, cationic liposome, gene therapy, nonviral gene delivery, polyplex
Introduction
Successful gene therapy requires efficient delivery of nucleic acids into cells. Gene delivery with viral vectors (such as adenovirus and retroviruses) is highly efficient but their use has been limited by immune responses and problems associated with large-scale production. Attempts to overcome these difficulties have resulted in the development of nonviral gene delivery vectors based on immunologically inert materials that can be produced in bulk. Examples include cationic liposomes and cationic polymers, which bind nucleic acids electrostatically to form lipoplexes and polyplexes respectively and enter cells by endocytosis.1-3 When compared with viruses, gene delivery from cationic carriers is relatively inefficient because of slow escape of DNA across endosome membranes and subsequent transport of the complexes to lysosomes where DNA or RNA is degraded.4,5
Endocytosis is not the only pathway leading to degradation in lysosomes. Autophagy is a response to starvation that provides a short-term supply of amino acids by delivering material directly from the cytosol to lysosomes.6,7 During macroautophagy (referred to as autophagy hereafter), proteins and organelles are delivered to lysosomes by autophagosomes that form in the cytoplasm. This process requires at least 30 autophagy-related (ATG) proteins controlled by the nutrient-sensing kinase MTOR.8 Autophagosome formation is initiated by phosphorylation of lipids by the PtdIns 3-kinase, (catalytic subunit, PIK3C3/VPS34), and subsequent expansion of the autophagosome membrane requires BECN1, an ATG12–ATG5-ATG16L1 complex and ATG8 (LC3). LC3 is the major structural protein of autophagosomes and is used as a marker to follow autophagy in cells. Autophagy has a high capacity to deliver material to lysosomes and provides cells with a powerful means of removing potentially toxic materials such as damaged proteins and organelles. Autophagy also can provide a defense against infection by capturing and degrading intracellular microbes. This latter pathway is called ‘xenophagy’ because delivery to lysosomes leads to the removal of foreign material.9
Recent reports have suggested that some carriers used for gene delivery can activate autophagy, but this has not been studied in detail. Cationic polyplex, for example, colocalize with autophagosome markers,10 and autophagosomes can be induced by cationic liposomes11 and calcium phosphate precipitates used for DNA transfection.12,13 In this study we have tested the hypothesis that cationic lipoplex and polyplex carriers not only induce and localize with autophagosomes, but that they also become targets for autophagy/xenophagy, and that subsequent capture within autophagosomes significantly compromises gene transfer and expression efficiency. Our results show that cationic nonviral vectors activate autophagy and generate autophagosomes as they enter cells by endocytosis. The endosomes containing cationic carriers fuse with autophagosomes and generate large tubulovesicular structures containing the autophagosome structural protein, LC3. Importantly, reporter gene expression increased up to 10-fold in cells unable to make autophagosomes. Autophagosome capture can therefore be considered as a new barrier to gene delivery where tubulovesicular autophagosomes, rather than endosomes, slow transfer of nucleic acids to the cytosol.
Results
Cationic liposomes, polyplex and calcium phosphate precipitates induce formation of tubulovesicular autophagosomes
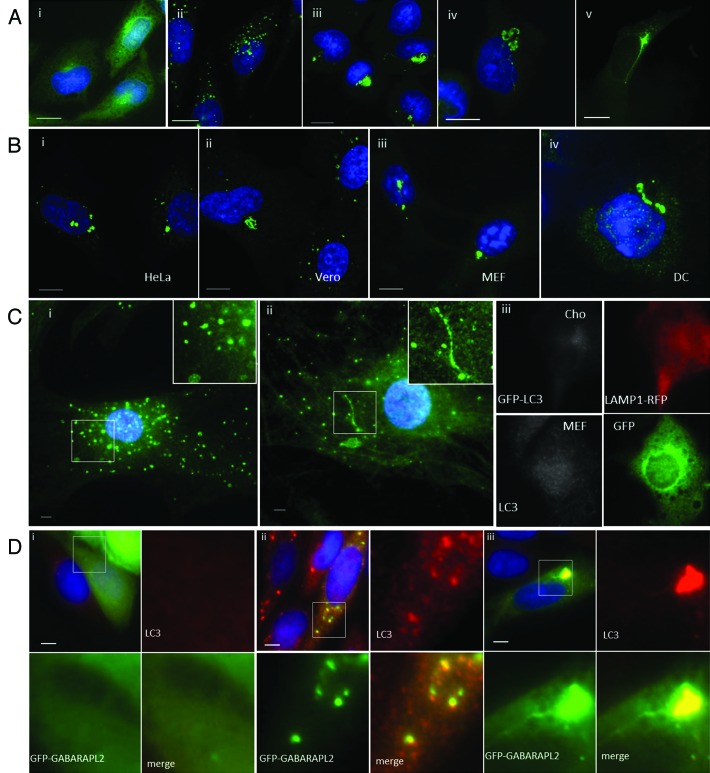
A side-by-side comparison of autophagosomes generated by lipoplex and polyplex and calcium phosphate precipitates (CPP) was performed using CHO cells expressing GFP-LC3. Autophagosome formation was monitored by following the movement of LC3 from the cytosol to fluorescent puncta indicative of autophagosomes (Fig. 1A). GFP-LC3 was located to the cytoplasm in nutrient media (Fig. 1A, i) and to several small GFP-LC3 puncta located throughout the cytoplasm following starvation in HBSS (Fig. 1A, ii). When lipoplex (Transfast) (Fig. 1A, iii), CPP (Fig. 1A, iv) or polyplex (Jetprime) (Fig. 1A, v) were added in nutrient media, large GFP-LC3-positive structures clustered close to the nucleus and each case the LC3 signal was contained within a complex of vesicles and tubules. The results showed that all three gene-delivery vectors induce the formation of tubulovesicular autophagosomes (TVAs) rather than classical autophagosomes. The response of different cell types to lipoplex was determined by immunostaining for endogenous LC3 (Fig. 1B). Large TVAs were generated in human (HeLa, Fig. 1B, i) and primate (Vero, Fig. 1B, ii) transformed cell lines, mouse embryonic fibroblasts (MEFs) (Fig. 1B, iii) and primary mouse dendritic cells (Fig. 1B, iv). Autophagosome formation in primary cultures of mouse skin cells following starvation or addition of lipoplex was also compared (Fig. 1C). As seen for transformed cells, LC3 was located to small LC3 puncta following starvation in HBSS (Fig. 1C, i) and TVAs and small LC3 puncta were observed following addition of lipoplex in nutrient media (Fig. 1C, ii). Electroporation is an alternative means of delivering nucleic acids into the cytoplasm. The effect of electroporation on autophagosome formation was tested using plasmids expressing fluorescent reporter proteins (Fig. 1C, iii). CHO GFP-LC3 cells expressing LAMP1-RFP, or MEF cells expressing GFP, were identified as cells that had taken up nucleic acid. Electroporation failed to induce redistribution of GFP-LC3 in CHO cells (top panel) or endogenous LC3 in MEF cells, suggesting that delivery of DNA to the cytosol does not induce formation of TVAs. Mammalian cells express two sub-groups of LC3 based on amino acid sequence similarities. The LC3 subgroup comprises LC3A/B/C whereas GABARAP, GABARAPL1 and GABARAPL2 are within the GABARAP subgroup. GFP-GABARAPL2 redistributes from the cytoplasm (Fig. 1D, i) to fluorescent puncta containing endogenous LC3 following starvation (Fig. 1D, ii), and was incorporated into TVAs when cells were incubated with lipoplex (Fig. 1D, iii).
Figure 1. Cationic lipoplex, polyplex and calcium phosphate precipitates induce formation of tubulovesicular autophagosomes. CHO cells expressing GFP-LC3 were used to monitor autophagosome formation. Nuclei were stained with DAPI. Scale bar: 10 μm. (A) Cells were incubated in nutrient media (i), or starved in HBSS (ii). When incubated in nutrient media containing cationic lipoplex (iii) calcium phosphate precipitate complexed with DNA (iv) or polyplex. (B) Different cell types were incubated with lipoplex (Transfast) and immunostained for endogenous LC3 after 4 h. HeLa cells (i), Vero cells (ii), murine embryonic fibroblasts (iii), primary culture of murine dendritic cells. (C) Primary cultures of murine skin fibroblasts were incubated in starved in HBSS for 4 h (i) or incubated with lipoplex for 4 h (ii) and immunostained for endogenous LC3 (green). Insets show region of interest at higher magnification. (iii) CHO cells expressing GFP-LC3 were electroporated in the presence of a plasmid expressing LAMP1-RFP and MEF cells were electroporated in the presence of a plasmid expressing GFP. LC3 distribution (gray) was analyzed in cells expressing the reporter proteins 7 h after electroporation. (D). MEFs were transfected with a plasmid expressing human GABARAPL2 tagged with GFP (green).14 Cells were incubated in nutrient media (i), starved in HBSS for 4 h (ii) or incubated with lipoplex (iii) and immunostained for endogenous LC3 (red) after 4 h. Insets show region of interest at higher magnification.
Tubulovesicular autophagosomes form following fusion of GFP-LC3 puncta and are maintained by microtubules
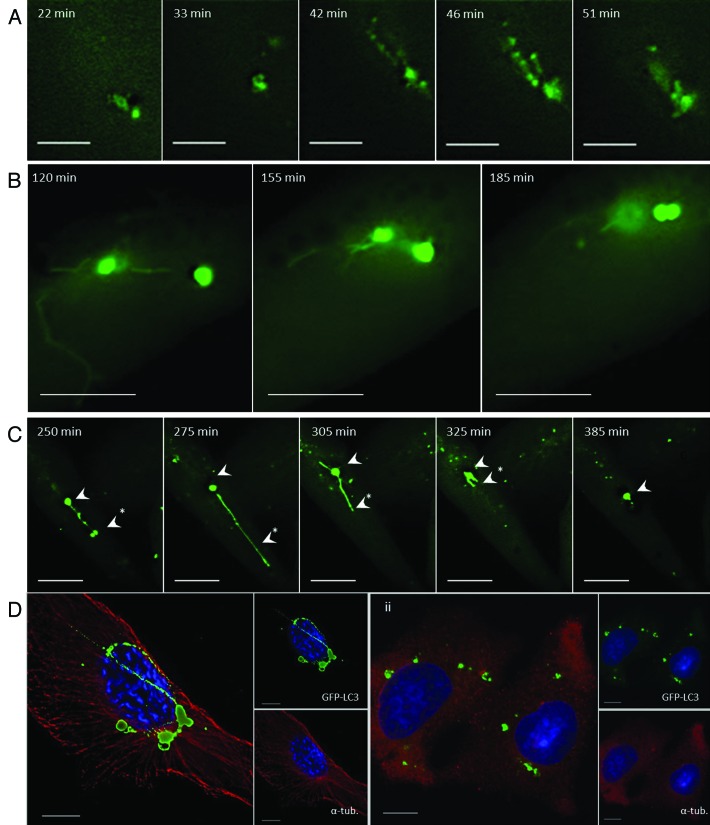
The formation of TVAs in response to lipoplex was analyzed by live-cell imaging (Fig. 2A; Vid. S1). Small GFP-LC3 puncta, similar to the autophagosomes generated by starvation, were seen between 20 and 30 min following addition of lipoplex. These puncta were then incorporated into a network of vesicles and tubules that accumulated close to the nucleus between 40 and 60 min. At later times (120 to 185 min) GFP-positive vesicles became connected by tubules, which contracted before vesicle fusion (Fig. 2B; Vid. S2). The dynamics of preformed GFP-LC3 positive vesicles was analyzed using cycloheximide to inhibit protein synthesis and delivery of newly synthesized LC3 to vesicles. In Figure 2C two vesicles are connected by a tubule (250 min), the tubule extends for 20 μm and the lower vesicle is lost (275 min) suggesting that vesicles might be converted into tubules. The tubule then retracts toward the remaining vesicle, which increases in diameter and then generates a second tubule extending in the opposite direction (305 min), the vesicle then ceased to change shape. Cycles of tubule formation did not therefore required delivery of newly synthesized LC3 to TVAs, suggesting they result from modification of preformed structures. Tubules observed in fixed cells varied greatly in length and in some cases extended 50 μm. The formation of tubules from vesicles suggested a role for microtubules in TVA formation and this was tested by depolymerizing microtubules with nocodazole (Fig. 2D). In control cells, microtubules extended to the edge of the cell (Fig. 2D, i) and GFP-positive tubules connecting to vesicles were clearly visible. In the presence of nocodazole intact microtubules were lost (Fig. 2D, ii) and the GFP-LC3 signal was located to smaller vesicular structures within the cytoplasm that were no longer connected by tubular extensions. While our experiments suggest that the tubular extensions appear to be generated along microtubules, we cannot exclude the possibility that they require other factors that can be inhibited by nocodazole.
Figure 2. Tubulovesicular autophagosomes generate tubular extensions and require microtubules (see Vids. S1–S3). (A and B) CHO cells expressing GFP-LC3 were incubated in nutrient media containing cationic lipoplex for the duration of the experiment. Images were captured from live cells at the indicated times. (C) The cells were imaged in the presence of 20 μg/ml cycloheximide. (D) CHO cells expressing GFP-LC3 were incubated in nutrient media containing cationic lipoplex (i) or cationic lipoplex and 5 mM nocodazole (ii) for 4 h, fixed and immunostained for tubulin (red).
Tubulovesicular autophagosomes contain ubiquitin and SQSTM1
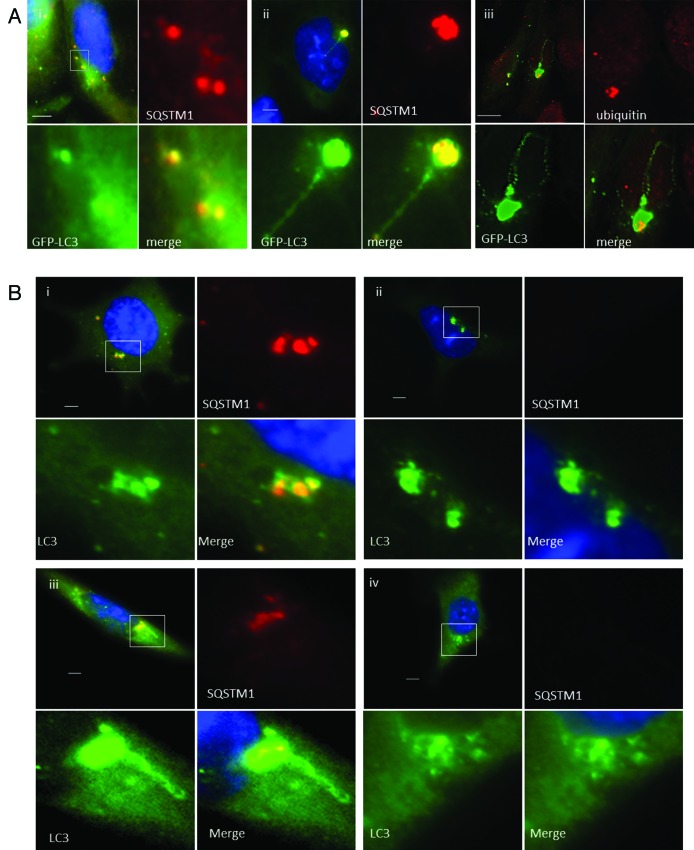
The live cell imaging experiments showed that TVAs were generated by fusion of small GFP puncta suggesting fusion of autophagosomes. This raised the possibility that they may contain cellular cargoes captured during the formation of autophagosomes. SQSTM1 is an ‘autophagy receptor’ protein that binds ubiquitin to facilitate delivery of damaged proteins and organelles to autophagosomes.15 The distribution of SQSTM1 in response to lipoplex was therefore analyzed. Ten minutes after addition of lipoplex (Fig. 3A, i) the cells contained small GFP-LC3 puncta that colocalized with endogenous SQSTM1. Cells observed at 4 h contained TVAs that immunostained for both SQSTM1 (Fig. 3A, ii) and ubiquitin (Fig. 3A, iii). These results are consistent with TVAs being formed from autophagosomes but interestingly, SQSTM1 and ubiquitin were restricted to the vesicular component of the TVA, suggesting that ubiquitinated proteins are excluded from the tubular connections. The role played by SQSTM1 in the generation of TVAs was tested by incubating MEFs from sqstm1−/− knockout mice with cationic lipoplex (Fig. 3B). Control experiments showed that 1 h after addition of lipoplex the wild-type MEFs generated small GFP-LC3 puncta that contained SQSTM1 (Fig. 3B, i), and that TVAs containing SQSTM1were present after 4 h (Fig. 3B, iii). Cells lacking SQSTM1 also generated small GFP-LC3 puncta at 1 h (Fig. 3B, ii), large numbers of vesicles accumulated close to the nucleus at 4 h (Fig. 3B, iv), but formation of long interconnecting tubules was rare.
Figure 3. Role of SQSTM1 and ubiquitin in formation of tubulovesicular autophagosomes. (A) CHO cells expressing GFP-LC3 were incubated in nutrient media containing cationic lipoplex for 10 min (i) or 360 min (ii and iii). Cells were fixed and immunostained for SQSTM1 (i and ii), or ubiquitin (iii). Scale bar: 10 μm. (B) Wild-type MEFs (i and iii) or MEFs from sqstm1−/− knockout mice (ii and iv) were incubated with cationic lipoplex. Cells were either fixed at 1 h (i and ii), or 6 h (iii and iv) and immunostained for endogenous LC3 (green) or SQSTM1 (red).
Tubulovesicular autophagosomes recruit LC3-II and require ATG5
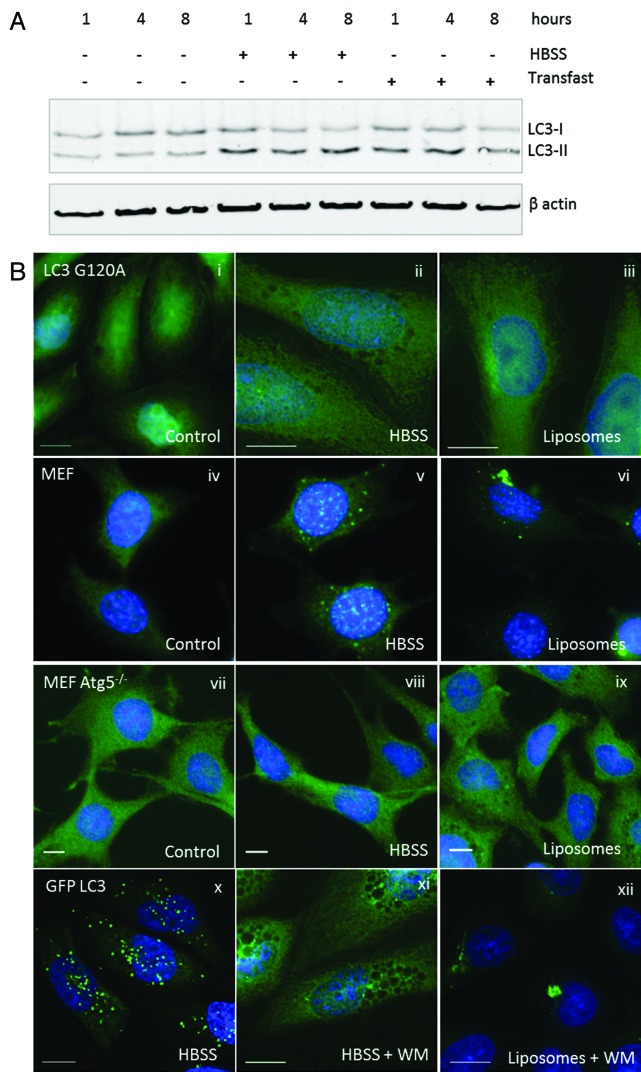
Autophagosome formation requires addition of phosphatidylethanolamine (PE) to the C terminus of LC3 generating LC3-II. Figure 4A shows that levels of LC3-II increased in starved cells (HBSS), and in cells incubated with cationic lipoplex. The possibility that TVAs incorporate LC3-II was tested using CHO cells expressing a mutant form of GFP-LC3 (GFP-LC3G120A) that cannot be lipidated by PE. GFP-LC3G120A locates to the cytoplasm (Fig. 4B, i) and the mutation prevents incorporation into autophagosomes following starvation (Fig. 4B, ii), or incorporation into TVAs following incubation with lipoplex (Fig. 4B, iii). The requirement for ATG5 in formation of TVAs was tested by incubating MEFs from atg5−/− knockout mice with cationic lipoplex. Control experiments showed that wild-type MEFs generated autophagosomes in response to starvation (Fig. 4B, v), and TVAs when incubated with lipoplex (Fig. 4B, vi). Staining atg5−/− cells for endogenous LC3 showed that LC3 was in the cytoplasm in nutrient media (Fig. 4B, vii) and atg5−/− MEFs were unable to generate LC3 puncta in response to starvation (Fig. 4B, viii). The atg5−/− cells also failed to generate autophagosomes or TVAs when incubated with lipoplex (Fig. 4B, ix). Autophagosome formation is initiated by activation of PIK3C3. The role played by lipid phosphorylation during TVA formation was tested using wortmannin to inhibit PtdIns3-kinase activity. Wortmannin prevented formation of GFP-LC3 puncta when cells were starved for up to 8 h (Fig. 4B, xi) but the drug was unable to prevent formation TVAs by cationic lipoplex (Fig. 4B, xii).
Figure 4. Requirements for tubulovesicular autophagosome formation by cationic lipoplex. (A) MEF cells were incubated for the indicated times in nutrient media (control), HBSS or nutrient media containing cationic lipoplex. Cells lysates were analyzed by SDS-PAGE followed by western blot using antibodies specific for LC3 or ACTB/β-actin. The bands representing LC3-I and LC3-II are indicated. (B) CHO cells expressing GFP-LC3G120A were incubated in nutrient media (i), starved in HBSS (ii), or nutrient media containing lipoplex (iii). Cells were fixed after 4 h. Wild-type MEF cells were incubated in nutrient media (iv), starved in HBSS (v), or nutrient medium containing lipoplex (vi). MEF atg5−/− cells were incubated in nutrient media (vii), starved in HBSS (viii), or nutrient media containing lipoplex (ix). Cells were fixed after 4 h and endogenous LC3 was visualized by immunostaining with antibody specific for LC3. CHO cells expressing GFP-LC3 were incubated in HBSS alone (x) with 100 nM wortmannin in HBSS (xi), or 100 nM wortmannin in nutrient media containing lipoplex (xii). Cells were fixed at the indicated times. Nuclei were stained with DAPI. Scale bar: 10 μm.
Lack of ATG5 increases gene expression following lipoplex and polyplex transfection
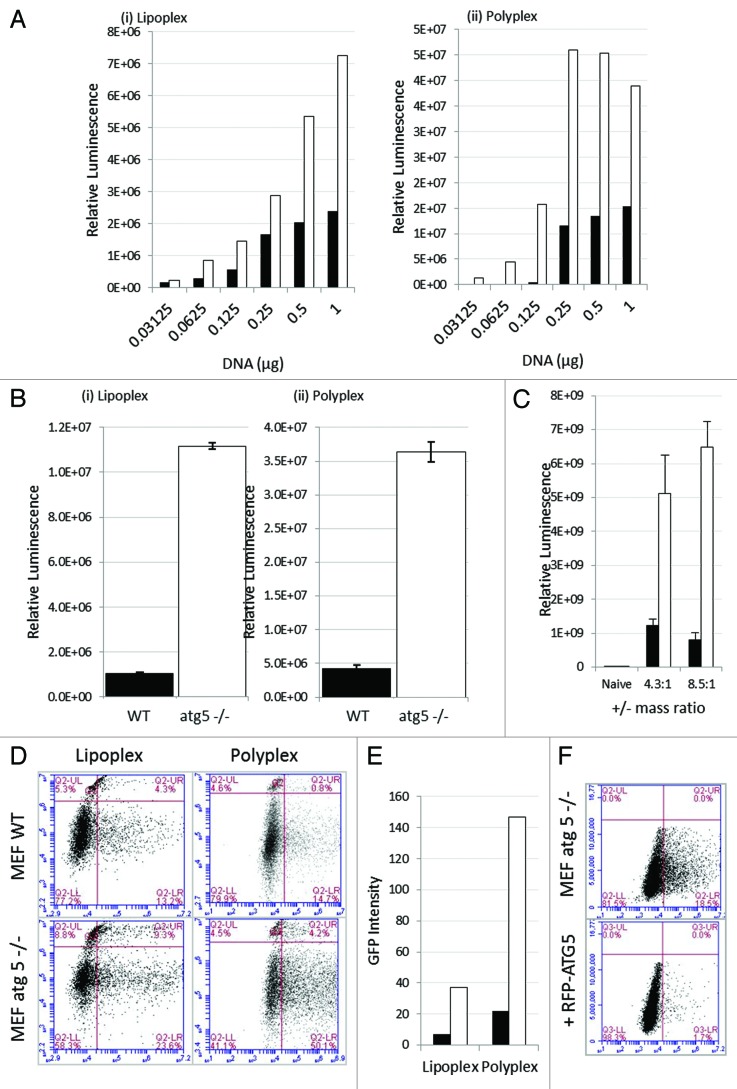
The MEF atg5−/− cells allowed us to test whether ATG5 expression and activation of autophagy affected the efficiency of gene transfer and expression. Cationic liposomes or polymers were complexed with increasing quantities of reporter plasmid and incubated with wild-type MEFs or the atg5−/− MEFs (Fig. 5). The reporter plasmid encoded GFP and luciferase separated by a 2A cleavage site allowing us to determine total luciferase activity in cell lysates, and analyze GFP expression in individual cells by FACS analysis of samples taken in parallel. Figure 5A shows that luciferase expression increased with the quantity of DNA incorporated into lipoplex (Fig. 5A, i) or polyplex polymer (Fig. 5A, ii) and in each case luciferase gene expression was between 4- and 8-fold greater in the absence of ATG5. Luciferase gene expression was first detected at 8 h, levels were too low to be plotted on the exponential graph but in both cases gene expression increased greatly at 16 h (Fig. 5B, i and ii). Gene expression at 16 h was measured in three independent experiments and error bars are indicated. As seen in the dose response experiment (Fig. 5A), luciferase expression was again greater in the absence of ATG5 (white bars) when compared with wild-type MEFs (black bars). The experiment was repeated using cationic lipoplex with defined ratios of DOTAP and cholesterol (Fig. 5C). Luciferase gene expression was again greater in the absence of ATG5.
Figure 5. Loss of ATG5 results in increases gene delivery from cationic liposomes and polyplex polymers. (A) Control MEFs (black column) or atg5−/− MEFs (white column) were incubated with lipoplex (left) or polyplex (right) complexed with increasing quantities of reporter plasmid expressing luciferase and GFP. The panels show luciferase activity in cell lysates prepared 16 h after transfection. (B) Control MEFs (black column) or atg5−/− MEFs (white column) were incubated with lipoplex or polyplex complexed with 0.5 μg of reporter plasmid as indicated. Luciferase activity was assessed in cell lysates prepared 16 and 24 h after transfection. Expression at 16 h was estimated from three independent experiments and error bars (SE) are shown. (C) Control MEFs (black column) or atg5−/− MEFs (white column) were incubated for 1 h with DOTAP:Chol cationic lipoplex complexed at different charge ratios complexed with 0.25 μg of a reporter plasmid expressing luciferase. Luciferase activity was assessed at 24 h from three independent experiments and error bars (SE) are shown. (D) Control MEFs (top) or atg5−/− MEFs (bottom) were incubated with lipoplex or polyplex vectors complexed with reporter plasmid expressing luciferase and GFP. Sixteen h after transfection cells were sorted for GFP expression and permeability to propidium iodide and gated into four quadrants. UL: dead cells negative for GFP. LL: live cells negative for GFP. UR: dead cell expressing GFP. LR: live cells expressing GFP. (E) Numbers of cells expressing GFP were taken by summing UR and LR quadrants in (G) and multiplied by mean fluorescence intensity. Control MEFs (black column) atg5−/− MEFs (white column). (F) atg5-/- MEFs were transfected with control plasmid (top), or plasmid expressing RFP-ATG5 (bottom). After 24 h the cells were incubated with cationic lipoplex complexed with 0.5 μg of luciferase-GFP reporter plasmid. Cells were sorted at 16 h for GFP expression.
Expression of GFP in individual cells was analyzed by flow cytometry (Fig. 5D) and the cells counterstained with propidium iodide to estimate cell death. The quadrants in the flow plots indicate four populations. Bottom right: live cells expressing GFP, top right: dead cells expressing GFP, bottom left: live cells negative for GFP, and top left: dead cells negative for GFP. The two flow cytometry plots show transfection using lipoplex or polyplex vectors. In both cases the percentage of cells expressing GFP was greater when cells lacked ATG5. For lipoplex, the percentage of cells (live and dead) in the right quadrants rose from 17.5% to 36.8% and for polyplex polymer transfection this rose from 15.5% to 54.3% in the absence of ATG5. Importantly, GFP expression in individual cells lacking ATG5 was on average shifted to the right of the plots suggesting brighter mean fluorescence. The net effect of loss of ATG5 expression was calculated by multiplying the percentage of GFP-positive cells by mean fluorescence intensity and expressed as arbitrary units (Fig. 5E). The figure shows representative FACs analysis for one concentration, but the experiment involved analysis of 24 separate FACs plots corresponding to the six concentrations of DNA shown in Figure 5A and B. In each case the FACs plots support the findings from luciferase assays, but added further detail by showing that the 8-fold increased expression following loss of ATG5 results from increased numbers of cells transfected and increased average reporter protein expression per cell. The experiment was repeated for atg5−/− cells transfected with a plasmid expressing ATG5 fused to red fluorescent protein (RFP). Panel F shows that gene delivery decreased to levels see in wild- type MEFs when ATG5 expression was reconstituted by expression of ATG5-RFP.
Formation of tubulovesicular autophagosomes requires endocytosis
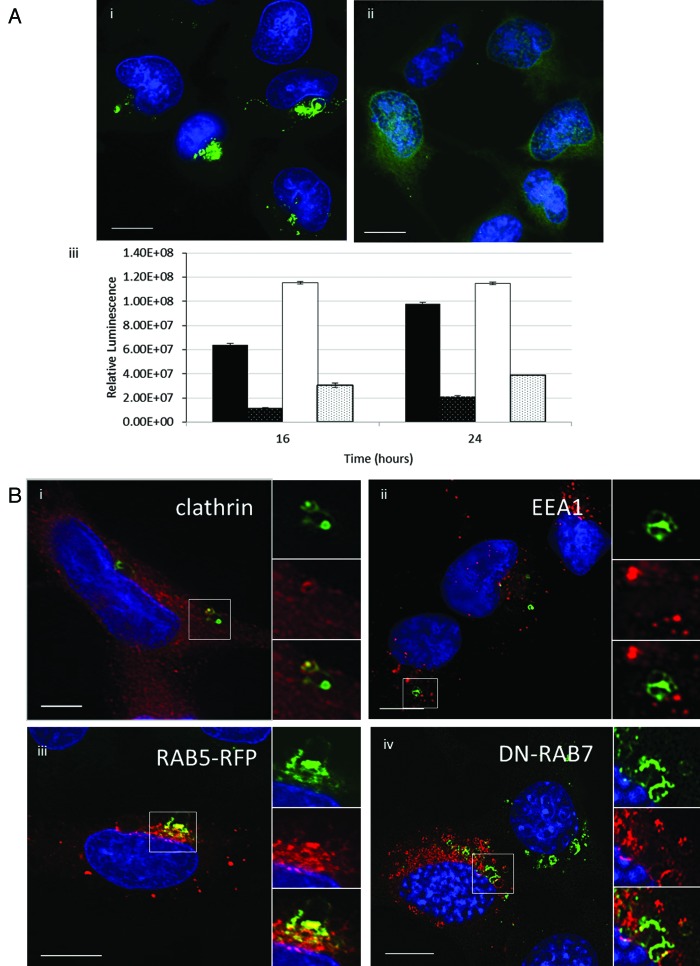
The role played by clathrin-mediated endocytosis in the formation of TVAs was tested by incubating cells with dynasore to inhibit the dynamin GTPase that releases endosomes from the plasma membrane.16 TVAs were clearly visible in control cells 4 h after addition of liposomes (Fig. 6A, i) but were absent from cells incubated dynasore (Fig. 6A, ii) and the GFP-LC3 signal remained distributed through the cytoplasm. Dynasore caused a three- to 4-fold fall in luciferase expression from cationic lipoplex and polyplex polymers analyzed 16 and 24 h after transfection (Fig. 6B). Given the possible link between endocytosis and formation of TVAs the location of endocytic marker proteins was analyzed by fluorescence microscopy following incubation with lipoplex. Clathrin colocalized with GFP-LC3 in vesicular elements of TVAs (Fig. 6C, i). Two early endocytic markers, early endosome antigen 1 (EEA1) and RAB5-RFP, labeled small vesicular structures throughout the cytoplasm indicative of endosomes. RAB5-RFP colocalized with vesicular elements of TVAs but staining of tubules was weak (Fig. 6B, iii). EEA1 did not colocalize with TVAs (Fig. 6C, ii).
Figure 6. Gene delivery and formation of tubulovesicular autophagosomes require endocytosis. (A) MEF cells were incubated with cationic lipoplex for 1 h in nutrient media (i), or media with 80 μM dynasore (ii). Cells were immunostained for endogenous LC3. Scale bar: 10 μm. (iii) MEF cells were incubated with lipoplex vector (black) or polyplex (white) complexed to a luciferase reporter plasmid in nutrient media (filled columns) or nutrient media containing 80 μM dynasore (hatched columns). Luciferase activity was assayed at 16 h and 24 h from three independent experiments, error bars (SE) are shown. (B) HEK 293 cells stably expressing GFP-LC3 (green) were incubated with lipoplex vector for 4 h. Cells were fixed and immunostained for clathrin (i, red) or early endosome antigen 1(ii, red). (iii) MEF cells expressing RAB5-RFP (red) were incubated with lipoplex vector for 4 h. Cells were fixed and immunostained for endogenous LC3 (green). MEF cells expressing dominant-negative RAB7T22N (iv) were incubated with lipoplex vector for 4 h. Cells were fixed and immunostained for endogenous LC3 (pseudo-colored green). Regions of interest are indicated by the white square and high magnification images of green, red and merged channels are presented to the right of each figure.
Autophagosomes formed in response to starvation mature by fusing with late endosomes and lysosomes. RAB7 (isoform A) associates with late autophagosomes and is required for their fusion with lysosomes.17 The role played by RAB7 in formation of TVAs was tested by expressing dominant negative RAB7T22N-GFP in MEFs. Cells were immunostained for endogenous LC3 after addition of cationic liposomes. The RAB7 and LC3 signals were pseudo-colored red and green respectively so that the images would be consistent with the other panels of Figure 6, where TVAs are green. TVAs were formed in cells expressing dominant negative RAB7T22N (Fig. 6B, iv) suggesting that formation of TVAs does not require RAB7 and may be independent of autophagosome-lysosome fusion.
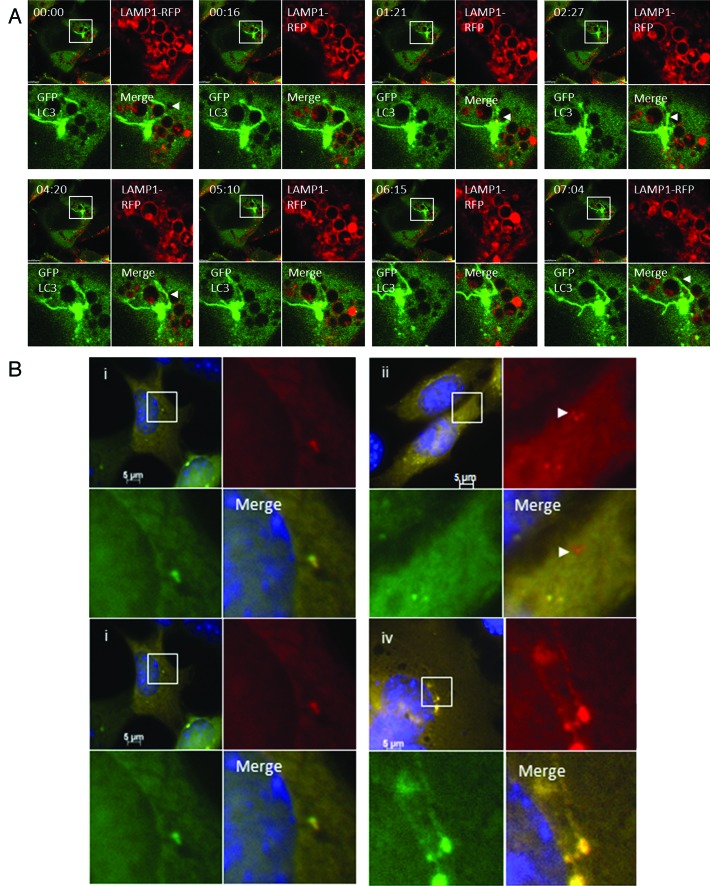
The fusion of TVAs with lysosomes was analyzed by live-cell imaging of CHO cells expressing LC3-GFP and LAMP1-RFP following incubation with cationic liposomes (Fig. 7A; Vid. S4). The top left quadrant of each panel shows the cell containing a TVA imaged at low magnification. The top right and bottom left quadrants show the individual green and red signals at higher magnification, and the merge is presented in the bottom right. At the start of the time lapse the TVA is surrounded by lysosomes indicated by circles of LAMP1-RFP. Tubular structures containing LC3 (arrow head) extend and loop around lysosomes and come into close contact. The tubular extensions then retract back toward the TVA. New tubules form and make close contact with lysosomes but throughout the time-lapse series the limiting membrane of the lysosomes failed to take up GFP-LC3, suggesting that tubules and the vesicular components of the TVA do not fuse with lysosomes. Fusion of autophagosomes with lysosomes can be followed using a tandem RFP-GFP-LC3 probe.18 Autophagosomes are positive for both GFP and RFP while lysosomes only emit an RFP signal because GFP is quenched rapidly following transfer of RFP-GFP-LC3 to lysosomes. Cells expressing RFP-GFP-LC3 were imaged following starvation in HBSS. Autophagosomes imaged at 1 h were green and red (Fig. 7B, i) but red puncta imaged at 4 h had lost green fluorescence (Fig. 7B, ii) indicating transfer of RFP-GFP-LC3 to lysosomes. When the experiment was repeated for TVAs the clusters of green LC3 puncta that accumulated next to the nucleus 1 h following addition of cationic liposomes were red and green (Fig. 7B, iii), however, unlike autophagosomes induced by starvation, the TVAs (Fig. 7B, iv) retained both red and green fluorescence at 4 h. The results again suggest that fusion between TVAs and lysosomes is absent or very slow.
Figure 7. Interaction of tubulovesicular autophagosomes with lysosomes. (A) LAMP1-RFP was expressed transiently in CHO-cells expressing GFP-LC3. Cells were incubated with lipoplex and images captured from live cells at the indicated times. The top left quadrant of each panel shows the cell containing a TVA imaged at low magnification with a region of interest indicated by the white square. The top right and bottom left quadrants show the individual green and red signals at higher magnification, and the merge is presented in the bottom right. Arrowheads indicate tubular structures extending from autophagosomes toward neighboring lysosomes. (B) Cells expressing RFP-GFP-LC3 were imaged one (i) and 4 h (ii) after starvation in HBSS. The region of interest is indicated by the white square and high magnification images of green, red and merged channels are presented in the remaining panels of each figure. The arrowhead in (ii) indicates an RFP-LC3 punctate that has lost GFP signal at 4 h. (iii and iv) Cells expressing RFP-GFP-LC3 were imaged 1 (iii) and 4 h (iv) after incubation with cationic lipoplex. The region of interest is indicated by the white square and high magnification images of green, red and merged channels are presented in the remaining panels of each figure. The regions of interest indicate TVAs that retain signals for RFP and GFP.
Cationic liposomes are retained in TVAs
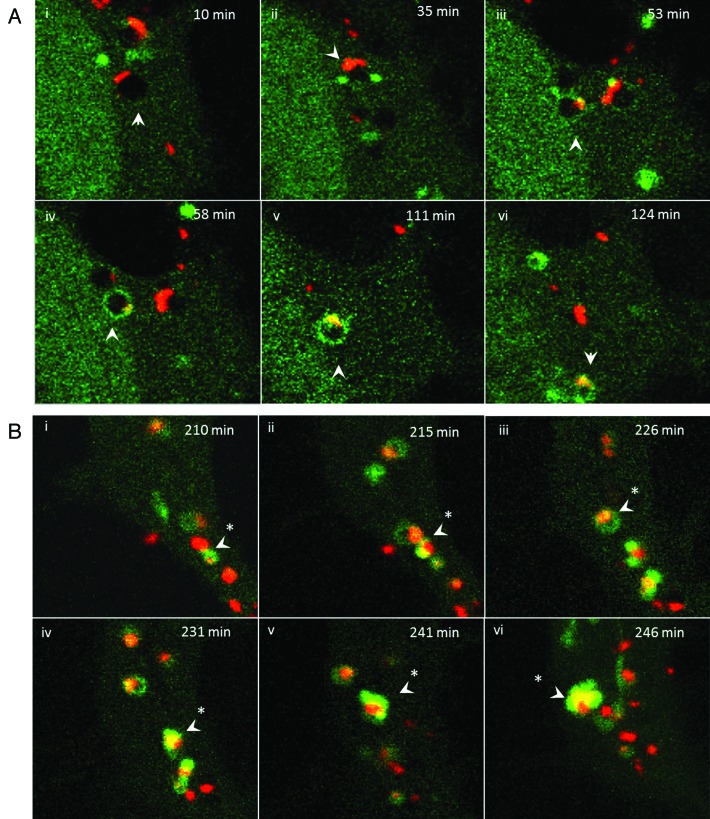
The endocytosis experiments showed that endocytosis was required for both gene delivery and formation of TVAs. The relationship between endocytosis of cationic lipoplex and formation of TVAs was further analyzed by live-cell imaging (Fig. 8). Cationic DiI-labeled liposomes (Fig. 8A) entered cells in small vesicles with dark interiors that we assume to be early endosomes. The endosomes were negative for GFP-LC3 and the red liposomes were associated with the endosome membrane (10 min). Small GFP-LC3 puncta were observed in the cytoplasm close to, but separate from the endosomes at early time points (10 to 35 min; Fig. 8A, iii). Between 35 and 50 min, endosomes containing liposomes fused with GFP-LC3 puncta as indicated by bright yellow signals generated by colocalized red lipids and GFP-LC3 (Fig. 8A, iii and iv). GFP-LC3 then distributed into the limiting membrane of the endosome (Fig. 8A, iv and v) generating a characteristic ring of green fluorescence. The bright yellow signals remained localized to one site within the endosome membrane suggesting that the liposomes remain intact. The GFP-LC3-tagged vesicles containing the liposomes then moved toward the center of the cell (Fig. 8A, v and vi, 111 to 124 min). Figure 8B shows time-lapse images of GFP-LC3 positive vesicles at 200 min. The GFP-LC3 positive vesicle indicated by the arrow contains a liposome and is followed for 36 min. The vesicle fuses with neighboring GFP-LC3 positive vesicles (215 min) and at 246 min generates the tubule extensions characteristic of TVAs. The red signal remains within the vesicle and does not enter the tubule suggesting again that liposomes remain intact while in TVAs.
Figure 8. Trafficking of cationic lipoplex in endosomes and autophagosomes. CHO cells expressing GFP-LC3 were incubated with Dil-labeled cationic liposomes (red). Images were captured from live cells at the indicated times. (A) Early time points taken at the indicated times after cell entry of liposomes into endosomes at cell periphery (see Vid. S3). (B) Later time points imaged at 200 min as liposomes associate with tubulovesicular autophagosomes.
Discussion
This study has shown that cationic liposome and polyplex carriers used for nonviral gene delivery activate autophagy. Autophagy was activated in nutrient media and therefore activated independently of starvation. This is consistent with previous work showing that cationic polyplex vectors colocalize with autophagosome markers and that autophagosomes are induced by cationic liposomes.10,11 While these results show that cationic lipoplex and polyplex carriers induce autophagy, the side-by-side comparison in Figure 1 shows that the autophagosomes were much larger than autophagosomes generated during starvation, and closely resembled the TVAs induced by CPP described by Gao et al.12 All three gene delivery vectors therefore induce TVAs rather than the small autophagosomes generated following starvation. The TVAs were formed from small autophagosomes that became incorporated into networks of GFP-LC3 puncta linked by tubular connections. This process was inhibited by nocodazole indicating a requirement for intact microtubules. The TVAs were highly dynamic structures. Tubules extended from vesicles over long distances (20 to 50 μm) and connected with neighboring vesicles and retraction of tubules appeared to result in vesicle fusion. TVAs formed by CPP(12) are reported to show similar dynamics, again suggesting that TVAs induced by polyplex and lipoplex are the same as those generated by CPP. While TVAs differ morphologically from autophagosomes, they required ATG5 and lipidation of LC3-II and were therefore dependent on the ATG12–ATG5-ATG16L1 complex that facilitates translocation of LC3-II to autophagosomes during membrane expansion. TVAs also accumulated SQSTM1and ubiquitinated proteins indicating uptake of cellular cargoes for autophagy. SQSTM1was located to the small GFP-puncta formed within 10 min of adding lipoplex indicating early incorporation of autophagy cargoes. At later times SQSTM1and ubiquitin signals were restricted to the vesicular component of the TVA suggesting exclusion from tubular elements. Studies using MEFs from sqstm1−/− mice showed that SQSTM1 may be required for formation of tubular elements, but was not required for formation of large perinuclear autophagosomes. TVA formation was not inhibited by wortmannin, suggesting formation is independent of the PtdIns3-kinase activity of PIK3C3. Noncanonical autophagy pathways where autophagosomes form independently of BECN1 and PIK3C3 have been described (reviewed in ref. 19), however further experiments will be needed to determine whether these are activated by cationic carriers used for gene delivery.
The requirement for ATG5 for TVA formation allowed us to test whether autophagy and formation of TVAs provided a barrier against gene delivery. When titrated against a range of DNA concentrations, ATG5 reduced average gene expression up to 8-fold from both lipoplex and polyplex. FACs plots showed that ATG5 reduced both the overall percentage of cells positive for GFP and the intensity of the GFP signal. Taken together the results suggest strongly that formation of TVAs provides a barrier to gene delivery. TVA formation and gene delivery were both dependent on endocytosis suggesting endocytosis occurs before formation of TVAs. Cationic liposomes entered cells in small vesicles negative for LC3, which we assume to be early endosomes, at the same time GFP-puncta indicative of autophagosomes were formed in the cytosol. Within 30 min of cell entry endosomes containing cationic lipoplex were associated with small GFP-LC3 puncta and the GFP-LC3 signal moved into the limiting membrane of the vesicles suggests that GFP-LC3 puncta fuse with early endosomes containing cationic lipoplex. This may involve direct fusion between autophagosomes and the endosome, or capture of endosomes by autophagosomes. Alternatively, the images may indicate the use of endosomes and plasma membrane as sites for autophagosome formation.20 This process involves an interaction between ATG16L1 and clathrin21 which recruits the ATG12–ATG5-ATG16L1 complex, but not early endosome marker EEA1, to generate autophagosome precursors. It is possible that cationic lipoplex trapped in endosomes enhances recruitment of the autophagy machinery to the endosome membrane. This would be consistent with our observation that GFP-LC3 puncta induced by lipoplex colocalize with clathrin and RAB5 (isoform A) but, as seen for endosome-derived autophagosomes, are negative for EEA1. Throughout TVA formation and maturation, the red signal for the cationic lipids remained discrete and localized to one point in the vesicle suggesting that the liposomes remain intact. The ‘endosome/autophagosome’ hybrids moved toward the nucleus where they become linked by tubular extensions, and fused with one another. Formation of TVAs was not inhibited by dominant negative RAB7T22N suggesting they do not require RAB7, and the lack of colocalization of GFP-LC3 with LAMP1 suggested that TVAs fuse with lysosomes slowly, if at all. This was confirmed by live-cell imaging where GFP-LC3 signals from TVAs came into close contact with lysosomes but the GFP signal remained constant, and the limiting membrane of the lysosome failed to take up GFP-LC3. Parallel experiments using a tandem RFP-GFP-LC3 reporter showed that TVAs maintain both red and green fluorescence suggesting slow (or lack of) fusion with lysosomes. A similar delay in fusion between autophagosomes and lysosomes has been reported following incubation of cells with CPP,15 and may explain the perinuclear accumulation of autophagosomes after incubation of cells with cationic carriers.
Live-cell imaging of red fluorescent liposomes throughout this time course showed that the limiting membrane of the TVA and the tubular connections attached to TVAs remained green, and the red signal for the cationic lipids remained discrete, suggesting that the liposomes remain intact. Some liposomes were associated with vesicles that lacked GFP-LC3 signal. These may be derived from endosomes that do not fuse with GFP-LC3 puncta, or have fused with autophagosomes containing low levels of the GFP-tagged probe. Kobayashi et al.,22 showed previously that polystyrene beads coated in cationic liposomes colocalize with GFP-LC3. They suggested that autophagy was activated by beads entering the cytoplasm where they were subsequently engulfed by autophagosomes. We cannot exclude escape of cationic lipoplex into the cytoplasm following endosome rupture, but our live-cell imaging experiments suggested that the liposomes remain within endosomes that then fuse with vesicles carrying GFP-LC3. Furthermore, the liposomes observed in the cytosol were not associated with GFP-LC3 and were apparently resistant to further capture by autophagosomes, and perhaps responsible for successful gene transfer.
Luciferase gene expression was first detected 8 h following transfection. This makes it likely that the TVAs, rather than the LC3-positive early endosomes, which survive for about 1 h before being incorporated into TVAs, delay transfer of nucleic acid to the cytosol. TVAs therefore differ from the accepted view of the endosome and lysosome as the end point of trafficking for cationic vectors. Zabner et al.14 described the formation of large perinuclear complexes with ordered tubular extensions in cells incubated with cationic liposomes. The complexes were formed following endosome fusion, were separate from lysosomes and retained DNA. It is highly likely that Zabner et al. identified TVAs before probes to study autophagy were generally available. TVAs, consisting of heterogeneous GFP-LC3 puncta connected by long tubules, form in cells after starvation,12 suggesting formation through autophagy. Their numbers increase after transfection with calcium phosphate precipitates,15 and common with our study, the TVAs induced by CPP are dependent on ATG5, and are insensitive to wortmannin, and when immunopurified, the TVAs contain autophagy proteins lipidated LC3-II, ATG9, ATG16L1 and ATG5. These observations, coupled with electron micrographs showing that TVAs incorporate double-membrane vesicles surrounding cellular material,12,14 suggest that TVAs are closely related to classical autophagosomes. Overall TVAs are therefore emerging as a specialized form of autophagosome, possibly formed during endocytosis by a noncanonical autophagy pathway independent of PIK3C3. Our study shows that cationic nonviral gene delivery vectors are transferred to TVAs soon after entering cells by endocytosis. Incorporation into TVAs greatly reduces gene expression and TVAs should therefore be considered as a new barrier to gene delivery.
Materials and Methods
Cell culture
Chinese Hamster Ovary cells (CHO, ECACC 85051005), were obtained from European Collection of Cell Cultures (ECACC). CHO cells expressing eGFP-LC3 and GFP-LC3G120A were a kind gift from Dr Zvulun Elazar and cultured in MEM containing 10% FCS. MEF wild-type (WT) and MEF atg5−/− cell lines were a kind gift from Noboru Mizushima of Tokyo Medical and Dental University, and cultured in DMEM (Invitrogen, 21885025) with 10% FCS. Opti-MEM reduced serum with GlutaMAX (Invitrogen, 11058021) was used for transfections. Cells were starved in HBSS (Hank’s Balanced Salt Solution) (Invitrogen, 14025050).
Materials
Rabbit anti-LC3B (L7543) and monoclonal antibodies to α-tubulin (clone B512, T1568) were from Sigma. Monoclonal antibodies to EEA1 (610457) and clathrin (610499) were from BD Biosciences. Guinea Pig anti SQSTM1 (GP62-N) was from Progen Biotechnik. AlexaFluors and transferrin AlexaFluor 594 conjugate (Molecular Probes-Invitrogen T13343) were from Invitrogen, and cells were preincubated in 5 µg/ml in Opti-MEM for 30 min prior to experimentation. Plasmids RAB5-RFP, DN-RAB7 and LAMP1-RFP were purchased from Addgene (Plasmid 14437, Plasmid 14436 and Plasmid 1817). The plasmid expressing GFP GABARAP was a kind gift from Dr. Zvulun Elazar.
Lipoplex and polyplex preparation
Unless otherwise stated ‘Transfast’ (E2431) from Promega was used as a cationic liposome lipoplex carrier and ‘JetPRIME’ (VWR-PPLU114-15) from Autogen Bioclear was used as a polyplex carrier. Both were used according to manufacturer’s instructions. Defined liposomes were prepared as follows. 1,2-dioleoyloxypropyl)-N,N,N-trimethylammonium chloride (DOTAP, Avanti Lipids, 790310) and cholesterol (Chol) were dissolved in chloroform: methanol (4:1 v/v). DOTAP: Chol (2:1 molar ratio) multilamellar vesicles were prepared by rotary evaporation under vacuum at 40°C for 30 min. The dried lipid film was hydrated with 5% dextrose to a final lipid concentration of 2 mM. Small unilamellar vesicles were prepared by further bath sonication using an ultrasonic cleaner from VWR, at room temperature for 15 min. Fluorescently labeled DiI-liposomes were prepared by incorporating 0.5 mol% of 1'-dioctadecyl-3,3,3′,3′-tetramethylindocarbocyanine perchlorate (DiI) (Molecular Probes-Invitrogen, D-282) to the lipid organic solvents prior to lipid film formation. For complexation studies, the dried lipid film was hydrated with 1ml of 5% dextrose, sonicated and extruded twice through a 0.1 µm filter under sterile conditions. DOTAP: Chol liposomes were complexed with pCMV-GFP-Luc in 5% dextrose at 4.3:1, 8.5:1 N/P mass ratio (equivalent to 2:1,4:1 N/P charge ratio) for 30 min at room temperature.
Western blot
Cell lysates denatured in SDS were separated on 12% polyacrylamide gels. Proteins were transferred on to PVDF membranes and probed using rabbit anti-LC3B (Sigma, L7543) or anti-ACTB/β-actin antibody (Abcam, ab49900) and second antibodies conjugated to HRP (Jackson Laboratories-Stratatec, 111-035-003) and visualized by enhanced chemiluminescence.
Electroporation
Trypsinized cells were suspended in Opti-MEM (107/ml) and 100 µl electroporated in cuvettes using Nucleofector II (Amaxa Biosystems) under recommended conditions. MEF cells were electroporated in the presence of a plasmid expressing GFP using program A-023, while CHO cells expressing GFP-LC3 were electroporated in the presence of a plasmid expressing LAMP1-RFP (Addgene, Plasmid 1817) using program H-014.
Gene expression
pGreenfire1 CMV (positive Control) (Stratech Scientific Ltd., TR000pa-1-SBI) and pCMV-luc (Promega) were used as reporter plasmids. Washed cells were maintained in 1ml Opti-MEM containing 25 μl complexed plasmid, cultured for 1 h at 37°C, washed and allowed to recover in complete media. Luciferase expression was assayed using Promega Luciferase Assay kit (Promega, E4030) and a Lumat LB 9507 tube luminometer (Berthold Technologies). Results were expressed as relative light unit/mg protein ± standard deviation (SD, n = 3).
Fluorescence imaging
Cells were fixed with 4% paraformaldehyde at room temperature for 30 min, stained with 1% PBS containing 0.5 µg/ml 4′, 6 diamidino-2-phenylindole (DAPI, Thermo Scientific 62248) and then mounted on slides with Fluoromount (Southern Biotech-Cambridge Bioscience, 0100-01). The fixed cells were imaged on a Zeiss Axioplan microscope (Carl Zeiss Ltd.) with a 63×, 1.4 NA oil-immersion objective using 350 ± 40 nm excitation and 445 ± 25 nm emission for DAPI, 470 ± 20 nm excitation and 525 ± 25 nm emission for GFP, and 560 ± 20 nm excitation and 630 ± 37.5 nm emission for AlexaFluor 594. For live-cell imaging, cells on 45 mm dia. coverslips were placed in a POC chamber (PeCon GmbH) before mounting on the microscope in a heated stage at 37°C. Widefield-fluorescence experiments were performed on a Zeiss Axiovert 200M (Carl Zeiss Ltd.) using a 63×, 1.4 NA oil-immersion objective with GFP excited at 472 ± 15 nm and emission collected at 520 ± 17.5 nm. Confocal-fluorescence imaging was performed on a Leica TCS SP2 laser-scanning microscope [Leica Microsystems (UK) Ltd.] using a 63×, 1.4 NA oil-immersion objective with GFP excited at 488 nm and emission collected between 495 and 535 nm, and Cy3 excited at 543 nm and emission collected between 555 and 650 nm.
Supplementary Material
Acknowledgments
This work was supported in part by BBSRC grants BB/F012861/1 to T.W. and BBS/B/00689 to P.P.P. We would like to thank the following: Dr. Zvulun Elazar of the Weizmann Institute of Science for the CHO GFP-LC3 cells and plasmid expressing GFP-GABARAPL2;23 Noboru Mizushima of Tokyo Medical and Dental University for the MEF wild-type (WT) and MEF atg5−/− cell lines; Masaaki Komatsu of Tokyo Metropolitan Institute of Medical Science; and Terje Johansen for providing MEF wild-type (WT) and MEF sqstm1−/− cell lines.
Glossary
Abbreviations:
- ATG
autophagy-related
- CPP
calcium phosphate precipitates
- EEA1
early endosome antigen 1
- GABARAP
GABA(A) receptor-associated protein
- HBSS
Hank’s balanced salt solution
- LAMP
lysosomal-associated membrane protein
- LC3
microtubule-associated protein 1 light chain 3
- MEF
mouse embryonic fibroblast
- MTOR
mechanistic target of rapamycin
- PE
phosphatidylethanolamin
- PIK3C3
phosphatidylinositol 3-kinase, catalytic subunit type 3
- SQSTM1
sequestosome 1
- TVAs
tubulovesicular autophagosomes
- WM
wortmannin
Disclosure of Potential Conflicts of Interest
No potential conflicts of interest were disclosed.
Supplemental Materials
Supplemental materials may be found here: www.landesbioscience.com/journals/autophagy/article/23877
Footnotes
Previously published online: www.landesbioscience.com/journals/autophagy/article/23877
References
- 1.Pichon C, Billiet L, Midoux P. Chemical vectors for gene delivery: uptake and intracellular trafficking. Curr Opin Biotechnol. 2010;21:640–5. doi: 10.1016/j.copbio.2010.07.003. [DOI] [PubMed] [Google Scholar]
- 2.Zuhorn IS, Kalicharan R, Hoekstra D. Lipoplex-mediated transfection of mammalian cells occurs through the cholesterol-dependent clathrin-mediated pathway of endocytosis. J Biol Chem. 2002;277:18021–8. doi: 10.1074/jbc.M111257200. [DOI] [PubMed] [Google Scholar]
- 3.Barua S, Rege K. The influence of mediators of intracellular trafficking on transgene expression efficacy of polymer-plasmid DNA complexes. Biomaterials. 2010;31:5894–902. doi: 10.1016/j.biomaterials.2010.04.007. [DOI] [PubMed] [Google Scholar]
- 4.Elouahabi A, Ruysschaert JM. Formation and intracellular trafficking of lipoplexes and polyplexes. Mol Ther. 2005;11:336–47. doi: 10.1016/j.ymthe.2004.12.006. [DOI] [PubMed] [Google Scholar]
- 5.Midoux P, Breuzard G, Gomez JP, Pichon C. Polymer-based gene delivery: a current review on the uptake and intracellular trafficking of polyplexes. Curr Gene Ther. 2008;8:335–52. doi: 10.2174/156652308786071014. [DOI] [PubMed] [Google Scholar]
- 6.Tooze SA, Yoshimori T. The origin of the autophagosomal membrane. Nat Cell Biol. 2010;12:831–5. doi: 10.1038/ncb0910-831. [DOI] [PubMed] [Google Scholar]
- 7.Mizushima N, Komatsu M. Autophagy: renovation of cells and tissues. Cell. 2011;147:728–41. doi: 10.1016/j.cell.2011.10.026. [DOI] [PubMed] [Google Scholar]
- 8.Xie Z, Klionsky DJ. Autophagosome formation: core machinery and adaptations. Nat Cell Biol. 2007;9:1102–9. doi: 10.1038/ncb1007-1102. [DOI] [PubMed] [Google Scholar]
- 9.Levine B. Eating oneself and uninvited guests: autophagy-related pathways in cellular defense. Cell. 2005;120:159–62. doi: 10.1016/j.cell.2005.01.005. [DOI] [PubMed] [Google Scholar]
- 10.Vercauteren D, Deschout H, Remaut K, Engbersen JF, Jones AT, Demeester J, et al. Dynamic colocalization microscopy to characterize intracellular trafficking of nanomedicines. ACS Nano. 2011;5:7874–84. doi: 10.1021/nn2020858. [DOI] [PubMed] [Google Scholar]
- 11.Man N, Chen Y, Zheng F, Zhou W, Wen LP. Induction of genuine autophagy by cationic lipids in mammalian cells. Autophagy. 2010;6:449–54. doi: 10.4161/auto.6.4.11612. [DOI] [PubMed] [Google Scholar]
- 12.Gao W, Kang JH, Liao Y, Ding WX, Gambotto AA, Watkins SC, et al. Biochemical isolation and characterization of the tubulovesicular LC3-positive autophagosomal compartment. J Biol Chem. 2010;285:1371–83. doi: 10.1074/jbc.M109.054197. [DOI] [PMC free article] [PubMed] [Google Scholar]
- 13.Sarkar S, Korolchuk V, Renna M, Winslow A, Rubinsztein DC. Methodological considerations for assessing autophagy modulators: a study with calcium phosphate precipitates. Autophagy. 2009;5:307–13. doi: 10.4161/auto.5.3.7664. [DOI] [PubMed] [Google Scholar]
- 14.Zabner J, Fasbender AJ, Moninger T, Poellinger KA, Welsh MJ. Cellular and molecular barriers to gene transfer by a cationic lipid. J Biol Chem. 1995;270:18997–9007. doi: 10.1074/jbc.270.32.18997. [DOI] [PubMed] [Google Scholar]
- 15.Pankiv S, Clausen TH, Lamark T, Brech A, Bruun J-A, Outzen H, et al. p62/SQSTM1 binds directly to Atg8/LC3 to facilitate degradation of ubiquitinated protein aggregates by autophagy. J Biol Chem. 2007;282:24131–45. doi: 10.1074/jbc.M702824200. [DOI] [PubMed] [Google Scholar]
- 16.Macia E, Ehrlich M, Massol R, Boucrot E, Brunner C, Kirchhausen T. Dynasore, a cell-permeable inhibitor of dynamin. Dev Cell. 2006;10:839–50. doi: 10.1016/j.devcel.2006.04.002. [DOI] [PubMed] [Google Scholar]
- 17.Jäger S, Bucci C, Tanida I, Ueno T, Kominami E, Saftig P, et al. Role for Rab7 in maturation of late autophagic vacuoles. J Cell Sci. 2004;117:4837–48. doi: 10.1242/jcs.01370. [DOI] [PubMed] [Google Scholar]
- 18.Kimura S, Noda T, Yoshimori T. Dissection of the autophagosome maturation process by a novel reporter protein, tandem fluorescent-tagged LC3. Autophagy. 2007;3:452–60. doi: 10.4161/auto.4451. [DOI] [PubMed] [Google Scholar]
- 19.Codogno P, Mehrpour M, Proikas-Cezanne T. Canonical and non-canonical autophagy: variations on a common theme of self-eating? Nat Rev Mol Cell Biol. 2012;13:7–12. doi: 10.1038/nrm3249. [DOI] [PubMed] [Google Scholar]
- 20.Moreau K, Ravikumar B, Puri C, Rubinsztein DC. Arf6 promotes autophagosome formation via effects on phosphatidylinositol 4,5-bisphosphate and phospholipase D. J Cell Biol. 2012;196:483–96. doi: 10.1083/jcb.201110114. [DOI] [PMC free article] [PubMed] [Google Scholar]
- 21.Ravikumar B, Moreau K, Jahreiss L, Puri C, Rubinsztein DC. Plasma membrane contributes to the formation of pre-autophagosomal structures. Nat Cell Biol. 2010;12:747–57. doi: 10.1038/ncb2078. [DOI] [PMC free article] [PubMed] [Google Scholar]
- 22.Kobayashi S, Kojidani T, Osakada H, Yamamoto A, Yoshimori T, Hiraoka Y, et al. Artificial induction of autophagy around polystyrene beads in nonphagocytic cells. Autophagy. 2010;6:36–45. doi: 10.4161/auto.6.1.10324. [DOI] [PubMed] [Google Scholar]
- 23.Weidberg H, Shvets E, Shpilka T, Shimron F, Shinder V, Elazar Z. LC3 and GATE-16/GABARAP subfamilies are both essential yet act differently in autophagosome biogenesis. EMBO J. 2010;29:1792–802. doi: 10.1038/emboj.2010.74. [DOI] [PMC free article] [PubMed] [Google Scholar]
Associated Data
This section collects any data citations, data availability statements, or supplementary materials included in this article.


