

Abstract
Children with chronic otitis media (OM) often have conductive hearing loss which results in communication difficulties and requires surgical treatment. Recent studies have provided clinical evidence that there is a one-to-one correspondence between chronic OM and the presence of a bacterial biofilm behind the tympanic membrane (TM). Here we investigate the acoustic effects of bacterial biofilms, confirmed using optical coherence tomography (OCT), in adult ears. Non-invasive OCT images are collected to visualize the cross-sectional structure of the middle ear, verifying the presence of a biofilm behind the TM. Wideband measurements of acoustic reflectance and impedance (0.2 to 6 [kHz]) are used to study the acoustic properties of ears with confirmed bacterial biofilms. Compared to known acoustic properties of normal middle ears, each of the ears with a bacterial biofilm has an elevated power reflectance in the 1 to 3 [kHz] range, corresponding to an abnormally small resistance (real part of the impedance). These results provide assistance for the clinical diagnosis of a bacterial biofilm, which could lead to improved treatment of chronic middle ear infection and further understanding of the impact of chronic OM on conductive hearing loss.
Keywords: bacterial biofilm, optical coherence tomography, reflectance, impedance, middle ear, otitis media, tympanic membrane
1. Introduction
Bacterial biofilms have been considered to be the cause of many chronic infectious diseases (Dohar et al., 2009; Parsek and Singh, 2003; Macassey and Dawes, 2008; Costerton et al., 1999). Biofilms have been linked to chronic otitis media (OM) and OM with effusion in the middle ear. Scanning electron microscopy and fluorescence confocal microscopy have provided images of middle ear mucosa specimens from chinchillas (Ehrlich et al., 2002) and humans (Hall-Stoodley et al., 2006) with chronic OM that verify the presence of bacterial biofilms. Biofilms are complex, organized structures formed by bacteria. This biopolymer structure often has the consistency of glue, and the protected bacteria within a biofilm become inherently resistant to most conventional antibiotics, due to the mechanical protection of the film, resulting in reinfection and treatment complications for chronic OM cases (Aparna and Yadav, 2008).
Currently, optical coherence tomography (OCT) is the only imaging technique which can acquire in vivo, non-invasive images of the middle ear structure (Nguyen et al., 2010, 2012). The human tympanic membrane (TM) is approximately 100 [μm] thick, while the thickness of a biofilm varies in the range of tens to hundreds of micrometers (Lim, 1995; Xi et al., 2006). These micro-features of the middle ear are not resolvable by more traditional medical imaging techniques such as CT, MRI, and ultrasound, even with state-of-the-art high-resolution methods. With a high imaging resolution of several micrometers and a penetration depth of 2 to 3 [mm], OCT is appropriate for imaging middle ear structures (Zysk et al., 2007; Pitris et al., 2001). This imaging technique is analogous to ultrasound imaging, but uses a near-infrared light source. The interference of scattered light from the tissues and reflected light from a mirror provides structural, depth-resolved information about the tissues, in the form of two-dimensional cross-sectional images or three-dimensional volumes. OCT has successfully imaged the TM, malleus, and tensor tympani muscle (Pitris et al., 2001; Djalilian et al., 2008). Previous studies have demonstrated the efficacy of using OCT for in vivo middle ear imaging, and for detecting the presence of bacterial biofilms in the middle ear (Nguyen et al., 2010, 2012). Using a portable system to collect OCT images of middle ears with chronic OM, bacterial biofilms with different thicknesses and scattering levels were visualized and detected behind the TMs. This previous work demonstrated the potential of OCT for clinical applications regarding the diagnosis and treatment of middle ear diseases (Nguyen et al., 2012).
Chronic OM causes conductive hearing loss and may result in speech perception difficulty. Patients with chronic OM may have 27 [dB] on average and up to 60 [dB] loss in hearing, depending on the effusion fluid level (Bluestone and Klein, 2007). However, the impact of a bacterial biofilm on the acoustic characteristics of the middle ear has not been specifically studied. Intuitively, the presence of a bacterial biofilm on the surface of the TM affects the motion of the TM, where planar acoustic pressure waves in the ear canal are transduced to mechanical waves of the ossicular chain. Further, bacterial biofilms may have different thicknesses and cover different areas of the TM, which may cause the acoustic effects to vary greatly across different biofilm cases. It is therefore necessary to further investigate and understand the acoustic impact of bacterial biofilms.
Acoustic reflectance has become a powerful measurement for quantifying the acoustic characteristics of the middle ear. Various methods for measuring the acoustic impedance and reflectance of the middle ear have been developed (Allen, 1986; Keefe et al., 1992; Voss and Allen, 1994) and the clinical utility of these measurements for differential diagnosis of middle ear pathologies has been studied by many researchers (Feeney et al., 2003; Hunter et al., 2010; Shahnaz et al., 2009; Nakajima et al., 2012; Rosowski et al., 2012). Reflectance systems measure the complex acoustic pressure (magnitude and phase) in the ear canal, as a function of frequency, in response to a wideband stimulus. The complex acoustic reflectance is the ratio of the backward propagating pressure wave, P−(f), to the forward propagating pressure wave, P+(f), at the measurement location in the ear canal; the total pressure at the probe location is the sum of these components, P(f) = P−(f) + P+(f). The reflectance, Γ(f), is related to the acoustic impedance, Z(f), via
| (1) |
where r0 = pc/A is the estimated surge resistance (further described in Robinson et al. (2013), this issue), p is the density of air, c is the speed of sound, A is the area of the ear canal and f is the frequency in Hertz.
The squared magnitude of the acoustic reflectance, |Γ(f)|2, represents the relative amount of acoustic power reflected back to the ear canal from the middle ear, and the phase of the acoustic reflectance characterizes the latency of this reflected power. The absorbance, 1 − |Γ(f)|2, represents the power absorbed by the middle ear. Assuming no significant leaks in the middle ear system (e.g. TM perforation), the absorbance is related to the middle ear transfer function and thus to hearing sensitivity (Allen et al., 2005; Rosowski et al., 2012). Unlike impedance, the magnitude of the acoustic reflectance (and by association, the absorbance) is not significantly affected by the residual ear canal between the probe and the TM (Voss and Allen, 1994; Voss et al., 2008). This property provides a major advantage of reflectance quantities over impedance quantities, because it allows for more rigorous comparison across measurements.
Here we investigate bacterial biofilms in the middle ear using a combination of OCT and acoustic reflectance measurements. Non-invasive OCT images are collected to visualize the cross-sectional structure of the middle ear and confirm the presence of a biofilm behind the TM. Using this optical ‘gold standard’ diagnosis, we then analyze the acoustic properties of the middle ear with the biofilm using wideband acoustic reflectance measurements. The goal of this study is to identify the acoustic effects of a bacterial biofilm on the middle ear, in order to lay a foundation for biofilm detection using clinical acoustic reflectance systems, which are lower cost and require less training to operate than currently available OCT systems (Nakajima et al., 2012). As previously mentioned, such systems may also be incorporated in the identification of a broad spectrum of pathologies. In this preliminary feasibility study, we have collected data from only five ears with OCT-proven biofilms. However, the acoustic effects of biofilms appear to be consistent across these five cases.
2. Materials and methods
2.1. Human subjects
This research was conducted under a protocol approved by the Institutional Review Boards of the University of Illinois at Urbana-Champaign and Carle Foundation Hospital (Urbana, IL). All subjects were adults (¿25 years old), and biofilm candidates had a history of chronic OM or were diagnosed with fluid via otoscopy. Normal ears (volunteers) and pathological ears (clinical patients) were assessed according to the OCT result and otoscopic examination. Reflectance measurements were also made for all ears. Two of the five OCT-confirmed biofilm ears (B2 and B3) appeared to have fluid present during the otoscopic examination, which was performed during the same visit as the reflectance and OCT measurements. A number of ears were rejected from this study because the presence of biofilm could not be confirmed. In such cases, a biofilm may have existed elsewhere on the TM, outside of the cross-sectional region that was imaged using OCT.
2.2. Optical coherence tomography
OCT is an optical biomedical imaging technique that is capable of measuring cross-sectional microstructure with a typical resolution of several microns (Zysk et al., 2007). The OCT system used in this study is described in Fig. 1. Figures 1a and 1b show a functional diagram of the system. To perform OCT, low-coherence light is generated from a broadband optical source and split by a beam splitter or fiber-optic coupler into two beams that are sent to sample and reference arms of the interferometer. The reference arm contains a stationary mirror, while the sample arm contains beam-delivery optics directed toward the sample. The interference of the two back-reflected or scattered beams is captured by a linear photodetector array and processed by a computer to describe the depth-resolved optical scattering properties of the tissue. The broadband, near-infrared light allows axial resolutions of up to 2 to 3 [μm] and penetration depths of up to 2 to 3 [mm] in highly-scattering tissues. The spatial variations in the optical backscattered signal are used to describe the microstructures of the tissues. Scanning mechanisms at the sample arm perform the imaging in two or three dimensions.
Figure 1.
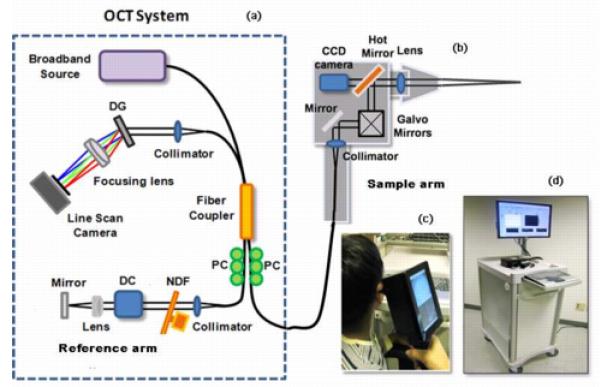
OCT instrumentation for biofilm detection. (a) Schematic of the OCT system (diff.raction grating (DG); polarization controller (PC); dispersion compensation (DC) materials; neutral density filter (NDF)), (b) schematic of the hand-held OCT probe, (c) photograph of the hand-held OCT probe, (d) portable OCT system.
Detection and imaging of middle ear biofilms was performed using a custom-built OCT-otoscopy system with a hand-held probe (Figs. 1c and 1d) designed for clinical use (Jung et al., 2011; Nguyen et al., 2012). The superluminescent diode light source in this system operates at a center wave-length of 830 [nm], a bandwidth of 70 [nm], and provides an axial resolution of 3.1 [μm] in tissue with an average index of refraction of 1.4. A high speed line scan camera (Sprint, Basler) and frame grabber (National Instruments) allow a data acquisition rate of 70 frames per second. Sixteen OCT images of size 1 [mm] × 1.5 [mm] can be displayed each second, after processing. The hand-held OCT scanner utilizes galvanometer-mounted mirrors for fast two- and three-dimensional image acquisition. A miniature charge-coupled device based color video camera having a diameter of 1.6 [cm], a length of 2.1 [cm] and 0.27 mega pixels was also integrated, in order to simultaneously capture real-time video images of the TM surface during acquisition of cross-sectional OCT images. All of the optics in the handheld scanner were packaged inside a light and robust plastic box (11.5 [cm] × 11.5 [cm] × 6.3 [cm]). The lens mount was constructed by modifying the same metal ear tip and plastic ear speculum used in existing commercial otoscopes. This allowed for the use of disposable ear speculum for each patient.
2.3. Acoustic measurements
The acoustic reflectance data collected in this study consisted of complex broadband measurements, taken over the frequency range of 0.2 to 6 [kHz] using the HearID system made by Mimosa Acoustics (Champaign, IL). The system was calibrated using a four cavity method (e.g. Allen, 1986) according to the specifications provided by Mimosa Acoustics, and the probe was sealed in the ear canal at ambient pressure via an expanding foam plug. Reflectance measurements were collected in a busy clinical environment (working in a sound booth was not practical), resulting in low-frequency measurement noise. Data is presented for one OCT-confirmed normal and five OCT-confirmed biofilm ears. Normative reflectance data is drawn from Rosowski et al. (2012), which included only ‘strictly normal’ ears, according to a battery of audiometric tests. These data were also collected using HearID. Using this large pool of normative data for comparison, systematic changes of the acoustic impedance and reflectance in ears with bacterial biofilms were evaluated.
3. Results
3.1. Normal ear
Figure 2 shows a summary of the OCT and acoustic results for a normal ear (N1). The TM of a normal human ear appears translucent to opaque under video otoscopy. Figure 2a shows an image of the healthy TM captured via video otoscopy. Considering the OCT scan (Fig. 2b), the normal TM is readily identified by two sharp edges, about 90 [μm] apart, which is consistent with the average thickness of the human eardrum (about 100 [μm]). As expected from this image, the TM is classified as normal via the algorithm described in Nguyen et al. (2010) and Nguyen et al. (2012). Note that the thickness of the TM varies with spatial location. TM regions near the periphery are significantly thicker than regions closer to the umbo.
Figure 2.
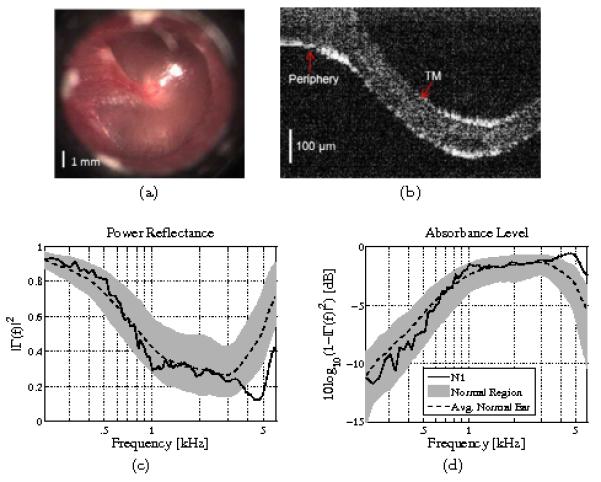
A normal ear (N1). (a) Otoscope picture, (b) OCT image (perpendicular to the plane of the TM, shown in panel a), (c) power reflectance, (d) absorbance level [dB]. The dotted black lines show the average normal ear from Rosowski et al. (2012), and the light gray regions show ±1 standard deviation about the mean. This ear falls within the normal region below 4 [kHz]. Above 4 [kHz], assuming the absorbance approximates the middle ear transfer function, this ear performs better than normal.
Figures 2c and 2d show the acoustic assessment of the OCT-confirmed normal ear. For these plots, the light gray regions show ±1 standard deviation about the mean for 112 measurements of 56 normal ears from Rosowski et al. (2012). Black dotted lines show the normative means based on that study. For normal ears, the power reflectance (Fig. 2c) approaches 1 at low frequencies, has a broad minimum in the mid-frequency region from about 1 to 4 [kHz], and increases again at high frequencies, likely due to a high-frequency mass loading effect. The mid-frequency region corresponds to the most sensitive hearing range for humans (Voss and Allen, 1994; Feeney et al., 2003; Allen et al., 2005), and is the region of most significant variation for normal ears (Rosowski et al., 2012). Considering the absorbance level (Fig. 2d), most of the individual variation of normal ears from 1 to 4 [kHz] corresponds to a small 2 to 3 [dB] range. Ear N1 falls well within the normal region up to about 4 [kHz]. Assuming the absorbance is an approximation to the middle ear transfer function, this ear actually performs better than normal above 4 [kHz].
3.2. Biofilm ear
Figure 3 shows a summary of the OCT and acoustic results for an ear with an OCT-confirmed bacterial biofilm (B1). In the case of chronic OM, the appearance of the TM under video otoscopy may differ between patients (e.g. red, cloudy, or retracted). The ear with a biofilm, which has a cloudy TM, is shown in Fig. 3a. Using OCT, various biofilm structures have been observed in patient ears (Nguyen et al., 2012). These biofilms can appear with different thicknesses, scattering levels, and have either partial or complete presence within the cross-sectional scans. In the OCT image (Fig. 3b), the bacterial biofilm and TM structures are indicated. This biofilm is about 130 [μm] thick at the scan location, and is attached to the inner surface of the TM. Thus the thickness of this biofilm at the imaging location was slightly greater than that of the normal TM.
Figure 3.

Ear with an OCT-confirmed biofilm (ear B1). (a) Otoscope picture, (b) OCT image (perpendicular to the plane of the TM, shown in panel a), (c) power reflectance, (d) absorbance level [dB]. The dotted black lines show the average normal ear from Rosowski et al. (2012), and the light gray regions show ±1 standard deviation about the mean. This ear has an abnormally high power reflectance between 1 and 2 [kHz], corresponding to an abnormally low absorbance level in that frequency region.
The power reflectance (Fig. 3c), and absorbance level (Fig. 3d), of this ear fall well outside of the normal range. Most notably, the power reflectance has an abnormal maximum with a peak of 0.8 (80% reflected power) at 1.7 [kHz], causing the power reflectance to be much higher than normal between 1 and 2 [kHz]. The unusual maximum at 1.7 [kHz] causes a ‘reverse slope’ appearance, as the power reflectance curve between 0.4 and 1 [kHz] is approximately perpendicular to the normal mean curve. Considering the absorbance level, the abnormal maximum in the power reflectance corresponds to a minimum of the absorbance level at 1.7 [kHz], about 6 [dB] below the mean normal absorbance level. Considering that the ±1 standard deviation region is about 2 [dB] wide at this frequency, this seems to be a severe effect.
In order to further analyze the acoustic effects of this bacterial biofilm, the acoustic impedance (related to the reflectance via Eq. 1) of the biofilm ear (B1) is compared to that of the normal ear (N1) in Fig. 4. The complex acoustic impedance is represented in two ways: the magnitude and phase (Figs. 4a and 4b), and the resistance and reactance (Figs. 4c and 4d), which are the real and imaginary parts of the impedance, respectively. The impedance has been normalized by the surge resistance r0, to remove the effect of the ear canal area across subjects (Allen et al., 2005). As in Figs. 2 and 3, the dotted black lines show the average normal ear from Rosowski et al. (2012), and the light gray regions show ±1 standard deviation about the mean for these normalized impedance quantities. The residual ear canal causes a distinct standing wave notch in the normalized impedance magnitude (Fig. 4a), due to reflections between the probe and TM. This notch is related to the mass-stiffness transition of the impedance across frequency for a given residual canal volume, corresponding to the transition from negative to positive impedance phase (Fig. 4b). A phase of −π/2 is a pure compliance (ZC = 1/jωC = e−jπ/2/ωC), while a phase of π/2 is related to a pure mass (ZM = jωM = ejπ/2ωM). Due to the relative magnitudes of the normalized resistance (Fig. 4c) and the normalized reactance (Fig. 4d), the normalized impedance magnitude is dominated by the reactance below 1 [kHz].
Figure 4.
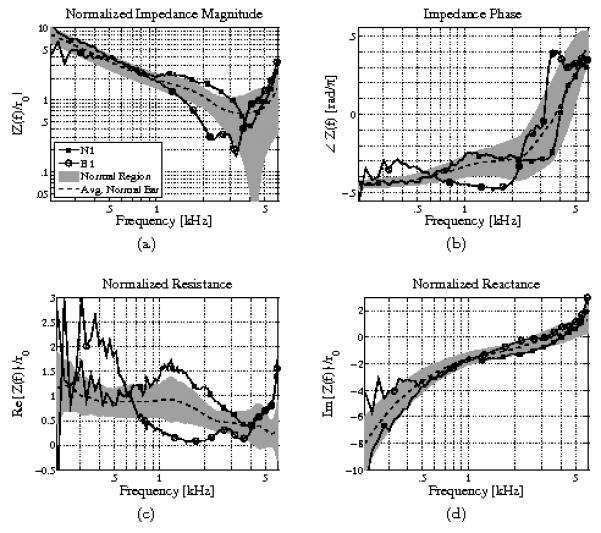
Impedance analysis comparison of normal ear N1 and ear B1 with an OCT-confirmed biofilm. (a) Normalized impedance magnitude, (b) impedance phase, (c) normalized resistance, (d) normalized reactance. Note that the impedance is normalized by the estimated surge resistance, r0, to remove the effect of ear canal area across subjects (Allen et al., 2005). The dotted black lines show the average normal ear from Rosowski et al. (2012). The light gray regions show ±1 standard deviation about the mean. The resistance of the biofilm ear is close to zero between 1 and 2 [kHz], corresponding to an impedance phase close to −π/2 in that frequency region (which is consistent with a purely imaginary impedance). This causes the power reflectance to tend toward 1 in that frequency region.
Consider the acoustic impedance measurements of normal ear N1 and biofilm ear B1 near 1.7 [kHz], where the power reflectance shows the greatest abnormalities for the biofilm ear. In Fig. 4c, normal ear N1 has a normalized resistance that is slightly higher than normal near 1.7 [kHz], while the biofilm ear B1 has a normalized resistance that is much lower than normal, approaching zero. Because the middle ear is an approximately passive system, the resistance must be greater than zero. Thus, the resistance of the biofilm ear approaches this fundamental limit, making its deviation from normal more noteworthy than that of the normal ear N1. Thus, at 1.7 [kHz], the impedance of the biofilm ear becomes almost purely reactive. This is apparent in the impedance phase of ear B1 as well, which approaches −π/2 at this frequency (a pure compliance). As the impedance becomes purely reactive, the reflectance magnitude must approach 1, thus the minimum of the resistance corresponds to a maximum of the power reflectance at 1.7 [kHz]. One possible physical interpretation of this data is that at 1.7 [kHz] the bacterial biofilm causes the TM to behave as a rigid surface, thus the middle ear is effectively blocked and the impedance becomes that of an approximately lossless (purely reactive) cavity. Without further experimental evidence or modeling attempts, this is only conjecture.
3.3. All biofilm cases
OCT images are not shown for the remaining four ears with biofilms, B2, B3, B4 and B5. The OCT measurements suffice only to confirm the presence or absence of a biofilm. Since the OCT images captured only a small region of the TM, they do not provide specific information about the extent of the pathology, and therefore are of limited use for interpreting the acoustic results further.
Figure 5 shows an acoustic summary of all five ears with confirmed biofilms. Ignoring low-frequency abberations, which in part are due to noise, the power reflectance (Fig. 5a) is higher than normal, and the absorbance level (Fig. 5b) is lower than normal, for all ears within the 1 to 3 [kHz] range. Abnormal maxima in this range result in the ‘reverse slope’ behavior of the power reflectance in the 0.5 to 2 [kHz] range. While the power reflectance and absorbance levels for ears B1, B4 and B5 return approximately to normal at higher frequencies, the two ears that were diagnosed with fluid as well, B2 and B3, also show an elevated power reflectance (a depressed absorbance level) above 3 [kHz]. This is consistent with previous studies of reflectance for middle ears with effusion (Feeney et al., 2003; Allen et al., 2005; Ellison et al., 2012).
Figure 5.

Five ears with OCT-confirmed biofilms. (a) Power reflectance, (b) absorbance level [dB], (c) normalized resistance, (d) normalized reactance. The dotted black lines show the average normal ear from Rosowski et al. (2012), and the light gray regions show ±1 standard deviation about the mean. Note that ears B2 and B3 were also diagnosed with OM during the otoscopic examination. All five biofilm ears show a depressed resistance between 1 and 3 [kHz], even though ear B5 appears close to normal when considering the power reflectance, and ears B2 and B3 have different high-frequency properties (presumably related to OM).
Figures 5c and 5d show the normalized acoustic resistance and reactance; unlike Figs. 4c and 4d, these figures show magnitude quantities plotted on a log-log scale. Note that normalized reactance magnitude is similar to the normalized impedance magnitude (Fig. 4a), because the normalized resistance magnitude is comparatively small for most frequencies. Considering Fig. 5d, like ear B1, the other biofilm ears have reactance measurements that lie approximately within the normal region, with slight deviations at low frequencies, which are most likely related to measurement noise (Fig. 5d). Considering Fig. 5c, the effect of a biofilm on the normalized acoustic resistance appears to be consistent. All five biofilm ears have an abnormally low normalized resistance in the 1 to 3 [kHz] range, corresponding to the abnormally high power reflectance.
Figure 6 shows the distributions of the normalized resistance for normal ears and for ears with OCT-confirmed bacterial biofilms. The light gray region shows ±1 standard deviation for the Rosowski et al. (2012) normal ears, the dark gray region shows ±1 standard deviation for the biofilm ears from this study, and the dotted lines show the means of both distributions. The normalized resistance of the biofilm ears has a large standard deviation at low frequencies due to measurement noise. However, there is a clear separation of the distributions between about 1 and 3 [kHz], particularly just below 2 [kHz]. This indicates that considering the normalized acoustic resistance in this frequency region may aid in the detection of biofilms using acoustic measurements.
Figure 6.

The dotted black lines show the average normal ear from Rosowski et al. (2012) and the average biofilm ear from this study; the light gray region shows ±1 standard deviation about the mean for normal ears, and the dark gray region shows ±1 standard deviation about the mean for biofilm ears. Just below 2 [kHz], the ±1 standard deviation regions do not overlap, indicating that a depressed resistance near 2 [kHz] may be a useful feature for detecting biofilms.
4. Discussion
Variations across measurements of the ears with biofilms presented in this study have two primary sources: some of the ears have interacting pathologies (e.g. a biofilm and fluid), and biofilms may coat different areas of the TM with differing thicknesses. This study only considered two-dimensional OCT images of the middle ear, however, ongoing technological developments will enable three-dimensional OCT imaging in the future. For each of the five abnormal ears, a biofilm was confirmed, but the three-dimensional biofilm colonization within these middle ears could not be described with the current OCT system. Variations of the power reflectance and acoustic resistance features, such as the frequencies at which abnormal elevation of the power reflectance (depression of the normalized resistance) occur, may be related to spatial and thickness variations of the biofilm colonizations. Therefore, modeling acoustic measurements of biofilm ears will likely require consideration of the two- and three-dimensional structural features of biofilms adherent the TM.
This preliminary study indicates that acoustic reflectance and impedance measurements may have utility for assessment of the presence and acoustic impact of biofilms in the middle ear. Considering previous reflectance studies of pathological ears, the power reflectance of the OCT-confirmed biofilm ears shows deviations from normal that are dissimilar to the well-studied systematic changes wrought by other middle ear conditions. The power reflectance measurements of the ears that were diagnosed with a biofilm alone, particularly ears B1 and B4, show a potentially unique profile due to the biofilms. All ears show some degree of ‘reverse slope’ behavior of the power reflectance, between 0.5 and 2 [kHz], related to the abnormal decrease in the normalized resistance.
The most likely confounding conditions in these ears are TM thickening or fluid presence. Ears with biofilms may share some acoustic properties with ears that have a thickened or inflamed TM, because a biofilm is a plaque buildup on the TM. However, the effects of these two conditions may not be exactly the same, due to differing tissue properties. Considering previous power reflectance measurements of OM ears (e.g. Piskorski et al., 1999 (N = 1, child); Feeney et al., 2003 (N = 4, adult); Allen et al., 2005 (N = 1, child); Beers et al., 2010 (N = 42, children)), OM typically causes an elevated reflectance level across most frequencies. The power reflectance measurements of biofilm ears B2 and B3, which were also diagnosed with fluid, show similar traits to existing OM with effusion data; ear B3 has an elevated reflectance across all frequencies, and ear B2 has an elevated reflectance at high frequencies.
Ears B2 and B3 also have a lower normalized resistance (Fig. 5c) at high frequencies than the biofilm-only ears. It is possible that the acoustic effects of an effusion and a bacterial biofilm may both cause a depressed normalized acoustic resistance, but for different frequency ranges. Though a power reflectance of 1 does not necessarily mean that the resistance is zero, as mentioned previously, it is provable that a resistance of 0 forces the power reflectance to be 1. Considering previous studies, the power reflectance for ears with an effusion may be close to 1 across all, or most, frequencies. Thus, while biofilm ears may have an abnormally low normalized resistance (high power reflectance) in the 1 to 3 [kHz] range, OM ears with effusion may have an abnormally low normalized resistance over a wider range of frequencies due to fluid interfering with the TM and ossicular motion.
An abnormally low normalized resistance in the 1 to 3 [kHz] range and the related ‘reverse slope’ behavior in the 0.5 to 2 [kHz] range are the most easily distinguishable trends for these five biofilm ears. Future study of a wide range of OM-related conditions, with definitive biofilm and non-biofilm classifications, is needed. Additionally, it would be useful to study the impedance effects in existing OM data to further assess the depressed resistance feature determined by this study, and its prevalence in ears with related pathologies. It is also possible that reflectance measurements of OM ears already existing in the literature may have undetected confounding biofilms. The strength of this study lies in the ‘gold-standard’ detection of biofilms using OCT. For future studies of ears with chronic OM, it may be important to assess the presence or absence of a biofilm using a technology such as OCT.
-
-
Optical coherence tomography is used to detect bacterial biofilms behind the eardrum
-
-
The wideband power reflectance is studied for ears with confirmed bacterial biofilms
-
-
Ears with biofilms have abnormal ‘reverse slopes’ of the power reflectance (0.5-2 kHz)
-
-
Ears with biofilms have abnormally low normalized resistances between 1-3 kHz
Acknowledgments
This research was supported in part by a Bioengineering Research Partnership grant from the National Institutes of Health (NIBIB R01 EB013723, S.A.B.) and research support from Welch Allyn, Inc., and Blue Highway, Inc. (S.A.B.). We thank Barbara Hall, Katie McGlasson, Pam Leon, Meghan McCoy, and Laura Browning from Carle Foundation Hospital for their assistance in collecting data in the clinic, and Darold Spillman from the Beckman Institute for Advanced Science and Technology for his help in transporting our system between imaging locations.
Footnotes
Publisher's Disclaimer: This is a PDF file of an unedited manuscript that has been accepted for publication. As a service to our customers we are providing this early version of the manuscript. The manuscript will undergo copyediting, typesetting, and review of the resulting proof before it is published in its final citable form. Please note that during the production process errors may be discovered which could affect the content, and all legal disclaimers that apply to the journal pertain.
References
- Allen JB. Measurement of eardrum acoustic impedance. Peripheral Auditory Mechanisms. 1986:44–51. [Google Scholar]
- Allen JB, Jeng PS, Levitt H. Evaluation of human middle ear function via an acoustic power assessment. Journal of Rehabilitation Research & Development. 2005;42:63–78. doi: 10.1682/jrrd.2005.04.0064. [DOI] [PubMed] [Google Scholar]
- Aparna MS, Yadav S. Biofilms: microbes and disease. Brazilian Journal of Infectious Diseases. 2008;12:526–530. doi: 10.1590/s1413-86702008000600016. [DOI] [PubMed] [Google Scholar]
- Beers AN, Shahnaz N, Westerberg BD, Kozak FK. Wideband reflectance in normal caucasian and chinese school-aged children and in children with otitis media with effusion. Ear and Hearing. 2010;31:221–233. doi: 10.1097/AUD.0b013e3181c00eae. [DOI] [PubMed] [Google Scholar]
- Bluestone CD, Klein JO. Otitis media in infants and children. PMPH-USA; 2007. [Google Scholar]
- Costerton JW, Stewart PS, Greenberg EP. Bacterial biofilms: a common cause of persistent infections. Science. 1999;284:1318–1322. doi: 10.1126/science.284.5418.1318. [DOI] [PubMed] [Google Scholar]
- Djalilian HR, Ridgway J, Tam M, Sepehr A, Chen Z, Wong BJF. Imaging the human tympanic membrane using optical coherence tomography in vivo. Otology & neurotology: official publication of the American Otological Society, American Neurotology Society [and] European Academy of Otology and Neurotology. 2008;29:1091–1094. doi: 10.1097/MAO.0b013e31818a08ce. [DOI] [PMC free article] [PubMed] [Google Scholar]
- Dohar JE, Hebda PA, Veeh R, Awad M, Costerton JW, Hayes J, Ehrlich GD. Mucosal biofilm formation on middle-ear mucosa in a nonhuman primate model of chronic suppurative otitis media. The Laryngoscope. 2009;115:1469–1472. doi: 10.1097/01.mlg.0000172036.82897.d4. [DOI] [PubMed] [Google Scholar]
- Ehrlich GD, Veeh R, Wang X, Costerton JW, Hayes JD, Hu FZ, Daigle BJ, Ehrlich MD, Post JC. Mucosal biofilm formation on middle-ear mucosa in the chinchilla model of otitis media. JAMA: the Journal of the American Medical Association. 2002;287:1710–1715. doi: 10.1001/jama.287.13.1710. [DOI] [PubMed] [Google Scholar]
- Ellison JC, Gorga M, Cohn E, Fitzpatrick D, Sanford CA, Keefe DH. Wideband acoustic transfer functions predict middle-ear effusion. The Laryngoscope. 2012;122:887–894. doi: 10.1002/lary.23182. [DOI] [PMC free article] [PubMed] [Google Scholar]
- Feeney MP, Grant IL, Marryott LP. Wideband energy reflectance measurements in adults with middle-ear disorders. Journal of Speech, Language, and Hearing Research. 2003;46:901–911. doi: 10.1044/1092-4388(2003/070). [DOI] [PubMed] [Google Scholar]
- Hall-Stoodley L, Hu FZ, Gieseke A, Nistico L, Nguyen D, Hayes J, Forbes M, Greenberg DP, Dice B, Burrows A, et al. Direct detection of bacterial biofilms on the middle-ear mucosa of children with chronic otitis media. JAMA: the Journal of the American Medical Association. 2006;296:202–211. doi: 10.1001/jama.296.2.202. [DOI] [PMC free article] [PubMed] [Google Scholar]
- Hunter LL, Feeney MP, Lapsley Miller JA, Jeng PS, Bohning S. Wideband reflectance in newborns: Normative regions and relationship to hearing-screening results. Ear and Hearing. 2010;31:599–610. doi: 10.1097/AUD.0b013e3181e40ca7. [DOI] [PMC free article] [PubMed] [Google Scholar]
- Jung W, Kim J, Jeon M, Chaney EJ, Stewart CN, Boppart SA. Handheld optical coherence tomography scanner for primary care diagnostics. IEEE Transactions on Biomedical Engineering. 2011;58:741–744. doi: 10.1109/TBME.2010.2096816. [DOI] [PMC free article] [PubMed] [Google Scholar]
- Keefe DH, Ling R, Bulen JC. Method to measure acoustic impedance and reflection coefficient. The Journal of the Acoustical Society of America. 1992;91:470–485. doi: 10.1121/1.402733. [DOI] [PubMed] [Google Scholar]
- Lim DJ. Structure and function of the tympanic membrane: a review. Acta oto-rhino-laryngologica belgica. 1995;49:101–115. [PubMed] [Google Scholar]
- Macassey E, Dawes P. Biofilms and their role in otorhinolaryngological disease. Journal of Laryngology and Otology. 2008;122:1273–1278. doi: 10.1017/S0022215108002193. [DOI] [PubMed] [Google Scholar]
- Nakajima HH, Pisano DV, Roosli C, Hamade MA, Merchant GR, Mahfoud L, Halpin CF, Rosowski JJ, Merchant SN. Comparison of ear-canal reflectance and umbo velocity in patients with conductive hearing loss: A preliminary study. Ear and Hearing. 2012;33:35–43. doi: 10.1097/AUD.0b013e31822ccba0. [DOI] [PMC free article] [PubMed] [Google Scholar]
- Nguyen CT, Jung W, Kim J, Chaney EJ, Novak M, Stewart CN, Boppart SA. Noninvasive in vivo optical detection of biofilm in the human middle ear. Proceedings of the National Academy of Sciences. 2012;109:9529–9534. doi: 10.1073/pnas.1201592109. [DOI] [PMC free article] [PubMed] [Google Scholar]
- Nguyen CT, Tu H, Chaney EJ, Stewart CN, Boppart SA. Non-invasive optical interferometry for the assessment of biofilm growth in the middle ear. Biomedical Optics Express. 2010;1:1104–1116. doi: 10.1364/BOE.1.001104. [DOI] [PMC free article] [PubMed] [Google Scholar]
- Parsek MR, Singh PK. Bacterial biofilms: an emerging link to disease pathogenesis. Annual Reviews in Microbiology. 2003;57:677–701. doi: 10.1146/annurev.micro.57.030502.090720. [DOI] [PubMed] [Google Scholar]
- Piskorski P, Keefe DH, Simmons JL, Gorga MP. Prediction of conductive hearing loss based on acoustic ear-canal response using a multivariate clinical decision theory. The Journal of the Acoustical Society of America. 1999;105:1749–1764. doi: 10.1121/1.426713. [DOI] [PubMed] [Google Scholar]
- Pitris C, Saunders KT, Fujimoto JG, Brezinski ME. High-resolution imaging of the middle ear with optical coherence tomography: a feasibility study. Archives of Otolaryngology Head & Neck Surgery. 2001;127:637–642. doi: 10.1001/archotol.127.6.637. [DOI] [PubMed] [Google Scholar]
- Robinson SR, Nguyen CT, Allen JB. Characterizing the ear canal acoustic impedance and reflectance by pole-zero fitting. Hearing Research. 2013 doi: 10.1016/j.heares.2013.03.004. http://dx.doi.org/10.1016/j.heares.2013.03.004. [DOI] [PMC free article] [PubMed] [Google Scholar]
- Rosowski JJ, Nakajima HH, Hamade MA, Mahfoud L, Merchant GR, Halpin CF, Merchant SN. Ear-canal reflectance, umbo velocity, and tympanometry in normal-hearing adults. Ear and Hearing. 2012;33:19–34. doi: 10.1097/AUD.0b013e31822ccb76. [DOI] [PMC free article] [PubMed] [Google Scholar]
- Shahnaz N, Bork K, Polka L, Longridge N, Bell D, Westerberg BD. Energy reflectance and tympanometry in normal and otosclerotic ears. Ear and Hearing. 2009;30:219. doi: 10.1097/AUD.0b013e3181976a14. [DOI] [PubMed] [Google Scholar]
- Voss SE, Allen JB. Measurement of acoustic impedance and reflectance in the human ear canal. The Journal of the Acoustical Society of America. 1994;95:372–384. doi: 10.1121/1.408329. [DOI] [PubMed] [Google Scholar]
- Voss SE, Horton NJ, Woodbury RR, Sheffeld KN. Sources of variability in reflectance measurements on normal cadaver ears. Ear and Hearing. 2008;29:651–665. doi: 10.1097/AUD.0b013e318174f07c. [DOI] [PubMed] [Google Scholar]
- Xi C, Marks D, Schlachter S, Luo W, Boppart SA. High-resolution three-dimensional imaging of biofilm development using optical coherence tomography. Journal of Biomedical Optics. 2006;11:034001. doi: 10.1117/1.2209962. [DOI] [PubMed] [Google Scholar]
- Zysk AM, Nguyen FT, Oldenburg AL, Marks DL, Boppart SA. Optical coherence tomography: a review of clinical development from bench to bedside. Journal of Biomedical Optics. 2007;12:051403. doi: 10.1117/1.2793736. [DOI] [PubMed] [Google Scholar]