

Abstract
The use of genetically modified mice can accelerate progress in auditory research. However, the fundamental profile of mouse hearing has not been thoroughly documented. In the current study, we explored mouse middle ear transmission by measuring sound-evoked vibrations at several key points along the ossicular chain using a laser-Doppler vibrometer. Observations were made through an opening in pars flaccida. Simultaneously, the pressure at the tympanic membrane close to the umbo was monitored using a micro-pressure-sensor. Measurements were performed in C57BL mice, which are widely used in hearing research. Our results show that the ossicular local transfer function, defined as the ratio of velocity to the pressure at the tympanic membrane, was like a high-pass filter, almost flat at frequencies above ~15 kHz, decreasing rapidly at lower frequencies. There was little phase accumulation along the ossicles. Our results suggested that the mouse ossicles moved almost as a rigid body. Based on these 1-dimensional measurements, the malleus–incus-complex primarily rotated around the anatomical axis passing through the gonial termination of the anterior malleus and the short process of the incus, but secondary motions were also present.
15. Introduction
The function of the middle ear is to transfer environmental sound collected by the outer ear to the cochlea via vibration of the tympanic membrane (TM) and the ossicles. It is known that the middle ear, including the TM, middle ear air space and ossicles, the malleus, incus and stapes, varies greatly in form and size among mammals (Rosowski, 2003). The middle ear morphology relates to its function. For example, the low frequency hearing in gerbil benefits from the relatively large bulla (Plassmann and Kadel, 1991) and the specialized malleus–incus-complex in the cetaceans is adapted for hearing under water (Fleischer, 1978).
The mouse middle ear falls into the category of ‘microtype’, following the terminology of Fleischer (1978) (Fig. 1). The specific features of the mouse ossicular chain are (1) an elongated anterior processes of the malleus (the gonial) that is fused to the tympanic ring (arrow in Fig. 1B); (2) an orbicular apophysis, a prominent mass of bone near the base of the manubrium of the malleus (Fig. 1A) and (3) a wide transversal lamina (Fig. 1A and B). The manubrium is almost parallel to the classical anatomical rotation axis, which is defined by the line passing though the anterior process of the malleus and the short process of the incus (dashed line in Fig. 1A).
Fig. 1.
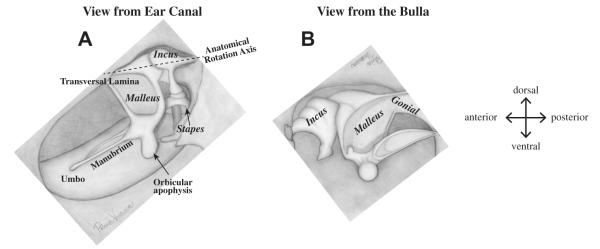
Ossicular chain of mouse. (A) Diagram of mouse middle ear viewed from the ear canal showing the ossicular chain; (B) viewed from the opposite side (stapes was disarticulated). (Drawn by Polina Varavva).
In contrast, the gerbil middle ear is more like the ‘freely mobile’ type (Fleischer, 1978)found in chinchilla, guinea pig, cat and human although the attachment of the malleus to the tympanic ring is more rigid in gerbil than in human. For the ‘freely mobile’ type of ossicles, the anterior process of the malleus is relatively short and the attachment to the tympanic bone is not as solid as in ‘microtype’ (arrow in Fig. 1B). The incus is relatively large and the manubrium is roughly perpendicular to the anatomical axis.
Middle ear transmission has been described as an impedance matching process, coupling the relative low acoustic impedance in air to the much higher input impedance of the cochlea. In the classic view, the impedance matching is achieved by the area ratio of a large tympanic membrane to a smaller stapes – footplate, together with the lever ratio between the malleus and incus rotating about the anatomical axis. Middle ear transmission leads to a pressure gain, the pressure at the stapes is much higher than the pressure at the ear canal. This has been shown in cat (Decory et al., 1990; Nedzelnitsky, 1980), chinchilla (Decory et al., 1990;Slama et al., 2010), gerbil (Dong and Olson, 2006; Olson, 1998,2001), guinea pig (Dancer and Franke, 1980; Decory et al., 1990;Magnan et al., 1997) and human temporal bone (Aibara et al., 2001;Nakajima et al., 2008; Puria, 2003; Puria et al., 1997). Detailed study of middle ear transmission suggests that the middle ear vibration is not as simple as the classic model suggests, especially at high frequencies. For example, a complex vibration pattern on the tympanic membrane (Cheng et al., 2010; Cheng et al., 2011; de La Rochefoucauld and Olson, 2010; Khanna and Tonndorf, 1972;Rosowski et al., 2009) and bending along the manubrium in gerbil (de La Rochefoucauld and Olson, 2010) were in evidence. The stapes, driven by the motion of the long process of the incus, produces the acoustic input to the cochlea and was found to be rotating instead of simply moving as a piston in human temporal bone (Hato et al., 2003; Heiland et al., 1999); cat (Decraemer et al., 2003; Decraemer and Khanna, 2003; Guinan and Peake, 1967) and gerbil (Decraemer et al., 2007; Huber et al., 2008; Ravicz et al., 2008). Understanding middle ear function is important because it shapes the sound going into the cochlea as well as the sound traveling out from the cochlea as otoacoustic emissions (Dalhoff et al., 2011; Dong et al., 2012; Dong and Olson, 2006; Keefe, 2002; Keefe and Abdala, 2007; Magnan et al., 1997; Puria, 2003;Voss and Shera, 2004).
Mice have been used in many areas in auditory research and because of the genetic control possible, accelerate our understanding of many different levels of the auditory system. Past studies on the mouse middle ear showed its specific morphology and motion (Fleischer, 1978; Lee et al., 2009; Qin et al., 2010; Rosowski et al., 2003; Saunders and Summers, 1982). However, sound transmission along the mouse ossicular chain is still not well understood.
In the current study, we describe the local transfer function (LTF) along the ossiclar chain in commonly used wide type mice. The complex LTF was calculated by dividing the complex velocity (measured at several ossicular points with a Laser-Doppler vibrometer) by the complex pressure (measured at the tympanic membrane close to umbo using a micro-pressure sensor.) The detailed description of the velocity along the ossicular chain quantifies middle ear transmission and aids in the exploration of middle ear pathologies. The present study informs our understanding of the excitation to the cochlea and the hearing of mice.
2. Methods
Experiments were performed in C57BL mice that were 5–10 weeks old. The care and use of the animals were approved by the Institutional Animal Care and Use Committee of Columbia University. The mouse was anesthetized with ketamine (13 mg/kg) and urethane (2 mg/g). The analgesic buprenorphine (0.1 mg/kg) was administered every 6 h. At the end of the experiment, the animal was euthanized with an overdose of anesthetic. During the experiment, animal body temperature was maintained at ~37 °C using a thermostatically controlled heating blanket. A tracheotomy was performed to maintain a patent airway. The left pinna was removed. The umbo and manubrium could be accessed through the tympanic membrane. In order to access the malleus and incus, the pars flaccida (PF) was removed (de La Rochefoucauld, et al., 2008;Dong et al., 2012). PF is a nearly transparent membrane with a shape like a shallow bowl. When the pressure across the PF was equalized, for example when the bulla was opened or vented, the PF flattened out and wrinkles developed making it less transparent. Measurements from the umbo and manubrium were made pre- and post-removal of the PF to monitor of the effects of opening the PF on sound transmission. For measurements done prior to opening the PF, the bulla was vented with a tiny hole to avoid static pressure buildup in the bulla cavity.
Fig. 2 shows the view of the mouse middle ear ossicles through the opening in PF. Velocities (V) at points (filled dots in Fig. 2) along the ossicular chain were sequentially measured using a Laser-Doppler vibrometer (LDV, Polytec, OFV-534, and VD-06 decoder). The vibrometer’s Helium–Neon laser was focused on the preparation with a 5 × Mitutoyo lens with 33.5 mm focusing distance. As reported by the manufacturer, the focused spot size (1/e2) is 3 μm. The noise level of the velocity measurement depends on the amount of reflected light and was typically less than 10−4 mm/s at frequencies below 30 kHz and somewhat larger at higher frequencies.
Fig. 2.

Illustration of the experimental approach. After removal of the PF (dashed frame), the ossicles could be seen from the ear canal opening. The velocity at different spots (filled dots) along the ossicular chain was measured with a Laser-Doppler vibrometer (LDV, Polytec). Simultaneously, pressure at the tympanic membrane close to the umbo (PTM) and at the EC opening (PEC) were measured by a micro-pressure sensor and a B&K probe tube microphone. Region of the removed PF was illustrated by the dashed-frame.
Simultaneously, the pressure at the tympanic membrane (PTM) was measured at a location close to the umbo using a micro-pressure sensor of outer diameter 125 um, which was constructed in the lab (e.g., (Dong and Olson, 2009; Olson, 1998)). The sensors were calibrated in water and air after construction and pre- and post-experiments. The sound pressure level was set with a Bruel and Kjaer probe-tube microphone (model 4134) coupled to a Radio Shack tweeter and positioned at the ear canal opening (PEC). The transfer function of the probe-tube was accounted for when setting the sound pressure level (SPL, decibels relative to 20 μPa peak) and analyzing the data. With 1 s of data acquisition the microphone noise level (with probe-tube) was ~ −10 to 25 dB SPL up to 50 kHz. The noise level was determined by the average value of the six FFT points below and above the stimulus frequency.
The ear was acoustically stimulated with pure tones (frequency swept from 0.5 to 50 kHz in 75 steps) via a single Radio Shack 40–1377 tweeter. Acoustic stimuli were generated and collected digitally using a Tucker Davis Technologies (TDT) System III. Stimulus and acquisition programs were written in Matlab and the TDT Visual Design Studio. The sampling frequency of the TDT system was 200 kHz. Data were stored following removal of the first 4096 points of the response waveform to avoid the transient, and time-averaging the remaining waveform, typically in 50 time-locked segments. Responses were later analyzed by Fourier transform in Matlab.
To evaluate the middle ear transmission along the ossicular chain, the complex LTF was found by comparing the velocity to the pressure at the TM. The magnitude of the LTF was defined as: ∣V∣/∣PTM∣ and the phase was ΦV–ΦPTM. The phase group delay was defined as the negative slope of the radian phase-versus-radian frequency response.
3. Results
The ossicles were viewed at an angle perpendicular to the stapes’ footplate and our results are of the velocity in this direction. Eight animals were used and common features of middle ear function were similar in the in-vivo and post mortem condition, similar to results in gerbil (de La Rochefoucauld et al., 2010; Dong and Olson, 2009). The ossicular velocity increased linearly with sound pressure level over the stimulus range tested, from 70 to 100 dB SPL.
3.1. Effect of removal of PF
In order to access the malleus, incus and stapes along the direction perpendicular to the stapes’ footplate the PF had to be removed. The umbo can be viewed and its velocity measured without removing the PF (left panel of Fig. 3). To illustrate the effect of PF removal on sound transmission, Fig. 3 shows the responses of the umbo before and after removing the PF (in-vivo measurements). Amplitude and phase of the velocity response were plotted versus frequency in Fig. 3A and B. In this example the velocity is shown referenced to the pressure at the EC opening (PEC). Even though the area of the PF in mouse is ~30% of the total area of the TM the only significant change in umbo motion was at frequencies below 5 kHz, similar to previous findings in mice (Saunders and Summers, 1982). Therefore, opening of the PF caused substantial change of sound transmission only at low frequencies, similar to the change in gerbils (de La Rochefoucauld et al., 2008; Dong et al., 2012).
Fig. 3.

Effect of removal of the PF. (A) Velocity of the umbo referenced to the pressure at the ear canal opening; (B) Phase of the umbo velocity referenced to pressure at the EC opening; left panel illustrates the recording spot. Solid and dotted lines indicate responses with PF intact and removed. (Expt. M129.)
3.2. Middle ear transmission along the ossicular chain
Middle ear transmission was characterized by the LTF, V/PTM, at spots along the ossicular chain (Fig. 2). The pattern was consistent among animals, and pre- and post mortem. Below we show data from an in-vivo experiment, M133, to illustrate the major points. The velocities of the umbo and spots along the manubrium were measured from a slightly different angle (~30°) from the direction perpendicular to the stapes footplate. Measurements at the same location on the posterior arm of the malleus at the two angles were very similar. We include the umbo and manubrium responses in this report without accounting for the angle of approach, although with a more direct angle the motions along the manubrium and umbo would likely be larger. The result from the umbo is plotted as a gray dashed line in all the figures.
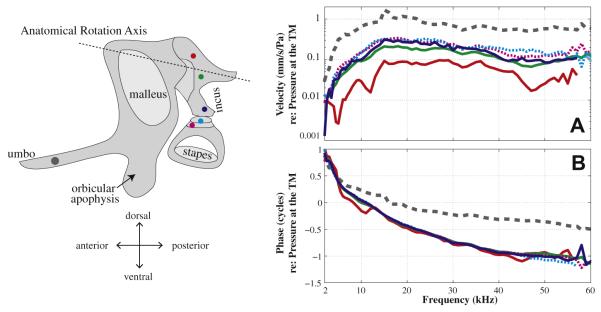
3.2.1. Along the manubrium, from umbo to the lateral process of the malleus
Fig. 4 shows three LTFs, magnitude (Fig. 4A) and phase (Fig. 4B), at the umbo (gray dashed), the mid manubrium (gray solid) and the lateral process of the malleus (black solid, LPM, which we use to identify the location where the manubrium meets the malleus body) (locations are illustrated in the left panel of Fig. 4). These measurements were made from the same viewing angle. The umbo moved the most (Fig. 4A). The amplitude of the LTF decreased as the measurement spot moved away from the umbo toward the body of the malleus, especially at frequencies above 10 kHz. The two points on the manubrium moved in phase (gray in Fig. 4B). However a clear phase accumulation was seen between those points and the LPM (black solid in Fig. 4B).
Fig. 4.

Middle ear transmission along the manubrium. (A) Magnitude of LTF, ∣V∣/∣PTM∣; (B) Phase referenced to pressure at the TM. Gray dashed, gray solid and black represent responses at the umbo, mid manubrium and lateral process of the malleus as indicated in the dots in the left panel. (Expt. M133, with PF removed).
3.2.2. Along the anterior arm of the malleus
Along the anterior arm of the malleus, the LTF magnitude decreased at all frequencies as the measurement location moved toward the anatomical rotation axis (Fig. 5A). The entire anterior arm seemed to move as a rigid body, as most of the spots were in phase (Fig. 5B). The amplitude of the LTF was smallest at the spot closest to the anatomical rotation axis (magenta in Fig. 5A) and the phase at that location was off slightly from the other locations (magenta in Fig. 5B).
Fig. 5.

Middle ear transmission along the anterior arm of malleus. (A) Magnitude of LTF, ∣V∣/∣PTM∣; (B) Phase referenced to pressure at the TM. Lines in blue, green, red, cyan and magenta represent the measurement location moving dorsal. Responses at the umbo are shown in the gray dashed line for comparison. (Expt. M133, with PF removed).
3.2.3. Along the posterior arm of the malleus and on the transversal lamina
Along the posterior arm of the malleus, the amplitude of the LTF decreased as the measurement point moved toward the anatomical rotation axis (Fig. 6A). The two most dorsal points, located close to the malleus–incus-joint, moved the least (cyan and magenta inFig. 6A, the two curves nearly overlie). The spot on the transversal lamina showed similar amplitude and phase as the posterior spot on the posterior arm of the malleus, suggesting that the traversal lamina moved together with the posterior arm of the malleus (blackdotted and green solid in Fig. 6A). Most of the points on the posterior arm of the malleus and transversal lamina moved inphase except the two most dorsal points, which moved anti-phase with the others (cyan and magenta in Fig. 6B). This suggests that the malleus rotates along the anatomical axis defined by the anterior of the malleus and short process of incus (dashed line in Fig. 6 drawing), and that the two most dorsal points were on the opposite side of the rotation axis compared to the other points.
Fig. 6.

Middle ear transmission along posterior arm of malleus. (A) Magnitude of LTF, ∣V∣/∣PTM∣; (B) Phase referenced to pressure at the TM. Lines in blue, green, red, cyan and magenta represent the measurement location moving dorsal, except for the extra point on the transversal lamina, which is dotted. Responses at the umbo are shown in the gray dashed lines for comparison. (Expt. M133, with PF removed).
3.2.4. Along the incus and on the stapes
Along the incus, the decrease of the LTF magnitude from the long process of the incus to the anatomical rotation axis was seen again (in order of blue, green and red in Fig. 7A). Most of the points along the incus moved in-phase and the most dorsal spot close to the malleus–incus-joint showed some phase difference compared to others (red in Fig. 7B). All these observations reinforce the idea that the rotation motion is primarily along the classic anatomical rotation axis (dashed line in illustration panel). In addition, the magnitude and phase of stapes’ LTF were similar to those of the long process of the incus (dotted and blue solid in Fig. 7A and B). Thus along the direction perpendicular to the stapes’ footplate, the stapes followed the motion of the long process of the incus.
Fig. 7.
Middle ear transmission along the incus and on the stapes. (A) Magnitude of LTF, ∣V∣/∣PTM∣; (B) Phase referenced to pressure at the TM. Solid and dashed lines represent responses on the incus and stapes as shown in the left panel. Lines in blue, green, red represent the measurement location moving dorsal along the incus. Cyan and magenta stand for measurements from the head of stapes, which are dotted. Responses at the umbo are in the gray dashed lines for comparison. (Expt. M133, with PF removed).
3.2.5. Lever ratio
In the classic ossicular theory the ossicles rotate along the anatomical rotation axis (shown in the dashed lines in the top panels in Fig. 8). Part of the middle ear pressure gain is contributed by the lever ratio of the length of the long process of the incus to the length of the long process of the malleus (thin lines in the top panels in Fig. 8). (In ‘freely mobile’ ossicular chains, for example, the gerbil, the manubrium is nearly perpendicular to the anatomical rotation axis and the full lever ratio is found as distance of LPI from the anatomical rotation axis/distance of umbo from the anatomical rotation axis but in the ‘microtype’ middle ear the manubrium is almost parallel to the anatomical axis, and thus we do not include the manubrium in the lever-ratio comparison.). In the bottom panel of Fig. 8, the velocity ratio LPI/LPM is plotted, with individual cases as thin dotted lines and the average of five animals as a solid line. For comparison, gerbil LPI/LPM findings are included (gray dashed line) (de La Rochefoucauld et al., 2010). In the literature, the lengths of the ossicles were measured (Rosowski et al., 1999) and the ratio LPI/LPM was calculated as ~0.7 in gerbil and 0.5 in mouse (Saunders and Summers, 1982). The velocity ratio calculated from the velocity measurements agreed with the anatomical values at frequencies below 30 kHz in gerbil and mouse and departed at higher frequencies where the lever ratio was ~0.9 in mouse and ~0.2 in gerbil. The frequency dependence suggests the onset of relatively complex motion and indeed it is known that above ~10 kHz the gerbil stapes moves in three dimensions – rocking in addition to the plunging motion (Decraemer et al., 2007; Huber et al., 2008; Ravicz et al., 2008).
Fig. 8.
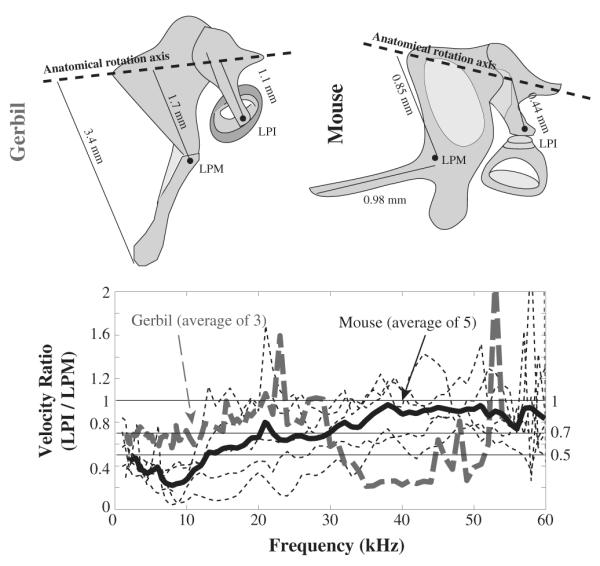
Velocity ratio LPI/LPM illustrates the lever ratio. Gerbil responses measured from the same lab are included for comparison gerbil and mouse anatomical measures are in the top panels and the averaged velocity ratio from gerbil and mouse are plotted as dashed and solid thick lines in the bottom panel. Thin dashed lines indicate individual mouse results. Gerbil data were re-plotted from Fig. 4 of de La Rochefoucauld et al. (2010).
3.2.6. Summary of middle ear transmission along the ossicular chain
Fig. 9 summarizes the transmission at key spots along the ossicular chain indicated in the left panel. Besides the LPM (black), the amplitude versus frequency of the LTF at the umbo (gray dashed), posterior arm of malleus (green), incus (red) and stapes (cyan) were similar to each other (Fig. 9A). All showed a high-pass filter shape with a steep increase at frequencies below ~15 kHz, ~10 dB/octave, and stayed almost flat up to 60 kHz. The amplitude of the LTF of the LPM was different from others in that it decreased with frequency at frequencies above 30 kHz. The phase of LTF of the umbo accumulated smoothly with frequency (gray dashed in Fig. 9B). There was more phase accumulation at the LPM and a gradual increase in phase accumulation as the measurement location proceeded to the incus and stapes. If we characterize the phase-versus-frequency as phase group delay (negative slopes of dotted thin lines in Fig. 9B), at frequencies between 20 and 55 kHz, the phase group delays were ~9 μs at the umbo (gray dashed) and ~19 μs at the stapes (cyan solid). Thus, the phase group delay that accumulated along the ossicular chain, between the umbo and the stapes, was ~10 μs. However, above μ20 kHz the phase differences between the LPM, the posterior arm of the malleus, the incus and the stapes were more like simple phase shifts than delays (for illustration, the LPM phase was shifted downwards 0.3 cycles as the dash-dotted line in Fig. 9B). Considering the umbo (gray dashed), LPM (black) and posterior malleus (green) measurement locations, above ~35 kHz the umbo and posterior locations are close to a half cycle out of phase and the central LPM location has the smallest magnitude, suggesting a motion along a secondary rotation axis defined by the massive orbicular apophysis and the anterior process of the malleus, as suggested by Fleischer (1978). We will discuss this further below.
Fig. 9.
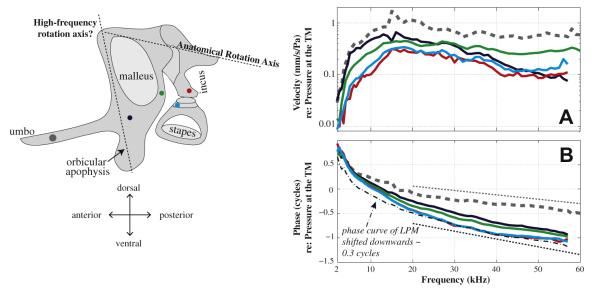
Summary of middle ear transmission along the ossicular chain. (A) Magnitude of LTF, ∣V∣/∣PTM∣; (B) Phase referenced to pressure at the TM. Gray-thick-dashed, blue-solid, green-solid, red-solid and cyan-solid represent responses from the umbo, LPM, point on posterior arm of malleus, LPI and head of stapes. Gray and black very thin lines in panel B indicate the ~ phase group delay at the umbo and stapes. The dashed-dotted line is a vertical downshift of LPM phase of 0.3 cycles. (Expt. M133, with PF removed).
3.3. Correlation of middle ear transmission and hearing threshold
A comparison of hearing threshold and middle ear transmission for mouse is in Fig. 10, which plots the magnitude of the stapes LTF measured through the open ear canal (gray solid) along with the compound action potential (CAP) thresholds measured in our lab (black solid). In addition, auditory brainstem responses (ABR) of C57BL and 129 × C57 Hybrids (Ouagazzal et al., 2006) are shown in blackdotted and dashed lines. All responses were plotted as a function of frequency using log scales and were moved vertically at 10 kHz to facilitate comparison.
Fig. 10.
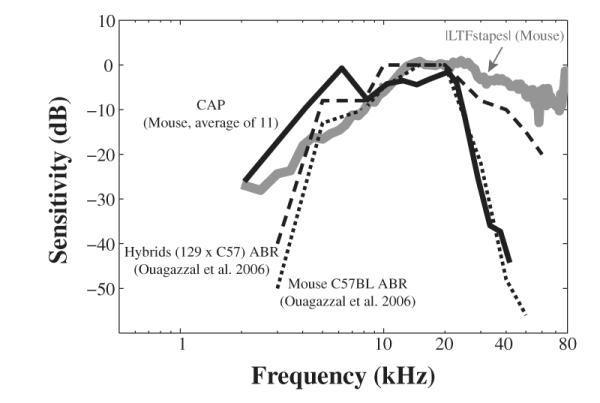
Comparison between the frequency dependence of CAP/ABR thresholds and stapes ∣V∣/∣PTM∣ in mouse. Gray and black solid lines represent the magnitude of stapes LTF and averaged CAP thresholds measured in our lab. Dashed and dotted are ABR thresholds of C57BL and hybrid mice measured by Ouagazzal et al. (2006).
It is striking to see the degree of agreement between the stapes LTF and CAP and ABR thresholds at frequencies below 10 kHz, which suggests that the middle ear sets the low frequency hearing threshold. At frequencies above 20 kHz, the CAP and ABR thresholds depart from the stapes LTF. The CAP threshold curves were averaged data of many animals measured in our lab and some of them showed high frequency hearing loss due to acoustic trauma caused by the invasive approach. In addition, the C57BL mouse is reported to have age-related cochlear hearing loss (Johnson et al., 1997) and indeed we see the CAP thresholds became much less sensitive at frequencies above 30 kHz. High frequency hearing loss was also apparent in ABR recordings from the same strain (redrawn from Ouagazzal et al. (2006)). The ABR recording of hybrids (129 × C56) showed better high frequency hearing, but a departure between the stapes’ velocity and ABR is still obvious, suggesting that even in these hybrid mice the high frequency hearing limit is not determined by stapes excitation. However, high frequency measurements are tricky in that the result is sensitive to where and how the sound calibration is done (this can be appreciated by comparing the umbo velocity in Figs. 1 and 2 in this paper.) Such complications are also apparent in measurements in gerbil, for example Fig. 12 in (Ravicz et al., 2008) and Fig. 9 in (de La Rochefoucauld et al., 2010) compare gerbil stapes velocities from different labs and show departures at high frequencies. To summarize, while the high frequency threshold is influenced by several physiological and experimental factors in addition to middle ear transmission, the robust relationship between middle ear transmission and the low frequency hearing threshold is beyond doubt.
4. Discussion
To characterize middle ear transmission in mouse, the velocity was mapped along the ossicular chain and simultaneously the pressure at the TM was measured. In order to access the ossicular chain through the ear canal, the PF was removed. The removal of the PF did not affect the LTF above ~5 kHz (Fig. 3). Therefore, even though the mouse PF is relatively large it has little role in sound transmission, and middle ear excitation is essentially unaffected by this large opening (Saunders and Summers, 1982; Teoh et al., 1997).
The frequency-dependent ossicular vibration is determined by the anatomical and physical properties of the middle ear system. For the ‘freely mobile’ type of middle ear, the ossicles primarily rotate about the anatomical axis at low frequencies (low-frequency mode). At high frequencies, the vibration of the ossicles has been shown to be relatively complicated, with flexing at the malleusincus joint and along the manubrium. A twisting of the malleus–incus joint in cat and human was described as a gear mechanism recently (Puria and Steele, 2010). Another type of bi-model motion was recently demonstrated in the Cape golden mole, whose middle ear has similarities to the ‘microtype’ ear (Willi et al., 2006).
Based on the anatomy Fleischer (1978) hypothesized that there were two vibration modes for the ‘microtype’ middle ear. One mode is the low-frequency mode in which the ossicles rotate around the anatomical axis. The other mode is the high-frequency mode in which the ossicles rotate about an axis perpendicular to the anatomical axis, and passing through the massive orbicular apophysis (see illustration in Fig. 9). Related to this hypothesis, an analysis of distribution of the ossicular mass and rotational inertia of the two types of middle ear system showed that the anatomical axis and the minimum inertia axis were the same in the ‘freely mobile’ system but different in the ‘microtype’ ear (Lavender et al., 2011). A previous study on the motion of the mouse ossicles confirmed the low-frequency mode, and observed a motion pattern that suggested a transition to the second “minimum-inertia” mode above 10 kHz, but concluded that motions around the anatomical axis provided the main functional motions throughout the 35 kHz range of their measurements (Saunders and Summers, 1982).
When referenced to sound pressure close to the ear canal with a probe tube system, the ossicular velocity we observed was similar to what has been reported in the literature (Doan et al., 1996; Qin et al., 2010; Rosowski et al., 2003; Saunders and Summers, 1982) in that it increased quickly from low frequency to ~ 20 kHz and then decreased (refer to Fig. 3, where the velocity was normalized to PEC).However, when the velocity was normalized to the TM pressure close to the umbo with a micro-pressure sensor, the LTFs were simply those of a high-pass filter in that they increased quickly to ~ 15 kHz, then stayed ~ flat up to 60 kHz, the high frequency limit of our measurements (Figs. 4–7).
The phase versus frequency curves showed little phase accumulation from the LPM to the stapes (Fig. 9B), indicating that there was little slippage at the malleus–incus-joint or the incudo-stapedial joint. Therefore, the malleus and incus plus stapes could be considered basically as a rigid body moving in 3-d, although a small degree of slippage or flexing cannot be ruled out. The additional phase accumulation of the LPM to the umbo (Fig. 3B) suggested that flexing occurred where the manubrium met the body of the malleus, but such phase shifts could also occur due to a combination of rigid body motions. The group delay between the umbo and stapes was ~10 μs, which was similar to that in gerbil, although in gerbil the delay accumulates along the entire chain (de La Rochefoucauld et al., 2010).
The results showed that the amplitude of the LTF decreased from ventral to dorsal locations, and the most dorsal spots close to the anatomical rotation axis moved the least, with some phase differences compared to more ventral locations. Spots on the malleus close to the malleus–incus-joint showed ~180° phase shift (Figs. 3–7), an observation consistent with these locations being on the far side of the rotation axis. At frequencies below 30 kHz, the lever ratio LPI/LPM approximately agreed with the anatomically predicted values (Fig. 8). These basic observations support the notion that to a first approximation the malleus–incuscomplex can be modeled as a rigid body that rotates along the axis going through the tethers of anterior malleus and the short process of the incus, the classic anatomical rotation axis.
However, not all aspects of the motion were consistent with rotation along the anatomical axis. Above ~30 kHz, the umbo motion was almost 180° out of phase with the malleus, and the LPM, which is very close to the massive orbicular apophysis, moved less than the anterior spot on the posterior arm of malleus (Fig. 9). The motion above w30 kHz might be best described as a summation of rotations about two axes, with the second axis through the center of mass of the malleus–incus complex, a motion that would minimize the moment of inertia and thus the rotational inertial (Fleischer, 1978; Lavender et al., 2011). In our results this second axis seemed to align with the anterior extension of the malleus, and the orbicular apophysis (dashed line in left panel in Fig. 9).
5. Conclusion
In the “textbook” description of middle ear function, the TM moves as a piston and the ossicles move as a rigid body that rotates around the anatomical axis, with manubrium, LPM and LPI all in correct formation to leverage TM motion to a relatively smaller stapes motion, in order to drive the cochlea. Modern observations, showing the TM moving in a complex wavy pattern and the ossicles moving in ways beyond the classic rotation and flexing at the joints, have shown that this textbook description is only a rough approximation of the reality. The distributed motion in both the TM and ossicles can be understood as resulting from the need to reduce effective mass, in order to have a system that can operate to high frequencies (Fay et al., 2006; Puria and Allen, 1998; Puria and Steele, 2010). In the ‘microtype’ ear of the mouse, even the basic anatomy argues against the textbook description, with the manubrium heading off at an angle almost parallel to the anatomical axis, and a seemingly unnecessary mass added to the manubrium – the odd globe of bone termed the orbicular apophysis. Fleischer (1978) proposed that this massive globe worked as a sort of vibration-isolation unit, allowing other components to move while it stayed relatively stationary – and thus establishing a second rotation axis. Such a role was supported in our measurements above 30 kHz, where the nearby LPM moved less than the more posterior manubrium, and less than even the stapes above 50 kHz. While this stationary-mass effect was significant above 30 kHz, the classic anatomical axis remained the primary rotation axis, and the primary mode of motion, throughout the entire frequency range. Thus the ‘microtype’ system seems to have solved the ossicular mass problem via complex motion of a nearly rigid body, as opposed to the flexible redistribution of mass observed in the ossicles of more ‘freely mobile’ middle ears.
Acknowledgments
Supported by the NIDCD and the Emil Capita Charitable Foundation. We thank the two reviewers for improving the presentation.
References
- Aibara R, Welsh JT, Puria S, Goode RL. Human middle-ear sound transfer function and cochlear input impedance. Hear. Res. 2001;152(1–2):100–109. doi: 10.1016/s0378-5955(00)00240-9. [DOI] [PubMed] [Google Scholar]
- Cheng JT, Aarnisalo AA, Harrington E, Hernandez-Montes Mdel S, Furlong C, Merchant SN, et al. Motion of the surface of the human tympanic membrane measured with stroboscopic holography. Hear. Res. 2010;263(1–2):66–77. doi: 10.1016/j.heares.2009.12.024. [DOI] [PMC free article] [PubMed] [Google Scholar]
- Cheng JT, Harrington E, Furlong C, Rosowski JJ. The tympanic membrane motion in forward and reverse middle-ear sound transmission. Paper presented at the Mechanics of Hearing 2011; Williamstown, Massachusetts. Jul, 2011. [Google Scholar]
- Dalhoff E, Turcanu D, Gummer AW. Forward and reverse transfer functions of the middle ear based on pressure and velocity DPOAEs with implications for differential hearing diagnosis. Hear. Res. 2011;280(1–2):86–99. doi: 10.1016/j.heares.2011.04.015. [DOI] [PubMed] [Google Scholar]
- Dancer A, Franke R. Intracochlear sound pressure measurements in guinea pigs. Hear. Res. 1980;2(3–4):191–205. doi: 10.1016/0378-5955(80)90057-x. [DOI] [PubMed] [Google Scholar]
- de La Rochefoucauld O, Decraemer WF, Khanna SM, Olson ES. Simultaneous measurements of ossicular velocity and intracochlear pressure leading to the cochlear input impedance in gerbil. Jaro-J. Assoc. Res. Otolaryngol. 2008;9(2):161–177. doi: 10.1007/s10162-008-0115-1. [DOI] [PMC free article] [PubMed] [Google Scholar]
- de La Rochefoucauld O, Kachroo P, Olson ES. Ossicular motion related to middle ear transmission delay in gerbil. Hear. Res. 2010;270(1–2):158–172. doi: 10.1016/j.heares.2010.07.010. [DOI] [PMC free article] [PubMed] [Google Scholar]
- de La Rochefoucauld O, Olson ES. A sum of simple and complex motions on the eardrum and manubrium in gerbil. Hear. Res. 2010;263(1–2):9–15. doi: 10.1016/j.heares.2009.10.014. [DOI] [PMC free article] [PubMed] [Google Scholar]
- Decory L, Franke RB, Dancer AL. Measurement of middle ear transfer function in cat, chinchilla and guinea pig. In: Dallos P, Geisler CD, Matthews JW, Ruggero MA, Steele CR, editors. The Mechanics and Biophysics of Hearing. Springer Verlag; Berlin: 1990. pp. 270–277. [Google Scholar]
- Decraemer WF, de La Rochefoucauld O, Dong W, Khanna SM, Dirckx JJ, Olson ES. Scala vestibuli pressure and three-dimensional stapes velocity measured in direct succession in gerbil. J. Acoust. Soc. Am. 2007;121(5 Pt1):2774–2791. doi: 10.1121/1.2709843. [DOI] [PubMed] [Google Scholar]
- Decraemer WF, Dirckx JJ, Funnell WR. Three-dimensional modelling of the middle-ear ossicular chain using a commercial high-resolution X-ray CT scanner. J. Assoc. Res. Otolaryngol. 2003;4(2):250–263. doi: 10.1007/s10162-002-3030-x. [DOI] [PMC free article] [PubMed] [Google Scholar]
- Decraemer WF, Khanna SM. Measurement, visualization and quantitative analysis of complete three-dimensional kinematical data sets of human and cat middle ear. Paper presented at the Proceedings of the Middle Ear Mechanics in Res.earch and Otology; Matsuyama. 2003. [Google Scholar]
- Doan DE, Erulkar JS, Saunders JC. Functional changes in the aging mouse middle ear. Hear. Res. 1996;97(1–2):174–177. [PubMed] [Google Scholar]
- Dong W, Decraemer WF, Olson ES. Reverse transmission along the ossicular chain in gerbil. J. Assoc. Res. Otolaryngol. 2012;13(4):447–459. doi: 10.1007/s10162-012-0320-9. [DOI] [PMC free article] [PubMed] [Google Scholar]
- Dong W, Olson ES. Middle ear forward and reverse transmission in gerbil. J. Neurophysiol. 2006;95(5):2951–2961. doi: 10.1152/jn.01214.2005. [DOI] [PubMed] [Google Scholar]
- Dong W, Olson ES. In vivo impedance of the gerbil cochlear partition at auditory frequencies. Biophys. J. 2009;97(5):1233–1243. doi: 10.1016/j.bpj.2009.05.057. [DOI] [PMC free article] [PubMed] [Google Scholar]
- Fay JP, Puria S, Steele CR. The discordant eardrum. Proc. Natl. Acad. Sci. U. S. A. 2006;103(52):19743–19748. doi: 10.1073/pnas.0603898104. [DOI] [PMC free article] [PubMed] [Google Scholar]
- Fleischer G. Evolutionary principles of the mammalian middle ear. Adv. Anat. Embryol. Cell. Biol. 1978;55(5):3–70. doi: 10.1007/978-3-642-67143-2. [DOI] [PubMed] [Google Scholar]
- Guinan JJ, Jr., Peake WT. Middle-ear characteristics of anesthetized cats. J. Acoust. Soc. Am. 1967;41(5):1237–1261. doi: 10.1121/1.1910465. [DOI] [PubMed] [Google Scholar]
- Hato N, Stenfelt S, Goode RL. Three-dimensional stapes footplate motion in human temporal bones. Audiol. Neurootol. 2003;8(3):140–152. doi: 10.1159/000069475. [DOI] [PubMed] [Google Scholar]
- Heiland KE, Goode RL, Asai M, Huber AM. A human temporal bone study of stapes footplate movement. Am. J. Otol. 1999;20(1):81–86. [PubMed] [Google Scholar]
- Huber AM, Sequeira D, Breuninger C, Eiber A. The effects of complex stapes motion on the response of the cochlea. Otol. Neurotol. 2008;29(8):1187–1192. doi: 10.1097/MAO.0b013e31817ef49b. [DOI] [PubMed] [Google Scholar]
- Johnson KR, Erway LC, Cook SA, Willott JF, Zheng QY. A major gene affecting age-related hearing loss in C57BL/6J mice. Hear. Res. 1997;114(1–2):83–92. doi: 10.1016/s0378-5955(97)00155-x. [DOI] [PubMed] [Google Scholar]
- Keefe DH. Spectral shapes of forward and reverse transfer functions between ear canal and cochlea estimated using DPOAE input/output functions. J. Acoust. Soc. Am. 2002;111(1 Pt 1):249–260. doi: 10.1121/1.1423931. [DOI] [PubMed] [Google Scholar]
- Keefe DH, Abdala C. Theory of forward and reverse middle-ear transmission applied to otoacoustic emissions in infant and adult ears. J. Acoust. Soc. Am. 2007;121(2):978–993. doi: 10.1121/1.2427128. [DOI] [PMC free article] [PubMed] [Google Scholar]
- Khanna SM, Tonndorf J. Tympanic membrane vibrations in cats studied by time-averaged holography. J. Acoust. Soc. Am. 1972;51(6):1904–1920. doi: 10.1121/1.1913050. [DOI] [PubMed] [Google Scholar]
- Lavender D, Taraskin SN, Mason MJ. Mass distribution and rotational inertia of “microtype” and “freely mobile” middle ear ossicles in rodents. Hear. Res. 2011;282(1–2):97–107. doi: 10.1016/j.heares.2011.09.003. [DOI] [PubMed] [Google Scholar]
- Lee JH, Park K, Kang TC, Choung YH. Three-dimensional anatomy of the temporal bone in normal mice. Anat. Histol. Embryol. 2009;38(4):311–315. doi: 10.1111/j.1439-0264.2009.00946.x. [DOI] [PubMed] [Google Scholar]
- Magnan P, Avan P, Dancer A, Smurzynski J, Probst R. Reverse middle-ear transfer function in the guinea pig measured with cubic difference tones. Hear. Res. 1997;107(1–2):41–45. doi: 10.1016/s0378-5955(97)00015-4. [DOI] [PubMed] [Google Scholar]
- Nakajima HH, Dong W, Olson ES, Merchant SN, Ravicz ME, Rosowski JJ. Differential intracochlear sound pressure measurements in normal human temporal bones. J. Assoc. Res. Otolaryngol. 2008;10(1):23–36. doi: 10.1007/s10162-008-0150-y. [DOI] [PMC free article] [PubMed] [Google Scholar]
- Nedzelnitsky V. Sound pressures in the basal turn of the cat cochlea. J. Acoust. Soc. Am. 1980;68(6):1676–1689. doi: 10.1121/1.385200. [DOI] [PubMed] [Google Scholar]
- Olson ES. Observing middle and inner ear mechanics with novel intracochlear pressure sensors. J. Acoust. Soc. Am. 1998;103(6):3445–3463. doi: 10.1121/1.423083. [DOI] [PubMed] [Google Scholar]
- Olson ES. Intracochlear pressure measurements related to cochlear tuning. J. Acoust. Soc. Am. 2001;110(1):349–367. doi: 10.1121/1.1369098. [DOI] [PubMed] [Google Scholar]
- Ouagazzal AM, Reiss D, Romand R. Effects of age-related hearing loss on startle reflex and prepulse inhibition in mice on pure and mixed C57BL and 129 genetic background. Behav. Brain Res. 2006;172(2):307–315. doi: 10.1016/j.bbr.2006.05.018. [DOI] [PubMed] [Google Scholar]
- Plassmann W, Kadel M. Low-frequency sensitivity in a gerbilline rodent, Pachyuromys duprasi. Brain Behav. Evol. 1991;38(2–3):115–126. doi: 10.1159/000114382. [DOI] [PubMed] [Google Scholar]
- Puria S. Measurements of human middle ear forward and reverse acoustics: implications for otoacoustic emissions. J. Acoust. Soc. Am. 2003;113(5):2773–2789. doi: 10.1121/1.1564018. [DOI] [PubMed] [Google Scholar]
- Puria S, Allen JB. Measurements and model of the cat middle ear: evidence of tympanic membrane acoustic delay. J. Acoust. Soc. Am. 1998;104(6):3463–3481. doi: 10.1121/1.423930. [DOI] [PubMed] [Google Scholar]
- Puria S, Peake WT, Rosowski JJ. Sound-pressure measurements in the cochlear vestibule of human-cadaver ears. J. Acoust. Soc. Am. 1997;101(5 Pt 1):2754–2770. doi: 10.1121/1.418563. [DOI] [PubMed] [Google Scholar]
- Puria S, Steele C. Tympanic-membrane and malleus-incus-complex co-adaptations for high-frequency hearing in mammals. Hear. Res. 2010;263(1–2):183–190. doi: 10.1016/j.heares.2009.10.013. [DOI] [PMC free article] [PubMed] [Google Scholar]
- Qin Z, Wood M, Rosowski JJ. Measurement of conductive hearing loss in mice. Hear. Res. 2010;263(1–2):93–103. doi: 10.1016/j.heares.2009.10.002. [DOI] [PMC free article] [PubMed] [Google Scholar]
- Ravicz ME, Cooper NP, Rosowski JJ. Gerbil middle-ear sound transmission from 100 Hz to 60 kHz. J. Acoust. Soc. Am. 2008;124(1):363–380. doi: 10.1121/1.2932061. [DOI] [PMC free article] [PubMed] [Google Scholar]
- Rosowski JJ. The middle and external ears of terrestrial vertebrates as mechanical and acoustic transducers. In: Barth FG, Humphrey JA, Secomb TW, editors. Sensors and Sensing in Biology and Engineering. vol. XII. Springer; New York: 2003. pp. 59–69. [Google Scholar]
- Rosowski JJ, Brinsko KM, Tempel BI, Kujawa SG. The aging of the middle ear in 129S6/SvEvTac and CBA/CaJ mice: measurements of umbo velocity, hearing function, and the incidence of pathology. J. Assoc. Res. Otolaryngol. 2003;4(3):371–383. doi: 10.1007/s10162-002-3047-1. [DOI] [PMC free article] [PubMed] [Google Scholar]
- Rosowski JJ, Cheng JT, Ravicz ME, Hulli N, Hernandez-Montes M, Harrington E, et al. Computer-assisted time-averaged holograms of the motion of the surface of the mammalian tympanic membrane with sound stimuli of 0.4-25 kHz. Hear. Res. 2009;253(1–2):83–96. doi: 10.1016/j.heares.2009.03.010. [DOI] [PMC free article] [PubMed] [Google Scholar]
- Rosowski JJ, Ravicz ME, Teoh SW, Flandermeyer D. Measurements of middle-ear function in the Mongolian gerbil, a specialized mammalian ear. Audiol. Neurootol. 1999;4(3–4):129–136. doi: 10.1159/000013831. [DOI] [PubMed] [Google Scholar]
- Saunders JC, Summers RM. Auditory structure and function in the mouse middle ear: an evaluation by SEM and capacitive probe. J. Comp. Physiol. 1982;146:517–525. [Google Scholar]
- Slama MC, Ravicz ME, Rosowski JJ. Middle ear function and cochlear input impedance in chinchilla. J. Acoust. Soc. Am. 2010;127(3):1397–1410. doi: 10.1121/1.3279830. [DOI] [PMC free article] [PubMed] [Google Scholar]
- Teoh SW, Flandermeyer DT, Rosowski JJ. Effects of pars flaccida on sound conduction in ears of Mongolian gerbil: acoustic and anatomical measurements. Hear. Res. 1997;106(1–2):39–65. doi: 10.1016/s0378-5955(97)00002-6. [DOI] [PubMed] [Google Scholar]
- Voss SE, Shera CA. Simultaneous measurement of middle-ear input impedance and forward/reverse transmission in cat. J. Acoust. Soc. Am. 2004;116(4 Pt 1):2187–2198. doi: 10.1121/1.1785832. [DOI] [PubMed] [Google Scholar]
- Willi UB, Bronner GN, Narins PM. Ossicular differentiation of airborne and seismic stimuli in the Cape golden mole (Chrysochloris asiatica) J. Comp. Physiol. A Neuroethol Sens Neural Behav. Physiol. 2006;192(3):267–277. doi: 10.1007/s00359-005-0070-9. [DOI] [PubMed] [Google Scholar]