

Abstract
Affinity purification coupled with mass spectrometry (AP-MS) is a robust technique used to identify protein-protein interactions. With recent improvements in sample preparation, and dramatic advances in MS instrumentation speed and sensitivity, this technique is becoming more widely used throughout the scientific community. To meet the needs of research groups both large and small, we have developed software solutions for tracking, scoring and analyzing AP-MS data. Here, we provide details for the installation and utilization of ProHits, a Laboratory Information Management System designed specifically for AP-MS interaction proteomics. This protocol explains: (i) how to install the complete ProHits system, including modules for the management of mass spectrometry files and the analysis of interaction data, and (ii) alternative options for the use of pre-existing search results in simpler versions of ProHits, including a virtual machine implementation of our ProHits Lite software. We also describe how to use the main features of the software to analyze AP-MS data.
Keywords: Affinity purification coupled with mass spectrometry, Data analysis, Virtual machine, Statistical models, Protein-protein interactions
INTRODUCTION
Affinity purification coupled with mass spectrometry (AP-MS) is now a method of choice for the identification of protein-protein interactions (Gavin et al., 2011; Gingras et al., 2007). However, many laboratories lack a stable solution to store, track, annotate and analyze AP-MS data. MS data are often managed using lists (e.g. Excel files), which may or may not be maintained and properly associated with experimental annotation. To address these problems, we created an open source bioinformatics solution for mass spectrometry-based interaction proteomics called ProHits, initially developed as a laboratory information management system (LIMS) for high throughput AP-MS laboratories (Liu et al., 2010). As described below, this system enables tracking, analyzing and reporting of AP-MS data in a transparent manner. ProHits integrates several other open source tools for AP-MS analysis, including a raw file converter (ProteoWizard; Kessner et al., 2008), a database search engine (X!Tandem from the Global Proteome Machine; Craig and Beavis, 2004), data analysis tools (the Trans-Proteomic Pipeline; Deutsch et al., 2010) an interaction database (BioGRID; Stark et al., 2011) and a visualization tool (Cytoscape Web; Lopes et al., 2010). Another tool that we recently developed is SAINT (Significance Analysis of INTeractome; Breitkreutz et al., 2010; Choi et al., 2011; Skarra et al., 2011), which uses quantitative information embedded in AP-MS data to calculate a probability value for each putative protein-protein interaction. This type of analysis is critical to ensure high data quality in AP-MS experiments, where a significant fraction of the identified proteins are background contaminants (Choi et al.). SAINT has now also been incorporated into ProHits, greatly facilitating the full analysis of AP-MS data.
Bioinformatics tools such as ProHits, developed for large-scale AP-MS projects, have been more difficult to implement for smaller research groups, smaller projects, and for groups that rely on external MS core facilities, in large part due to the significant computational infrastructure and technical expertise required. As a result, many groups still lack a stable solution for the analysis of AP-MS data. To provide a more user-friendly platform that enables any end-user to analyze AP-MS data without the necessity of purchasing Linux computers or employing computer experts, we have developed a virtual machine (VM) implementation of ProHits Lite. This version (ProHits Lite VM) is pre-installed with all necessary plugins (including Cytoscape Web), protein databases, and the SAINT software tool. ProHits Lite VM can be easily installed on recent Microsoft Windows or Mac OS X computers, without any programming expertise. Table I describes the specific requirements and key features of each of the versions of ProHits currently available.
Table 1.
| Version | Hardware Requirements |
Modules included |
Scheduled backup raw files |
Automated database searches |
Link raw files to sample description |
Link search results to sample description |
Upload search results to sample |
Define Project-Bait- Experiment-Sample |
Define Lab-Users; give privileges |
Define protocols, groups |
View and filter results |
Compare multiple samples |
Export data to Tab delimited text |
View data in Cytoscape web |
Compare data to BioGRID |
Prepare data to run SAINT |
Run SAINT and view reports |
Filter SAINT data |
Export to PSI-MI |
|---|---|---|---|---|---|---|---|---|---|---|---|---|---|---|---|---|---|---|---|
| Full | Linux system (CentOS/Fedora), Hard drive > 1TB, Memory > 2GB, |
|
• | • | • | • | • | • | • | • | • | • | • | • | • | • | 2 | • | • |
| Lite Linux | Linux system (CentOS/Fedora), Hard drive > 500GB, Memory > 2GB, |
|
1 | • | • | • | • | • | • | • | • | • | • | 2 | • | • | |||
| Lite VM Windows | Windows XP or 7 with 40GB free space, memory > 2GB |
|
1 | • | • | • | • | • | • | • | • | • | • | • | • | • | |||
| Lite VM OS X | OSX-based computer with 40GB free space |
|
1 | • | • | • | • | • | • | • | • | • | • | • | • | • |
indicates that the feature is enabled, but that details regarding the search parameters are not maintained if the full system is not used
indicates that SAINT and other external software can be run, but that extra installation steps are required
BASIC PROTOCOL 1. INSTALLATION OF THE FULL VERSION OF PROHITS ON A LINUX SERVER
The complete ProHits system (here simply referred to as “ProHits”) was designed to run on Linux computers, with separate servers dedicated to raw file storage, ProHits relational databases, search engines, and additional external tools (Figure 1). In this modular configuration, ProHits is scalable and can thus be expanded for the growing needs of a mass spectrometry facility, and is ideal for large groups. A more cost-effective ProHits version in which the search engine (in this case the open source X!Tandem suite) and all analytical tools are installed on a single Linux server is also available, and appropriate for smaller groups (protocol available at prohitsms.com). Good knowledge of Microsoft Windows and Linux operating systems, as well as full administrative access to the system via Root access, is required for installing the package. We make no claims that ProHits is stable or secured against hackers and strongly suggest that ProHits be kept and used only behind a secured firewall.
Figure 1.

Suggested modular architecture for the complete ProHits system.
Materials
Hardware
ProHits server (Linux) with hard drive for raw file storage (>400GB) and memory (>3GB).
(optional) Server for Mascot (> 400GB; Windows or Linux).
(optional) Server for X!Tandem/GPM and the Trans-Proteomic Pipeline (>400GB; Windows or Linux)
(optional) Server for SEQUEST (>400GB; Windows or Linux)
(optional) ProteoWizard Converter server (Windows), with fast CPU and >3GB memory
Software
ProHits source code (Linux), v2.02, available at prohitsms.com.
CentOS v5.7
(optional) Mascot (Windows or Linux version), v2.2 or 2.3 (Matrix science)
(optional) X!Tandem/GPM (Windows or Linux version), ftp://ftp.thegpm.org/projects/gpm/
(optional) SEQUEST (Windows or Linux version), v26 and v28 were tested (Thermo)
(optional) Trans-Proteomic Pipeline (Windows or Linux version), http://tools.proteomecenter.org/wiki/index.php?title=Software:TPP
(optional) ProteoWizard (Windows), http://proteowizard.sourceforge.net/
(optional) SAINT (Linux), http://saint-apms.sourceforge.net/Main.html
Set up the ProHits server
-
1
Download and unzip the ProHits source code from prohitsms.com
The ProHits server has been designed on an Intel-based Linux computer Fedora core v9 (also tested on Fedora core v15) and CentOS v5.7. It requires the following packages that are available with all Linux distributions: (php, mysql, mysql-devel, mysql-server, php-mysql, httpd (Apache), gd, php-gd, php-pear, php-peah-HTTP-Request, sendmail, perl, perl-libwww-perl, wget, system-config-services) -
2
Test that the packages are installed, by logging in as root and using the following command:
yum list installed | grep <PACKAGE NAME> (e.g. yum list installed gd)
To find the full name of a package, use the grep command (e.g., yum list installed | grep perl). If the package is installed, it should appear on your list. To install or update packages, type in: yum install <PACKAGE NAME> -
3
After you’ve installed php-pear, use the following commands to install HTTP_Request and dependent packages, if necessary:
>pear install HTTP_Request
-
4
To set Network configuration, set a fixed IP address and DNS address for the Prohits server by clicking on System --> Administration --> Network
-
5
Make adjustments for the Trusted services in the iptables firewall. Select: System > Administration > Security Level and Firewall. Checkmark FTP, WWW(HTTP), DNS. Click ‘Other Ports’ ‘Add’ port 3306 for Protocol ‘tcp’ (MYSQL)
-
6
Edit the httpd.conf file (/etc/httpd/conf/httpd.conf), and set the web server to use port 80. Use of other ports may cause problems. Remove the option “Indexes” from document root directory setting (var/www/html), resulting in the following fragment:
<Directory “/var/www/html”>
     Options FollowSymLinks ExecCGI Includes MultiViews
     AllowOverride None
     Order allow,deny
     Allow from all
</Directory>
Find the line that starts with “DirectoryIndex”, and add “index.php” and “index.html”. Change the timeout if you need to process large raw files (200 seconds is long enough to handle a 100 MB raw file).
-
7
Modify the PHP configuration file (/etc/php.ini). The settings should be adjusted as follows:
short_open_tag = On
register_globals = Off
default_socket_timeout=360
memory_limit = 700M
The memory limit may be increased for a large raw file
upload_max_filesize = 700M
post_max_size= 700M
This value may be increased if you want the user to upload a large raw file or TPP results files.
session.auto_start = 0
session.use_cookies = 1
Make sure session directory is writable for apache user (the directory is defined in php.ini)
Session.save_path = “/var/lib/php/session”
session.use_only_cookies = 0
display_errors = On
-
8
Ensure that your php session directory has write permissions for the Apache user, which is defined in the httpd.conf file (the User is “apache” in the following example)
>ll /var/lib/php
>cd /var/lib/php
>chgrp apache session
>chmod g+wrx session
-
9
Restart computer services. In the services configuration, make sure these are “Enabled” and “Running” services: Go to: System > Administration > Server Settings > Services >
network
mysqld
sendmail
httpd
Set up the Mascot server (skip if using different search engines or to install the Lite version)
-
10
Follow the instructions from Matrix Science to install Mascot.
ProHits supports Mascot 2.2/2.3 running on Linux or Windows web servers. -
11
Copy ‘ProhitsMascotParser.pl’ from Prohits/MascotParser/scripts/ to the Mascot /cgi/ folder and make sure that the first line of the file has the correct path to perl.exe in the Mascot server.
Mascot in Windows server#!perl.exeMascot in Linux server#!/usr/bin/perl
Set up the TPP and X!Tandem/GPM server (skip if using different search engines or to install the Lite version)
-
12
Download and install X!Tandem and TPP on the dedicated server as per the instructions.
X!Tandem and TPP should be installed on the same server. ProHits can work with X!Tandem and TPP in either Windows or Linux servers, but it is suggested to use a Windows server for easy installation. -
13
Install ActivePerl and Apache using default installation.
Apache: (IIS web server may not be supported)
http://httpd.apache.org/download.cgi
select version 2.2.22 Win32 Binary without crypto (no mod_ssl) (MSI Installer)
ActivePerl: (Be sure to install v.5.8)
http://www.activestate.com/activeperl/downloads/
select ActivePerl 5.8.9 Windows Installer(MSI)
-
14
Follow the instruction from ProHits source code:
ProHits/install/GPM/install_TPP_GPM.html to setup TPP and X!Tandem.
Set up the SEQUEST server (skip if using different search engines or to install the Lite version)
-
15
ProHits works with SEQUEST (versions v.26 and v.28 were tested) on either a Windows or Linux server (this can be installed on the ProHits server). After installing SEQUEST, follow the instructions from ProHits source code.
Prohits/installProhits_SEQUEST/install_sequest.html to setup SEQUEST for ProHits.
Set up the ProteoWizard raw file converter (skip to install the Lite version)
-
16
Download and install ProteoWizard on a Windows computer running an Apache or IIS web server and ActivePerl.
-
17
Follow the instructions from ProHits source code to install ProteoWizard as the raw file converter.
Prohits /install/RawConverter/install/rawConverter.html
Set up SAINT (optional)
-
18
Download and install SAINT (either on the ProHits server or on a dedicated server; see UNIT 8.15).
-
19
Follow the instructions from ProHits source code to set up SAINT.
Prohits /install/Prohits_SAINT/install_ProhitsSAINT.html
Install ProHits
-
20
Place the ProHits source code in the Apache document root directory on the ProHits server.
-
21
Unzip downloaded ProHits source in the Apache document root directory (/var/www/html).
> tar xvfz Prohits_v2.x_x.tar.gz
-
21
Change permissions (you can identify the Apache User from httpd.conf; The User should be apache or www-data). If the User is apache:
>chown -R apache:apache Prohits
>chmod -R 755 Prohits
-
22
Disable SELinux.
Before running the installation wizard, ensure that SELinux http, ftp and cifs have been opened. You can turn off SELinux (SELINUX=disabled in /etc/selinux/config), if the ProHits server is firewall protected. For more information please read: http://docs.fedoraproject.org/en-US/Fedora/13/html/Security-Enhanced_Linux/> /usr/sbin/getenforce
-
23
Open the installation wizard page from a computer other than ProHits server (do not use http://localhost/Prohits/). Follow the steps from the wizard:
-
24
Run the installation checklist after the wizard installation is completed.
http://prohits_server_address/Prohits/admin_office/check.php
ALTERNATE PROTOCOL 1. INSTALLING PROHITS LITE ON A MAC OS X OR WINDOWS PC VIA A VIRTUAL MACHINE
For research groups with pre-existing data management schemes, or who lack access to Linux-based computer platforms, there has been an unmet need to bypass the “Data Management” module altogether, and simply upload mass spectrometry search results into the ProHits “Analyst” module. We have thus also created a more streamlined version of ProHits, consisting solely of the “Analyst” and “Admin Office” modules. This version of the software suite (“ProHits Lite”) is available in the native Linux format (described at prohitsms.com) or as virtual machine implementations that can be run on Mac OS X or Microsoft Windows computers. ProHits Lite VM comes pre-installed with Cytoscape Web v1.0 for network visualization and analysis, and SAINT v2.3.1, which enables confidence scoring of interaction results. In a first step, the user downloads a virtual machine implementation of ProHits Lite (from prohitsms.com) to their local computer (Mac OS X or Microsoft Windows), along with free virtual machine software (OS X: www.virtualbox.org; Windows: www.vmware.com/products/player/overview.html), and follows the instructions for installation. ProHits Lite VM can then be accessed via a standard web browser from the host computer (Figure 2) and is accompanied by an administrator module to define projects and user permissions.
Figure 2.

Simplest use of the ProHits VM system. A) The ProHits Lite VM appliance is opened via VirtualBox. B) Screenshot of ProHits VM running on Linux; web browser page (Mozilla Firefox) is open. Note the IP address. C) Standard web browser on the host computer (here, Mozilla Firefox on Mac OS X). ProHits Lite VM may be accessed by typing the IP address from panel B into the host computer browser. Other computers on the network can access the VM via the same IP address. Note that the IP address is dynamically generated and only valid for the current session. The VM window should not be closed while ProHits is in use.
Materials
(Mac OS X) A computer running OS X (we tested 10.6.8) with at least 50 GB free disk space.
(Mac OS X) VirtualBox for OS X hosts (freely available from https://www.virtualbox.org/)
(Mac OS X) ProHits Lite VM VirtualBox version (CentOS57_ProHits_VirtualBox): http://prohitsms.com/
(Mac OS X) Unzipping software such as Keka (freely available at http://www.kekaosx.com/en/ )
(Windows PC) A computer running Windows (XP or 7) with at least 50 GB free disk space.
(Windows PC) VMware Player (freely available from http://www.vmware.com/products/player/overview.html)
(Windows PC) ProHits Lite VM for Windows (CentOS57_ProHits_win): http://prohitsms.com/
(Windows PC) Unzipping software such as www.7-zip.org, WinZip or winRAR
(Windows PC; optional) WinSCP (http://winscp.net)
Mass spectrometry search results, generated by Mascot (*.dat), X!Tandem (*.xml) or the Trans-Proteomic Pipeline (PeptideProphet and ProteinProphet *.xml files are both required).
Procedure for installation of ProHits Lite VM on Mac OS X
Install VirtualBox and the ProHits Lite VM for Mac OSX
-
1a
Download VirtualBox for OS X hosts (https://www.virtualbox.org/) and install.
-
2a
Download VM (CentOS57_ProHits_VirtualBox): http://prohitsms.com/
-
3a
Unzip The ProHits VM, e.g. using Keka (http://www.kekaosx.com/en/)
Start VirtualBox and the ProHits Lite VM
-
4a
Launch VirtualBox, then click “New” to generate a new Virtual machine using the following settings: Name: Prohits; Operating System: Linux; Version: Fedora; Memory: 1024 MB (select less than 50% of the system RAM). Use existing hard disk: select “CentOS57_VirtualBox_ProhitsDB.vmdk” from folder “CentOS57_Prohits_VirtualBox_v2.0.1”.
The default network is off. To enable file transfer between the host computer and the VM, you must modify the network preferences. From the VirtualBox “Oracle VM VirtualBox manager”, select Settings→ Network and click “Enable network adapter”. Select “Bridged adaptor” from the drop down menu, and click: OK. -
5a
Select the virtual machine from the window “Oracle VM VirtualBox Manager”, and press “Start”. This will launch the VM (and will take a few minutes). User account: Log in VM CentOS (User: prohits, Password: prohits); root password: prohits
-
6a
Start the VM CentOS web browser (in the VM). Login to the Prohits webpage: http://localhost (User: admin, Password: admin)
Transfer files from the host (OS X) to the guest (VM CentOS) system
-
7a
Ensure that “Enable network adapter” → “Bridged adaptor” has been selected in the virtual machine. Retrieve the current VM IP address, via http://localhost in the VM web browser (the address will be something like 10.100.100.100) or recover it by accessing the Terminal (Terminal is accessed via /accessories) in the VM, and typing the command /sbin/ifconfig. The address will be listed on the second line, following “inet addr”.
ProHits Lite VM can be accessed from any standard web browser on the OS X host. In this configuration, the VM is left on, but runs in the background. The IP address of the virtual machine is dynamic. -
8a
After retrieving the VM IP address and typing it into the selected OS X web browser, enter the ProHits username and password. Browse your local hard drive (or other computers on the network) to retrieve mass spectrometry search results using the “Upload Search Results” function under “Create a New Entry” in the “Analyst” module. See BASIC PROTOCOL 3 for details.
If you power down the VM server, you will automatically stop all processes (including SAINT analysis) and lose all connections.
Procedure for installation on Windows PC
Install VMware player and the ProHits Lite VM for Windows PC
-
1b
Download VMware Player for Windows from http://www.vmware.com/products/player/overview.html and install.
-
2b
Download VM “CentOS-Prohits-win” (minimum 40 GB free space). http://prohitsms.com/Prohits_download/ProhitsSource_Code/CentOS57-Prohits-win-v2.0.1.7z
-
3b
Unzip the software using www.7-zip.org, WinZip or winRAR).
Start VirtualBox and the ProHits Lite VM
-
4b
Launch VMware Player then go to “Open a Virtual Machine”. Select the VMX file from CentOS-Prohits-win folder that was created earlier during decompression.
-
5b
Start the ProHits Lite VM for Windows. User account: Log in VM CentOS (User: prohits, Password: prohits); root password: prohits
-
6b
Start the VM CentOS web browser (in the VM). Login to the Prohits webpage: http://localhost (User: admin, Password: admin)
Transfer files from the host (Windows) to the guest (VM CentOS) system
-
7b
Retrieve the current VM IP address, via http://localhost in the VM web browser (the address will be something like 10.100.100.100) or by accessing the Terminal in the VM, and typing the command /sbin/ifconfig. The address will be listed on the second line, following “inet addr”.
ProHits Lite VM can be accessed from any standard web browser on the Windows host. In this configuration, the VM is left on, but runs in the background. The IP address of the VM is dynamic. -
8b
After retrieving the VM IP address and typing or pasting it into the selected web browser, enter the ProHits username and password. Browse your local hard drive (or other computers on the network) to retrieve the mass spectrometry search results using the “Upload Search Results” function under “Create a New Entry” in the “Analyst” module. See BASIC PROTOCOL 3 for details.
If you power down the VM server, you will automatically stop all processes (including SAINT analysis) and lose all connections. Note: hold down “Ctrl” and “Alt” keys simultaneously to move the mouse from VM CentOS to Windows. Other methods may be used to transfer files between the Windows machine and the VM, for example using WinSCP (http://winscp.net) and SSH Secure. Another option is to access the VM CentOS Download folder (/var/www/Download) from Windows Explorer using SAMBA. In this case, the Samba user is: VM_IP_Address\prohits (e.g. 10.100.100.100\prohits) and the Samba password is “prohits”.
SUPPORT PROTOCOL 1. SETTING UP PROJECTS AND USERS IN THE ADMIN OFFICE MODULE
Since our mass spectrometry facility at the Samuel Lunenfeld Research Institute consists of multiple mass spectrometers (currently, 14 instruments from two different vendors, Thermo and SCIEX), and 50 users from 10 labs run their own samples or access the mass spectrometry data, we also sought to design a system to assign different levels of user permissions for viewing and modifying files. Controlled access to individual pages and different user projects is provided in the administration module (“Admin Office”; Figure 3). The “Admin Office” is also included in ProHits Lite, although with fewer functions enabled. ProHits Lite VM comes preinstalled with an internal protein database based on NCBI RefSeq (Release 50; Pruitt et al., 2012), which is used for mapping purposes.
Figure 3.

Creating Projects and Users in the “Admin Office” module. A) The ProHits administrator can create new Projects in the Project Manager and new Users in the User Manager. On the right is the view of existing Projects; new Projects can be added by selecting the [Add New] tab. B) Navigation window for creating a new Project. Projects can be associated with current or new laboratories. C) The User manager navigation window. New Users can be added, and associated with different levels of privileges. The privileges of existing Users can also be modified on this page.
-
Select the “Admin Office” link from the ProHits home screen (enter your username and password when prompted).
ProHits comes with three pre-loaded demonstration projects; the default user is the administrator (prohits; prohits). You should modify the administrator password, and create new projects and users as necessary. -
To define a new project, select “Project Manager”, then click “Add New”: Define the project and associated laboratory.
Note that in each of the ProHits pages, fields shown in bold are mandatory. -
Select “User Manager” on the left hand menu of the Admin Office to define new users and give them access privileges.
Different levels of access can be associated with different projects. Individual page permissions can also be assigned by the administrator (for example, only those users who have “Admin Office” page permissions will be able to access the Admin Office module). -
If using the full version, set-up parameters for the backup setup from the mass spectrometers and update ProHits internal protein databases using the left menu options in the “Admin Office”.
Note that the Backup setup, Auto Search and Auto Save versions are not available in ProHits Lite, as they relate to the acquisition, storage and database search of mass spectrometry data.
BASIC PROTOCOL 2. TRACKING DATA IN PROHITS: DATA MANAGEMENT MODULE
When creating a system for storing and tracking AP-MS data, we were particularly interested in achieving the following objectives: 1) providing automated transfer of raw files from mass spectrometers to a secure server for long-term storage; 2) automatically initiating database search(es) of the mass spectrometry data, and tracking both search results and search parameters (ensuring MIAPE compliance); 3) annotating affinity purification and sample preparation protocols in a comprehensive manner; 4) providing stable links between the sample description, search results and raw files, such that data can be reanalyzed when required, results reported in a transparent manner, and source files deposited in public repositories. These requirements are achieved within ProHits via two main modules: a “Data Management” module that handles the mass spectrometry files (raw files and searches; this section), and an “Analyst” module, where the user can enter information concerning the biological samples analyzed by MS (Figure 4; the “Analyst” module is also used for the exploration of mass spectrometry data as detailed in Basic Protocol 3). ProHits Lite only contains the “Analyst module”. The Data Management module consists of two mains parts: the “Storage” and “Auto Search” components. The “Storage” section allows the user to monitor the transfer of data from each of the acquisition computers to the ProHits backup system, and allows for searching, browsing and downloading of backed-up files, converting original vendor files to other formats, and manual upload of raw data. The “Auto Search” section allows the user to perform and schedule database search tasks on specified files using user-defined search engines and parameters, to explore the results and to link search results to the experimental information in the Analyst module.
Figure 4.
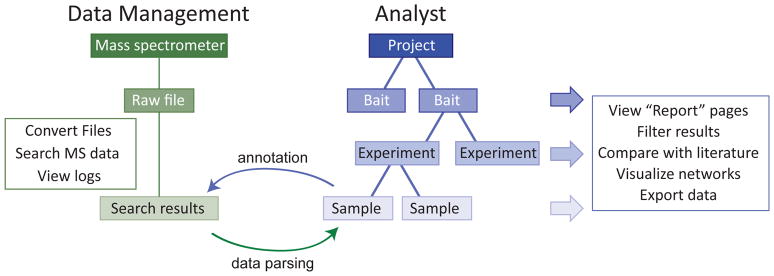
Structure of the two main ProHits modules: the “Data Management” (left) and the “Analyst” module (right).
Materials
Pre-installed ProHits complete version, set-up as in Support Protocol 1
Web access via browser of choice
Navigating through the storage section
-
1
Select the “Data Management” link from the ProHits home screen (enter your username and password when prompted) and click the storage tab.
ProHits manages the backup and storage of data files in an instrument-dependent manner. The left of this screen provides links to all available instruments in the mass spectrometry facility (alternatively, just click on the picture). This page also specifies the location of the database and data storage. The central part of the page details the status of each of the connections: green arrows indicate a functional connection while a broken red arrow denotes a broken connection. -
2
Select one of the mass spectrometers to view the folders on each acquisition computer (Figure 5). Files are automatically transferred from the acquisition computer as defined in the Admin Office (e.g. daily); alternatively, they can be backed up manually by pressing the “Backup File Now” button at the top of the screen. To import raw files from other sources, click “Upload Raw Files” and follow the instructions.
The file backup organization mirrors the set-up on each acquisition computer (the computer linked to the MS instrument; subfolders are allowed on the acquisition computer). On this page, the folders associated with this instrument are listed (along with a unique identifier assigned by ProHits). Folders are associated with individual “Analyst” projects defined in the Admin Office. -
3
Select a folder by clicking the “folder” icon in the Options column. This lists all files within the folder. The Search Task column allows you to navigate to the search results page(s) associated with individual files. Selecting the “download” icon will download the files to your local computer.
In addition to the files located on the acquisition computer, the selected folder will also contain any files that have been converted from the original raw file to other formats. ProHits can convert raw files as part of the Auto Search pipeline using the ProteoWizard converter tools (Kessner et al., 2008); alternatively, files can easily be converted on this page. Note that this page offers the option to merge *.mgf files prior to searching with Mascot (this option is used by some researchers, e.g. to combine all samples from an SDS-PAGE lane); merging may also be performed using TPP as described in step 12. -
4
Click on the chain link icon to create a manual link between a Sample defined in the Analyst module and a raw mass spectrometry file: this opens up a new window. After selecting the Bait, Experiment and Sample to link the file to, close the window. The chain link icon should now be yellow, indicating a successful manual link.
Links can also be created automatically by first defining Bait, Experiment and Sample in the Analyst module (BASIC PROTOCOL 3, step 5A), and following a simple naming convention, for both the folder on the acquisition computer, and the raw file name. Automatically generated links are displayed by green chain links. -
5
(optional) Click on “Fetch Raw File” from the left menu to retrieve files based on names, instruments and/or acquisition date.
-
6
(optional) Click on “Raw file status” from the left menu to view the number of files or file size associated with each instrument, organized by date. This option facilitates the production of activity reports e.g. for a core facility.
Figure 5.

Storage tab of the “Data Management” module. A) Data are organized first by mass spectrometer, then by folders and subfolders. Scheduled file backup is set by the administrator; external raw files can be uploaded to a specific instrument/ folder. B) Raw files can be downloaded, converted, and linked to samples defined in the Analyst module.
Using the Auto Search section in Data Management
-
7
Select the “Auto Search” tab.
This view displays all search engines and other tools that have been linked to your ProHits database in the top portion of the page. As with the link to different mass spectrometers in the Storage area, successful links to search engines are indicated by green arrows and broken links by a broken orange arrow. The bottom part of the page allows you to access individual instruments for search purposes (organization is by mass spectrometer). -
8
Click on the desired mass spectrometer.
A list of all of the search tasks that were performed for this instrument is provided (note that a given user may only see the tasks associated with a project to which he/she has permissions). A given task may be applied to several files not necessarily located within the same subfolder or in the same format. We will return to this list later, after we have created a New Task. -
9
Select “New Task” from the left menu. This opens up a new page (Figure 6). Enter a Task Name of your choice, select the search engine(s) and parameter set to be utilized. If needed, an automatic conversion of raw file formats used by the search engine(s) can be applied. The search can be initiated manually (“Start Now”), or automatically as files are added every X hours.
You have an option of automatically running the TPP statistical software tools on the search results. If you choose to do so, select the “Run TPP” box. Note that you can also run the TPP tools after you get the search results. Running TPP manually post-acquisition is a more flexible option, because it allows you to combine several files into a single TPP analysis. -
10
Add files to be searched by clicking the “Add Files” button on the bottom right. Navigate through the desired folders and select all files to be added to the search. These may be associated with different folders. Press “Run Task” to initiate the search.
For some high-throughput projects, users may wish to automatically initiate searches on every new file added to the folder(s) that are initially selected for the search. Before you can select to automatically add files and search them, you must point to at least one file in a folder manually, as indicated above. By selecting the “Start every X hours” (left hand side), and “Automatically Add Files” (right side) options, every file of the selected format subsequently acquired within the same folder(s) or subfolder(s) will be automatically searched using the same parameters.Tip: instead of creating a new search task for each file that you analyze using the same search parameters, use the “modify” option at the bottom of the page: this will group all of your searches within the same search task folder, making it easier to retrieve, and will ensure that the same search parameters are used for each file. -
11
Once a task is initiated, search parameters are locked. To see these parameters, select “Search Tasks” from the left menu and click on the “Task Details” icon (Figure 7).
Locking the parameters prevents inadvertently modifying them in the middle of a project, and helps to facilitate MIAPE compliance (Taylor et al., 2007). Status information can be obtained in “Search Task” view. While green indicates a file being actively searched, a blue color indicates that a sample is currently in the queue. Yellow highlights an error with the search. No other searches can be initiated until this problem is resolved, either through successful running of the problematic search, or by stopping the task. IMPORTANT: If an error is encountered while tasks are in the queue, one of these tasks must be manually re-started (the other Tasks will then be searched). -
12
To view the results of a search, click on the “Result detail” icon from the “Search Task” view. This opens up a new page (Figure 8). Search results are displayed at the bottom of the page. The blue link will connect to the search engine results page. This page also provides you with the option of analyzing your search results using the TPP.
There are cases where you may wish to merge files prior to running the TPP (examples include fractionated or gel-based samples). This is a simple process in ProHits. The two requirements are that the searches be performed using the same search engine (Mascot and X!Tandem files cannot be combined) and that the results are located within the same Search Task folder. Select the “Merge” option and the files to be combined. Selecting the “Merge” option will create a new entry at the bottom of the page. The TPP can be run on this entry in the same fashion as on individual files, by selecting the desired parameters and pressing “Run TPP”. -
13
To transfer search results to the ProHits Analyst module, ensure that the file has been linked (see step 4), then click “Parse Hits to ProHits Database”, select the desired parameters and files to be transferred, and press “Run”.
You can transfer (parse) results from the search engines (X!Tandem/GPM or Mascot), from the TPP or both. Parameters for the parsing cut-off for Mascot and X!Tandem/GPM search engines may also be specified. For the TPP, all hits with a probability greater than the cut-off selected by the administrator in the ProHits configuration file (we use P > 0.05) are automatically parsed. A green check mark appears once the file has been successfully parsed. In the event that you decide to link or parse different file(s) to the same Analyst entry, the parsed files or the link may be removed: alongside the tick box, a square containing a red X can be selected if you wish to remove the hits from the Analyst module. Note that you can also unlink a sample by clicking on the yellow link icon and selecting “remove link”.
Figure 6.
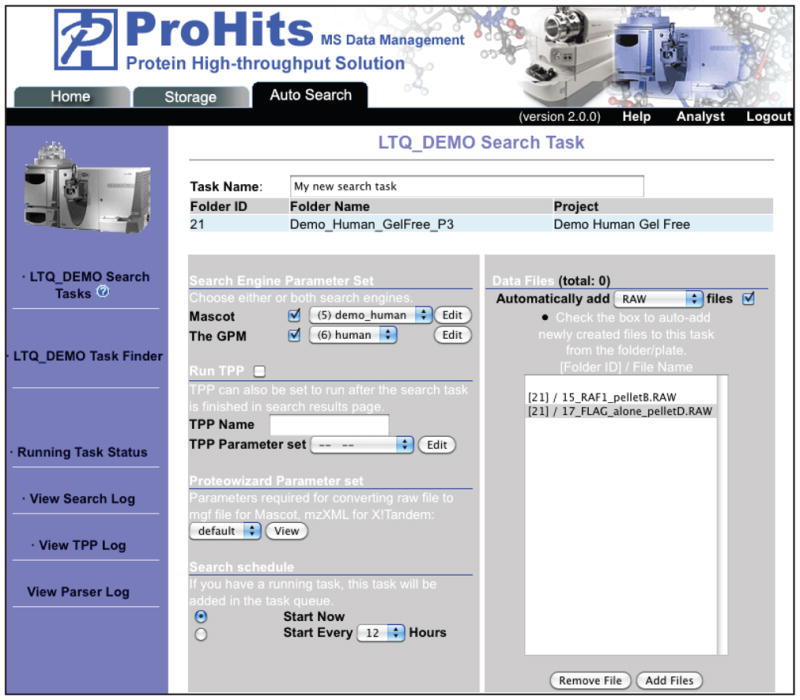
Starting a new search tasks in the Data Management module of ProHits. Screenshot of the “Auto Search” tab.
Figure 7.
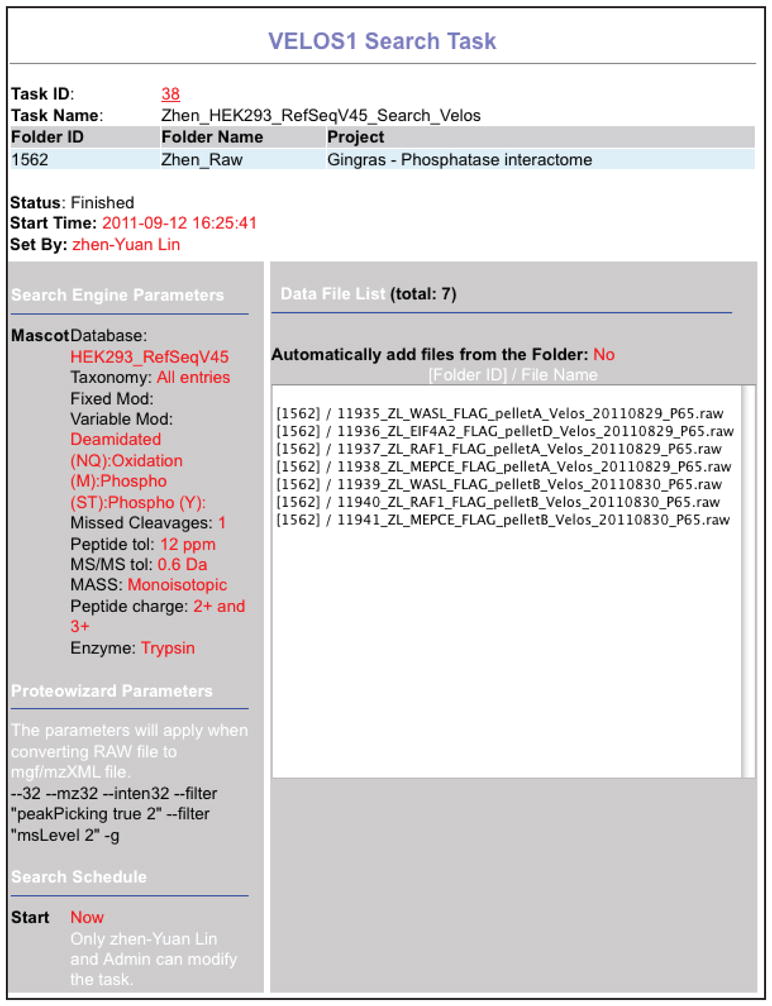
Selecting parameters and samples for “Search Task”. Screenshot from a completed search task after selected parameters are locked in.
Figure 8.

Search results page. Chain link icons reflect association to a “Sample” defined in the Analyst module. Search results can be transferred to the Analyst module by selecting “Parse Hits to ProHits Analyst database” and selecting parameters and files when prompted.
BASIC PROTOCOL 3. ANALYZING AP-MS DATA: PROHITS ANALYST MODULE
In addition to tracking AP-MS data to enable reanalysis and transparent reporting, we were also interested in building an intuitive graphical user interface that would enable any user to examine their own results, even with minimal training in mass spectrometry. We also wanted users to be able to examine multiple AP-MS datasets in parallel, and to incorporate quantitative information in these visual aids. Functions for filtering search results, and comparison with known interactions from the literature were important to include, and visualization of data using network graphs was a must. With this in mind, we designed the ProHits “Analyst” module in a hierarchical manner, in which projects are first defined (this could be, for example, all analyses performed by a single person, or all purifications associated with a particular set of experiments). Within a project, a user is prompted to define a bait (the protein that is purified), an experiment and a sample. Each raw file and search result is assigned to a unique sample, so that tracking is consistent (Figure 4). As detailed in this section, the Analyst module enables the user to explore, analyze, visualize and export data. Integration with open source software and web resources (NCBI, BioGRID, Cytoscape, SAINT) enhances the functionality of the system.
Materials
Pre-installed ProHits full version or Lite version, set-up as in support protocol 1
Web access via browser of choice
-
1
Select the “Analyst” link from the ProHits home screen (enter your username and password when prompted).
-
2
Select the project that you wish to access.
ProHits comes with three pre-loaded demonstration projects; new projects can be created in the Admin Office module (Support Protocol 1). Only projects available to the user are displayed; user permissions (read, insert, modify and delete) are indicated. If necessary, these permissions can be modified by the administrator in the Admin Office module. -
3
To create a new entry for a mass spectrometry sample (here acquired in a “gel-free” manner, meaning that the affinity purified material is directly analyzed by LC-MS), select “Add Gel-free Sample” under the “Create New Entry” menu on the left (Figure 9).
ProHits is organized in a hierarchical manner, in which the gene coding for the protein of interest (or bait) is first specified by the user. Once a particular bait is created, any number of experiments resulting from the purification of the same bait may be added. Similarly, any number of samples can be linked to a given experiment. Mass spectrometry search results are assigned to individual samples, and unique identifiers are assigned by ProHits to each of the levels (bait, experiment and sample). Though ProHits was initially designed (and still supports) projects based on the use of SDS-PAGE gel purification, most of our current users employ a gel-free pipeline. -
3
Create a “New Bait” by clicking on the blue arrow. This opens a new page. To retrieve all information about a protein, type its gene name and species: ProHits will query its internal database (NCBI RefSeq; see UNIT 1.3) and retrieve the information to fill all required information. Add additional details or modify information as appropriate and press “Next”.
All fields in bold are mandatory in ProHits; however, the system does not perform a data validation check. If a protein is not in the RefSeq database for the selected species (e.g. a protein such as luciferase, used as a negative control), information can be manually entered in every field in bold, to bypass RefSeq mapping. -
3
Annotate the “New Experiment” by selecting appropriate protocols for each of the four major steps (biological material, affinity purification, peptide preparation, LC-MS) using the drop-down menus. Edit the “Controlled Vocabulary” (CV) terms associated with the experiment. Add free text and images as required and press “Next”.
Protocols and controlled vocabulary (CV) are tailored for individual projects by the user and are defined in “Manage Protocols and Lists” – see SUPPORT PROTOCOL 3. We recommend including very detailed protocols, and the use of the free text box to annotate any deviation from the protocol, or to refer to specific outside notes (e.g. page numbers in a lab notebook). -
4
Press “Add New Sample” to add a sample to the experiment. You should create as many samples as you will link mass spectrometry files. Once you save a Sample, the name that should be given to a raw mass spectrometry file for the “Auto Link” function will appear (this option only applies to users of the complete ProHits system).
Samples derived from the same experiment can consist, for example, of technical replicates, or fractions derived from a single purification, allowing for the analysis of data generated using gel-based or gel-free approaches. It is up to the user to decide upon the structure of the database using the four levels (Project, Bait, Experiment, Sample) available within ProHits. A decision regarding how to enter, for example, biological and technical replicates in the system is important at the onset of a project. -
5A
(Alternative step for users of the complete system). Transfer (parse) mass spectrometry results to the Samples defined in the Analyst module. To do so, return to your “Search Task” in the Data Management module, click on “Parse Hits to Analyst database”, and select the desired options and files to transfer. Return to the Analyst module.
Data files must be linked to a sample in the Analyst module for the transfer to be possible. If the mass spectrometry data were acquired following the naming convention for the Auto Link, files will be automatically linked (the chain icon will be green). If this is not the case, files can be manually linked to a sample by clicking on the broken white chain link icon: this will open a navigation pane, allowing you to select the desired sample. A manually created link is indicated with a yellow chain icon. -
5B
(Alternative step for users of the ProHits Lite version). Upload Search results to individual samples by selecting “Upload Search Results” under the “Create a New Entry” menu, and upload your data when prompted (Figure 10).
ProHits lite VM directly supports search results files generated by Mascot (Perkins et al., 1999), X!Tandem (Craig and Beavis, 2004), SEQUEST (Eng et al., 1994). Other search engines are supported via the the PeptideProphet (Keller et al., 2002) and ProteinProphet (Nesvizhskii et al., 2003) outputs of the Trans-Proteomic Pipeline. -
6
Explore the mass spectrometry results transferred to the Analyst module individually, by selecting, e.g. “Report by Sample” under the “Individual Reports” menu item. Clicking this link opens up a list of all Samples analyzed in the project (Figure 11). Click on the color bar in the experimental status column to expand the information for each sample. View Sample details by selecting the “Page” icon in the Options column. Add annotation by clicking on the “note bubble” icon in the Option column. Lastly, select the “graph” icon to view the mass spectrometry search results (Figure 12); this will open the raw, unfiltered, list of proteins identified in the sample (bottom). Use tabs to navigate through different search engine results when available. Use the hyperlinks to see information for each of the identified proteins. Exporting to tab-delimited text or to Cytoscape is accessed via links at the top right of the page.
Individual Reports can also be viewed at the Bait and Experiment level. ProHits maintains the hierarchical organization as defined by the user and does not perform any operation (e.g. summing counts, etc.) in the Individual Reports. Instead, selecting the graph icon at the Bait or Experiment level results in listing search results sequentially (sample by sample) in the report: entries detected in more than one sample are bolded (mousing over reveals all samples in which the given entry was detected). -
7
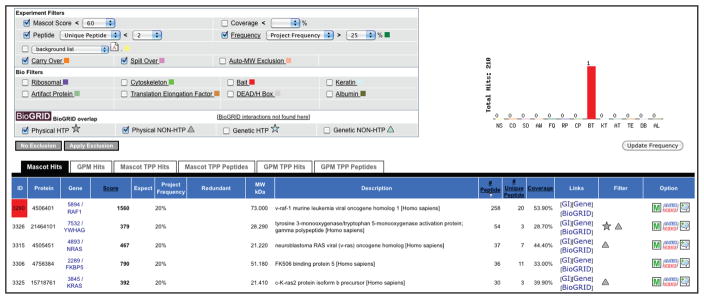
To perform basic filtering of the data, select “Show Filters” and apply desired filter sets (Figure 13). Overlap with the literature curation data in the BioGRID database can also be listed (icons appear in the “Filter” column in the table).
We recommend using only the “Experiment Filters” for data analysis for publication; “Bio Filters” are defined in the Admin Office and should be used with caution, as they are somewhat subjective. “Frequency” is defined as the occurrence of a given protein in all samples from the selected project (note that this is not automatically calculated each time a sample is added to the database; instead, press the “Update Frequency” button when required). “Background Lists” can be created and maintained either here (by clicking the “page” icon) or in the “Manage Protocols and Lists” menu on the left. -
8
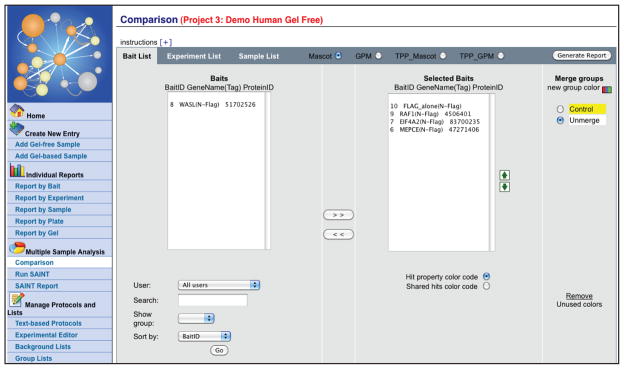
Database search results from multiple samples can be viewed at the same time. To access this option, select “Multiple Sample Analysis” → “Comparison” from the Analyst left hand menu (Figure 14). Select the baits, experiments or samples to compare, then press “Generate Report”.
Here, the default operation for the display of multiple samples is to report the maximal value (e.g. spectral counts, unique number of peptides or score from the search engine) associated with the detection of a given protein across all samples associated with the Bait or Experiment. Samples can also be merged manually (using the “Merge Group” option), which again results in the display of the maximal value associated with the given protein across the merged samples. When selecting negative control runs to be merged, these will be highlighted in yellow on the next pages, and displayed first by default. -
9
ProHits Comparison generates a list of unfiltered interactions (columns will be ordered from left to right in the same order as the samples were selected on the previous screen; Figure 15). Visualization of quantitative data (from light to dark) is mapped to different parameters, including spectral counts (default), number of unique peptides, scores from the search engine(s) or protein coverage. Mouseover any cell in the table to see available information. As with individual reports, hyperlinks to outside databases are available. Select [Click to apply filters] to filter the search results (as in step 7).
-
10
Visualize the data in Cytoscape Web by selecting the “Cytoscape” icon (Figure 16). Export text files of the data by selecting one of the available export functions. To export a customized version of the data, click [Export(select)], select desired options and press “Generate Report”.
Note that selecting “Peptide Modifications” in the [Export(select)] enables you to quickly generate lists, e.g., of the modified peptides. Cytoscape web v1.0 (Lopes et al., 2010) is embedded in ProHits Lite VM. -
11
Select the “peptide comparison” icon to view peptides identified for each protein across all samples. This will open up a new window in which the peptides are sorted based on scores from the search engine(s) (Figure 17).
Export options are also available here; they differ from the export functions in the Sample Comparison page in that they return data for the specified protein only. -
12
Select “Run SAINT” to perform statistical analysis of selected AP-MS samples (UNIT 8.15 for details).
ProHits now fully supports SAINT. We have built a simple graphical user interface that enables the user to select files to analyze, choose negative control samples, specify various SAINT options, and run SAINT (Figure 18; also see UNIT 8.15). Selected files and options are tracked by ProHits and available for later reporting. The user may then either download the SAINT results directly (as a tab-delimited text file), or further explore them using the ProHits “SAINT Comparison” viewer. As in the standard ProHits Comparison page (steps 9–10), data are presented in a matrix format in which the data from an individual bait, experiment or sample (in this case SAINT baits) are presented in columns, and putative interacting partners are shown in rows, associated with links to the NCBI and BioGRID databases (Maglott et al., 2011; Stark et al., 2011). Quantitative information (SAINT scores, spectral counts, etc.) is presented with color scales in each of the cells. Within the “SAINT Comparison” viewer the user can select desired SAINT cutoff filters (either the Avg SAINT or Max SAINT value), and filter data based on the number of spectral counts detected, replicates performed, frequency of detection across the database, etc. The user can also manually remove entries (which are greyed out in the matrix form), evaluate the overlap between the observed interactions and those reported in BioGRID (Stark et al., 2011), visualize their network in Cytoscape (Lopes et al., 2010), and then download filtered interaction lists. Importantly, downloaded files prominently list all filters applied to the data, and specify which proteins were manually removed from the analysis (Figure 2C). -
13
Prepare data for deposition in IMEx consortium databases by selecting the Export function “Export PSI” from the SAINT Report page. Alternatively, select “Export Function” under “Other Tools”, and prepare data for deposition in BioGRID (in the MITAB format) or IMEx databases (in the PSI-MI XML v2.5 format). Enter information when prompted.
Note that while ProHits can assist with the preparation of data for deposition in IMEx databases and BioGRID (Kerrien et al., 2012; Licata et al., 2012; Orchard et al., 2010; Orchard et al., 2007; Stark et al., 2011), we still recommend that users test their XML files using validation tools available from the different databases (e.g. http://www.ebi.ac.uk/intact/validator/). In addition, we recommend that the user work closely with database curators to ensure proper annotation of the data.
Figure 9.

Creating Baits, Experiments and Samples. A) In the ProHits Analyst module, select a Project, and then select “Add Gel-free Sample” under the “Create New Entry” category. This will prompt you to create an entry from an existing or new Bait. Selecting “new bait” will open a new dialogue box (shown here). Minimally, you must specify the bait Gene Symbol and Species; pressing the “Get Protein Info” button will prompt ProHits to retrieve the amino acid sequence from its internal database (right inset). B) Once a “Bait” is created, “Experiments” can be added. Protocols can be associated with each Experiment, in addition to controlled vocabularies and free-text annotation. C) Samples can be added and annotated. Multiple Samples may be associated with the same Experiment, and multiple Experiments may be associated with the same Bait.
Figure 10.

Uploading search results. A) Once a Bait, Experiment and Sample have been created, the “Upload Search Results” function can be used to import search results from the Mascot, X!Tandem or SEQUEST search engines, or from the Trans-Proteomic Pipeline (TPP). First, select the desired Sample and click on the “Upload” button in the “Options” column. This opens a new window where the file type to upload can be specified, upon which a navigation pane opens. Select the file to be uploaded and the desired filters, and press “Submit”. B) Once search results have been uploaded, the information will be recorded on the upload page. Pressing the graph icon in the “Options” column will open the Sample Report page.
Figure 11.
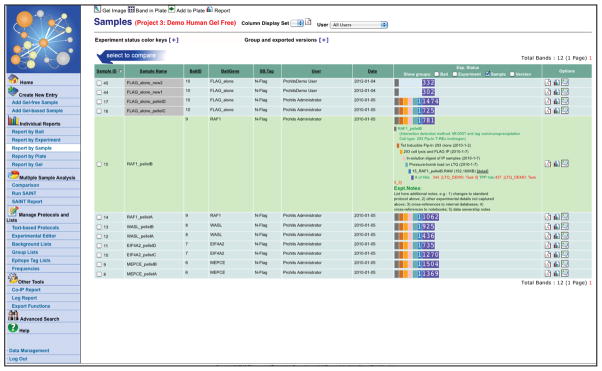
Screenshot of the “Report by Sample” entry page in the Analyst module. All Samples analyzed are displayed: clicking on the multicolored bar expands Experimental details and the linked mass spectrometry files.
Figure 12.

Screenshot of “Sample Report Hits” page. Unfiltered hits from the search engine Mascot are displayed.
Figure 13.
Screenshot of the search results after applying basic filter sets. The overlap of the data with known interactions in the BioGRID database is indicated.
Figure 14.
Screenshot of entry page for the Multiple Sample Analysis “Comparison” page of ProHits. Baits, Experiments or Samples can be selected for combined visualization and analysis.
Figure 15.

Screenshot of filtered data from the ProHits “Comparison” page. Baits are shown in columns, preys (hits) in rows. The color-coding maps to quantitative parameters (here number of unique peptides). Links to external databases are provided. Shapes in the individual cells indicate interactions reported in the BioGRID database.
Figure 16.

Use of Cytoscape Web to visualize interactions detected by AP-MS directly from ProHits VM. A) A Cytoscape Web view of the data (filtered or unfiltered) can be accessed on any of the report pages (individual reports, comparison view or SAINT report) by pressing the “Cytoscape” icon. Quantitative information embedded in the mass spectrometry file is transferred to Cytoscape Web, either as a node or an edge attribute (examples of the transferred information are listed). B) Example of a report page where the Cytoscape Web information can be accessed. C) Default view of the Cytoscape Web network from panel B.
Figure 17.

Exporting peptides. A) In the ProHits Peptide Comparison pages (accessed from the protein-level Comparison page), new functions for exporting peptide information are available. These are identical to the protein-level export function with the exception that only a single protein is analyzed. B) Peptide-level information available in the [Export(select)] function of ProHits. Note that this export function is available for all proteins in the datasets when looking at the protein comparison page, or for a selected protein, as shown here. C) Sample Report: Here, only the deamidated peptides from the protein PRMT5 will be exported to a .csv or .tsv file.
Figure 18.

Using ProHits to run SAINT: data example. A) ProHits records all SAINT options, and the list of the samples and controls used to run SAINT, for reporting purposes. B) Screenshot of the SAINT Comparison page of ProHits. A number of display options and filters are available. Manually excluded hits are left on the list, but are greyed out. C) Screenshot of the Excel document resulting from the Export(table) option in panel B. Note that all filters used are detailed and that the proteins that were manually removed from the list are clearly listed (by Genbank Identifier) for increased transparency in reporting.
SUPPORT PROTOCOL 3. MANAGING PROTOCOLS AND LISTS IN THE ANALYST MODULE
Proper annotation of experimental detail is essential to ensure that experiments can be reproduced. In the Analyst module, this annotation is provided via the selection of pre-entered detailed protocols describing each of the experimental steps, administrator-defined control vocabularies that enable data organization and facilitate deposition in public repositories, and standardized description of the epitope-tag used for the purification. These vocabularies and protocols are defined in the section of the Analyst module called “Manage Protocols and Lists”. In addition to these standardized protocols, the user is encouraged to provide additional notes at the bait, experiment and sample level for each experiment. In addition to maintaining protocols, the section “Managing Protocols and Lists” enables the user to define specific background or frequencies lists to enable rapid data filtering, and to provide “group” annotation of each bait, experiment and sample, enabling further structuring of the data. One specific group, “Export version” enables the user to lock-in datasets prior to publication or distribution of the data.
-
Select “Text-based Protocols” from the “Manage Protocols and Lists” menu in Analyst (Figure 19). Use the navigation tools to view existing protocols within a project. Choose “Add New” to define a new protocol or “Import from other projects” to import protocols already defined in another project.
Protocols are added in the Experimental Description page via drop-down menus. Protocols are written in a modular manner, separating the AP-MS procedure into four steps. We have found it very important to provide as much experimental detail as possible at this step. This is particularly useful for projects in which several alternative protocols may be used, or when projects extend beyond the tenure of the individual who conducted the experiments. Importing from other projects requires that the user has sufficient access permissions. -
Select “Experimental Editor” to create Controlled Vocabularies (CV) to be used for your project. First create a category for the CV and then associate any number of values to this category.
We recommend whenever possible to use standardized CVs (for example we use PSI MI 2.5 terms whenever possible – see the preloaded Demo Human Gel-Free project for examples of CVs). -
Select “Background List” to create and manage lists of frequent contaminants in your experimental system.
Such lists can be created, for example, by compiling a number of negative control runs using the Comparison Page (Basic Protocol 3, Steps 8–9), exporting the data as a matrix, and selecting the most likely contaminants, e.g. based on their frequency of detection across negative control runs or their abundance in such runs. Note that while we strongly recommend that quantitative mass spectrometry data may be used for final filtering (e.g. with SAINT), simple filtering (e.g. using these “Background Lists”) enables rapid exploration of the data. -
Select “Group Lists” to create Bait, Experiment and Sample level annotation “tags” that can be used to organize the data. Once created, the “Group” annotation can be added at the level of the bait, experiment or sample by clicking on the “Note bubble” icon in the Option column (Individual Reports list view). Assigned groups may be used to filter Baits, Experiments or Samples by expanding the “Group and exported versions” link at the top of the page in the “Individual Reports” list view.
ProHits comes preinstalled with some “Sample Groups” which are used here to annotate the quality of the mass spectrometric analysis (this is a Sample level property). An Experiment level property could include, for example, any protocol specification (e.g. treatment of the sample with a drug). A Bait level property could include the type of affinity tag used, or the owner of the bait, etc. The “Export Version” grouping enables the user to stamp a dataset to be exported, analyzed or published. -
Select “Epitope Tag Lists” to maintain a list of the epitopes added to bait proteins. Select “Add New” to define a new epitope tag: this will open a new window and prompt a link to an ontology look-up service (OLS).
We recommend that whenever possible, each epitope tag added be mapped to the OLS (http://www.ebi.ac.uk/ontology-lookup) provided as a spin off of the PRIDE project (Csordas et al., 2012): this will facilitate compliance for data deposition in public repositories. New ontologies can be requested from the ontology team by email. -
Select “Frequencies” to create a frequency list based on user selected entries (Figure 20).
“Frequencies” is used by ProHits to define the proportion of samples in which a specific protein is identified; this is useful as a quick background filter. While ProHits tracks frequencies across an entire project by default, it is sometimes useful to have frequencies calculated from a subset of the samples (for example, when different cell lines or epitope tags are used within the same project). This function enables a user to define groups of samples used for frequency calculation.
Figure 19.

Managing Protocols. Experimental protocols can be added manually, imported from other projects, and exported to text.
Figure 20.

The function “Frequencies” enables the creation of user-specified frequency reports, and the export of project-wide or group-wide frequencies. Here the project-wide frequency set for the TPP results is displayed; this list of proteins can be downloaded.
COMMENTARY
Background Information
We have made a conscious decision to integrate open source tools within ProHits in order to provide a complete and free software solution for AP-MS analysis. In this, we were very fortunate to have access to excellent freely-available resources, including raw file converters from the ProteoWizard project (Kessner et al., 2008), the X!Tandem database search engine from the Global Proteome Machine (Craig and Beavis, 2004), and the PeptideProphet (Keller et al., 2002) and ProteinProphet (Nesvizhskii et al., 2003) modules of the Trans-Proteomic Pipeline (TPP). We have also integrated web-based database resources such as NCBI Entrez Gene and NCBI Protein (Pruitt et al., 2012), as well as the BioGRID interaction database (Stark et al., 2011). Network-based visualization is provided via Cytoscape Web (Lopes et al., 2010), and statistical analysis of the interaction data is performed using SAINT (Choi et al., 2011). As new tools are developed by the active open source community, we will continue to build them into ProHits, to provide additional functionality.
With regards to reporting AP-MS data, a major advantage of a structured system such as the full ProHits suite is that all parameters related to the mass spectrometric identification of peptides and proteins are tracked, enabling easier compliance with MIAPE standards. It is important to note, however, that since the ProHits Lite system does not store raw files or search parameter information, MIAPE compliance cannot be ensured by the system, and the user will need to track additional information (ProHits facilitates such tracking). Tracking of controlled vocabularies and other important information for submission of AP-MS data to protein interaction databases (that comply with the MIMIx guidelines; Orchard et al., 2007) is facilitated in both the complete and the “lite” system.
Critical Parameters and Troubleshooting
Like any other tool, ProHits is only as good as the researchers that use it. For example, failure to properly add experimental details in the “Analyst” module will reduce the usefulness of the data in the long-term, especially in cases where several protocols are used concurrently in the laboratory. Proper naming of raw files across multiple experiments, and clear and consistent use of the different structural levels of the database are important to obtain a well-organized system and to enable efficient tracking and reanalysis of the data. Lastly, we have kept the architecture of the system fairly open to accommodate different experimental pipelines: as such, ProHits is research grade software, and not intended for clinical research. Similarly, we have built ProHits to be used at a research institution behind a firewall (our users access the system remotely via VPN access), and therefore, have not built in the level of security that would be necessary for a publicly-accessed web server.
Anticipated Results
While setting up the complete ProHits infrastructure requires both hardware and some programming skills, it can improve productivity by enabling transparent and robust tracking of both the mass spectrometry data and the experimental conditions. Using the ProHits Lite version permits one to couple experimental annotation with mass spectrometry search results. Both systems facilitate visualization of the search results data, basic filtering of the AP-MS contaminants and scoring of the interactions via SAINT. Lastly, while we have developed ProHits primarily as a solution for interaction proteomics, the system can be easily adapted to other workflows, and several research groups are building new modules to expand the capabilities of ProHits.
Acknowledgments
We wish to thank all the members of our laboratories, Steve Tate and the ProHits user community that have provided input to the software, and developers of the open source software which we are embedding within ProHits. We thank Michelle Kean and James Knight for critical reading of the manuscript. This work was funded by grants from the Canadian Institutes of Health Research to BR (MOP-81268), MT (MOP-12246) and ACG (MOP-84314), the National Institutes of Health (AN and ACG; 5R01GM94231; MT 5R01RR024031) and the National University of Singapore to HC. BR, MT and ACG are the Canada Research Chairs in Proteomics and Molecular Medicine, Systems and Synthetic Biology, and Functional Proteomics, respectively. ACG is the Lea Reichmann Chair in Cancer Proteomics. TS is supported by a CIHR studentship; JPL is supported by a postdoctoral fellowship from the National Science and Engineering Research Council of Canada.
Footnotes
INTERNET RESOURCES http://prohitsms.com/Prohits_download/list.php (ProHits source code)
http://saint-apms.sourceforge.net/Main.html (SAINT source code)
http://www.cytoscape.org/ (reference for the complete Cytoscape project)
http://cytoscapeweb.cytoscape.org/ (Cytoscape Web source code)
http://thebiogrid.org/ (BioGRID website for interactions)
http://proteowizard.sourceforge.net/ (source code for the ProteoWizard project; converters are used in ProHits)
http://tools.proteomecenter.org/wiki/index.php?title=Software:TPP (Trans Proteomic Pipeline project)
http://www.thegpm.org/ (X!Tandem open source search engine)
http://www.ncbi.nlm.nih.gov/RefSeq/ (NCBI RefSeq project)
LITERATURE CITED
- Breitkreutz A, Choi H, Sharom JR, Boucher L, Neduva V, Larsen B, Lin ZY, Breitkreutz BJ, Stark C, Liu G, Ahn J, Dewar-Darch D, Reguly T, Tang X, Almeida R, Qin ZS, Pawson T, Gingras AC, Nesvizhskii AI, Tyers M. A global protein kinase and phosphatase interaction network in yeast. Science. 2010;328:1043–1046. doi: 10.1126/science.1176495. [DOI] [PMC free article] [PubMed] [Google Scholar]
- Choi H, Larsen B, Lin ZY, Breitkreutz A, Mellacheruvu D, Fermin D, Qin ZS, Tyers M, Gingras AC, Nesvizhskii AI. SAINT: probabilistic scoring of affinity purification-mass spectrometry data. Nat Methods. 2011;8:70–73. doi: 10.1038/nmeth.1541. [DOI] [PMC free article] [PubMed] [Google Scholar]
- Craig R, Beavis RC. TANDEM: matching proteins with tandem mass spectra. Bioinformatics. 2004;20:1466–1467. doi: 10.1093/bioinformatics/bth092. [DOI] [PubMed] [Google Scholar]
- Csordas A, Ovelleiro D, Wang R, Foster JM, Rios D, Vizcaino JA, Hermjakob H. PRIDE: Quality control in a proteomics data repository. Database (Oxford) 2012;2012:bas004. doi: 10.1093/database/bas004. [DOI] [PMC free article] [PubMed] [Google Scholar]
- Deutsch EW, Mendoza L, Shteynberg D, Farrah T, Lam H, Tasman N, Sun Z, Nilsson E, Pratt B, Prazen B, Eng JK, Martin DB, Nesvizhskii AI, Aebersold R. A guided tour of the Trans-Proteomic Pipeline. Proteomics. 2010;10:1150–1159. doi: 10.1002/pmic.200900375. [DOI] [PMC free article] [PubMed] [Google Scholar]
- Eng JK, McCormack AL, Yates JR. An approach to correlate tandem mass spectral data of peptides with amino acid sequences in a protein database. Journal of The American Society for Mass Spectrometry. 1994;5:976–989. doi: 10.1016/1044-0305(94)80016-2. [DOI] [PubMed] [Google Scholar]
- Gavin AC, Maeda K, Kuhner S. Recent advances in charting protein-protein interaction: mass spectrometry-based approaches. Curr Opin Biotechnol. 2011;22:42–49. doi: 10.1016/j.copbio.2010.09.007. [DOI] [PubMed] [Google Scholar]
- Gingras AC, Gstaiger M, Raught B, Aebersold R. Analysis of protein complexes using mass spectrometry. Nat Rev Mol Cell Biol. 2007;8:645–654. doi: 10.1038/nrm2208. [DOI] [PubMed] [Google Scholar]
- Keller A, Nesvizhskii AI, Kolker E, Aebersold R. Empirical statistical model to estimate the accuracy of peptide identifications made by MS/MS and database search. Anal Chem. 2002;74:5383–5392. doi: 10.1021/ac025747h. [DOI] [PubMed] [Google Scholar]
- Kerrien S, Aranda B, Breuza L, Bridge A, Broackes-Carter F, Chen C, Duesbury M, Dumousseau M, Feuermann M, Hinz U, Jandrasits C, Jimenez RC, Khadake J, Mahadevan U, Masson P, Pedruzzi I, Pfeiffenberger E, Porras P, Raghunath A, Roechert B, Orchard S, Hermjakob H. The IntAct molecular interaction database in 2012. Nucleic Acids Res. 2012;40:D841–846. doi: 10.1093/nar/gkr1088. [DOI] [PMC free article] [PubMed] [Google Scholar]
- Kessner D, Chambers M, Burke R, Agus D, Mallick P. ProteoWizard: open source software for rapid proteomics tools development. Bioinformatics. 2008;24:2534–2536. doi: 10.1093/bioinformatics/btn323. [DOI] [PMC free article] [PubMed] [Google Scholar]
- Licata L, Briganti L, Peluso D, Perfetto L, Iannuccelli M, Galeota E, Sacco F, Palma A, Nardozza AP, Santonico E, Castagnoli L, Cesareni G. MINT, the molecular interaction database: 2012 update. Nucleic Acids Res. 2012;40:D857–861. doi: 10.1093/nar/gkr930. [DOI] [PMC free article] [PubMed] [Google Scholar]
- Liu G, Zhang J, Larsen B, Stark C, Breitkreutz A, Lin ZY, Breitkreutz BJ, Ding Y, Colwill K, Pasculescu A, Pawson T, Wrana JL, Nesvizhskii AI, Raught B, Tyers M, Gingras AC. ProHits: integrated software for mass spectrometry-based interaction proteomics. Nat Biotechnol. 2010;28:1015–1017. doi: 10.1038/nbt1010-1015. [DOI] [PMC free article] [PubMed] [Google Scholar]
- Lopes CT, Franz M, Kazi F, Donaldson SL, Morris Q, Bader GD. Cytoscape Web: an interactive web-based network browser. Bioinformatics. 2010;26:2347–2348. doi: 10.1093/bioinformatics/btq430. [DOI] [PMC free article] [PubMed] [Google Scholar]
- Maglott D, Ostell J, Pruitt KD, Tatusova T. Entrez Gene: gene-centered information at NCBI. Nucleic Acids Res. 2011;39:D52–57. doi: 10.1093/nar/gkq1237. [DOI] [PMC free article] [PubMed] [Google Scholar]
- Nesvizhskii AI, Keller A, Kolker E, Aebersold R. A statistical model for identifying proteins by tandem mass spectrometry. Anal Chem. 2003;75:4646–4658. doi: 10.1021/ac0341261. [DOI] [PubMed] [Google Scholar]
- Orchard S, Aranda B, Hermjakob H. The publication and database deposition of molecular interaction data. Curr Protoc Protein Sci. 2010;Chapter 25(Unit 25):23. doi: 10.1002/0471140864.ps2503s60. [DOI] [PubMed] [Google Scholar]
- Orchard S, Salwinski L, Kerrien S, Montecchi-Palazzi L, Oesterheld M, Stumpflen V, Ceol A, Chatraryamontri A, Armstrong J, Woollard P, Salama JJ, Moore S, Wojcik J, Bader GD, Vidal M, Cusick ME, Gerstein M, Gavin AC, Superti-Furga G, Greenblatt J, Bader J, Uetz P, Tyers M, Legrain P, Fields S, Mulder N, Gilson M, Niepmann M, Burgoon L, De Las Rivas J, Prieto C, Perreau VM, Hogue C, Mewes HW, Apweiler R, Xenarios I, Eisenberg D, Cesareni G, Hermjakob H. The minimum information required for reporting a molecular interaction experiment (MIMIx) Nat Biotechnol. 2007;25:894–898. doi: 10.1038/nbt1324. [DOI] [PubMed] [Google Scholar]
- Perkins DN, Pappin DJ, Creasy DM, Cottrell JS. Probability-based protein identification by searching sequence databases using mass spectrometry data. Electrophoresis. 1999;20:3551–3567. doi: 10.1002/(SICI)1522-2683(19991201)20:18<3551::AID-ELPS3551>3.0.CO;2-2. [DOI] [PubMed] [Google Scholar]
- Pruitt KD, Tatusova T, Brown GR, Maglott DR. NCBI Reference Sequences (RefSeq): current status, new features and genome annotation policy. Nucleic Acids Res. 2012;40:D130–135. doi: 10.1093/nar/gkr1079. [DOI] [PMC free article] [PubMed] [Google Scholar]
- Skarra DV, Goudreault M, Choi H, Mullin M, Nesvizhskii AI, Gingras AC, Honkanen RE. Label-free quantitative proteomics and SAINT analysis enable interactome mapping for the human Ser/Thr protein phosphatase 5. Proteomics. 2011;11:1508–1516. doi: 10.1002/pmic.201000770. [DOI] [PMC free article] [PubMed] [Google Scholar]
- Stark C, Breitkreutz BJ, Chatr-Aryamontri A, Boucher L, Oughtred R, Livstone MS, Nixon J, Van Auken K, Wang X, Shi X, Reguly T, Rust JM, Winter A, Dolinski K, Tyers M. The BioGRID Interaction Database: 2011 update. Nucleic Acids Res. 2011;39:D698–704. doi: 10.1093/nar/gkq1116. [DOI] [PMC free article] [PubMed] [Google Scholar]
- Taylor CF, Paton NW, Lilley KS, Binz PA, Julian RK, Jr, Jones AR, Zhu W, Apweiler R, Aebersold R, Deutsch EW, Dunn MJ, Heck AJ, Leitner A, Macht M, Mann M, Martens L, Neubert TA, Patterson SD, Ping P, Seymour SL, Souda P, Tsugita A, Vandekerckhove J, Vondriska TM, Whitelegge JP, Wilkins MR, Xenarios I, Yates JR, 3rd, Hermjakob H. The minimum information about a proteomics experiment (MIAPE) Nat Biotechnol. 2007;25:887–893. doi: 10.1038/nbt1329. [DOI] [PubMed] [Google Scholar]