

Abstract
Aim:
The present study is aimed at delineation of different types of rugae in two different populations and developing a discriminant function for the same.
Materials and Methods:
A total of 940 subjects were included in the present study. The sample consisted of 466 subjects from South Indian population and 474 from North Indian population in the age group of 18-23 years. Neo colloid Easy flow(™) alginate impressions of maxillary arch were made and casts were immediately poured with Type IV dental stone. A sharp graphite pencil was used to delineate the rugae and patterns were recorded according to the classification given by Kapali et al. The association between different population and different sexes was analyzed with chi-square test and a stepwise discriminant function analysis was also performed to develop a discriminant formula.
Results:
Wavy, curved and straight rugae were the most common forms in both groups. Chi-square analysis for association between rugae shape and population groups showed significant differences among all the rugae patterns at the P < 5%. Chi-square analysis for assessing sex differences in the rugae shapes showed significant difference in straight, unification and circular type. Five rugae shapes – curved, wavy, nonspecific, unification and circular – were selected for discriminant function.
Conclusion:
The discriminant function equation obtained from the different rugae shapes in the present study was highly accurate enough to distinguish the Southern and Northern Indian population with the classification accuracy of 87.8%. Thus to identify a specific population, separate discriminant function formulae have to be developed. Hence, the study of palatal rugae is one of the simple and reliable tools for population identification in forensic science.
Keywords: Discriminant function, palatal rugae, population identification
Introduction
Palatal rugae or transverse palatine folds are irregular mucosal elevations present in the anterior third of the palate. It is asymmetrical and made from the lateral membrane of the incisive papilla, arranged in transverse direction from palatine raphae located in midsaggital plane.
Rugae are well protected by the lip, buccal pad of fat and teeth. Hence, they survive postmortem insults.[1] Palatal rugae are unique to an individual[2,3] and are similar to finger prints.[4] They are stable throughout life following completion of growth,[5] though there is a considerable debate in this regard.[6–8] Identification of a severely burnt edentulous body by rugae comparison to those on the victim's old denture is a standing proof that rugae are stable in adult life.[9] Hence, palatal rugae have been used in medicolegal and forensic identification process.
Though odontometrics serves much in post mortem dental identification, palatal rugae proves to be great supplements in post mortem identification of edentulous and severely burnt decomposed individuals.
Odontometrical analysis, fingerprints and DNA comparisons are probably the most used techniques, allowing secure identification. However, these cannot be applied in certain cases and in such situations, different, simple and less known technique can be used for personal identifications such as “palatal rugoscopy” – study of palatal rugae.[10]
In addition, rugae pattern may be specific to racial groups,[6,11,12] facilitating population identification which is essential in mass–disasters. Even relatively similar population groups show differences in rugae pattern.[11] Racial profiling using intraoral features other than the teeth may have relevance in odonto- stomatological identification in India where, credible dental anthropological data is negligible.[13]
Previous studies[12,13] on palatal rugae pattern have been performed on a limited sample size. They provide a preliminary data on rugae shape between two populations in India and its effectiveness in identifying the populations using discriminant function analysis. Hence, an investigation with a higher sample size is warranted.
The present study is performed using a larger sample size to validate the findings of previous studies and to provide a stronger evidence for forensic identification using palatal rugae. Thus the palatal rugae are unique in its morphology of every individual having good stability with low utilization cost providing a concrete postmortem resistant evidence for forensic purpose.
Therefore the present study is aimed at delineation of different types of rugae in two different populations and developing a discriminant function for the same.
Materials and Methods
A total of 940 subjects were included in the present study who belong to two geographically different populations. The sample consisted of 466 South Indians from Tamil Nadu state and 474 North Indians from Uttar Pradesh.
The subjects were enrolled by simple random sampling from KSR group of educational institutions (South India) and UP College of Arts and Science (North India). The age group of the study subjects were 18-23 years, as there is a lack of consensus on rugae stability with respect to aging.[5–8] Informed consent was obtained from all the enrolled subjects. Exclusion criteria were palatal asymmetries, cleft palate (or) a history of palatal surgery.
Procedure
Neo colloid Easy flow(™) alginate impression of maxillary arch were made and casts were immediately poured with Type IV dental stone. A sharp graphite pencil was used to delineate the rugae and patterns were recorded according to the classification given by Kapali et al.[6] The categories were straight, wavy, curved, circular and if rugae had two arms it is unification. Further, differentiation of unified rugae length based categorization was not considered in our study.
Reliability measures
The delineation of all the rugae patterns was performed by the same investigator. To estimate intra-observer variability, a second determination was made after two months by the same investigator.
Statistical analysis
Statistical analysis was performed using SPSS version 17.0 software. Association between different population and different sexes was analyzed with chi-square test. A stepwise discriminant function analysis was also preformed between the two different populations for different types of rugae to develop a discriminant formula,
Di =K+di1 z1 + di2 z2+……..dip zp
where,
Di is discriminant function score, di is discriminant function co–efficient, z is the score of the predictor variable and K is the discriminant function constant. The significance of rugae on population identification was observed for test of function using Wilks' Lambda statistics.
Results
The occurrence of different rugae shapes in the two populations in the present study is presented in Table 1. Wavy, curved and straight rugae were the most common forms in both groups. Circular rugae constituted less than 5% of rugae in the entire sample of 940 casts. A few non-specific rugae forms were observed. The intra-observer reliability calculated during the second examination after two months, revealed the Kappa value to be 0.93. Hence, the observations made at two different moments showed a negligible difference and therefore were found reliable.
Table 1.
Frequency of different rugae shapes in Southern and Northern Indians

The incidence of all the rugae patterns were more in number in North Indian population compared to that of South Indian population except non-specific rugae [Table 1]. Chi- square analysis for association between rugae shape and population groups showed significant differences among all the rugae patterns at the P < 5% [Table 2]. Chi-square analysis for assessing sex differences in the rugae shapes showed significant difference in straight, unification and circular type [Table 3].
Table 2.
Chi-square analysis for assessing differences in rugae shapes between Southern and Northern Indians
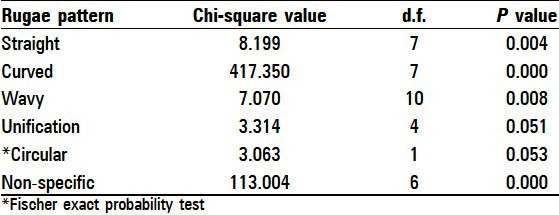
Table 3.
Chi-square analysis for assessing sex differences in the rugae shape

Tables 4-6 show the rugae shape that entered, removed and contributed to the discriminant function analysis respectively. Table 7 shows that the rugae shape that contributed to the discriminant function analysis were subjected to test of function with Wilks' lambda statistics and it showed overall significance among all rugae shapes. Five rugae shapes – curved, wavy, nonspecific, unification and circular – were selected in five steps. Curved rugae entered the analysis first, indicating they had the greatest ability to differentiate the population groups, followed by wavy, unification circular and non-specific rugae. Straight did not contribute to the function, implying their inability to differentiate the groups. The best discriminant function was F = -4.372 + 0.901(CURVED) + 0.375 (WAVY) + 0.354(UNIFICATION) + 0.334(CIRCULAR) – 0.289(NON-SPECIFIC).
Table 4.
Table showing the progress of variables entered the discriminant function analysis

Table 6.
Step-wise discriminant function analysis of the different rugae shapes
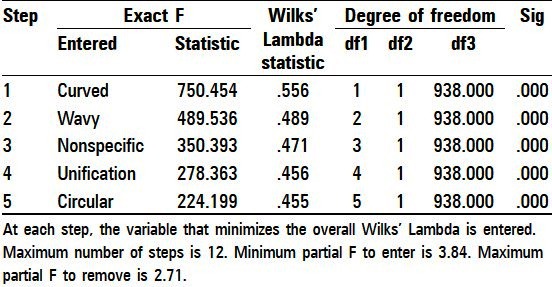
Table 7.
Wilks' Lambda statistics table
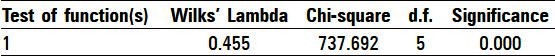
Table 5.
Table showing the progress of variables removed from the discriminant function analysis

Table 8 depicts the unstandardized and standardized coefficients, structure matrix, group centroids and sectioning point for the discriminant function. To determine the population group to which an unidentified individual belongs to, the number of each type of rugae shape is multiplied with the respective unstandardized coefficient and added to the constant. If the value obtained is greater than the sectioning point, the individual is considered as North Indian; if the value obtained is less than the sectioning point, the individual is considered as South Indian. An example is described below.
Table 8.
Discriminant function coefficients for rugae shapes that entered the analysis

Let us consider an unidentified individual where the number of curved rugae = 2, straight rugae = 3, wavy rugae = 3, unification =1, circular = 0 and nonspecific = 0. Multiplying the number of each rugae shape with the respective unstandardized coefficients and adding the constant, we obtain -4.372 + 0.901(2) + 0.375 (3) + 0.354(1) + 0.334(0) – 0.289(0) = -1.09.
Since this value is less than the sectioning point -0.04, the individual is considered as South Indian.
The discriminant function's accuracy in population identification is presented in Table 9. The expected accuracy of identifying an individual from a different population is derived from the entire sample in the original result. This may be biased since the plaster casts from which the function was derived are themselves tested for population origin. To overcome this bias, the statistical tool subjected the sample to “cross-validation” (also referred to as “leave-one-out” classification or “jack-knifing”) where, a function is derived from all but one cast in the sample and the excluded cast tested for population origin. This procedure was performed for each of the 940 casts, i.e. a function was derived from 939 of the 940 dental casts and the 940th cast tested for population origin. This minimises the bias.
Table 9.
Classification Resultsb,c

Consequently, the cross-validated accuracy of the function (87.8%) is lower than that of the original results (87.9%). While cross-validation may be a theoretical construct and not a true “accuracy,” it gives a more realistic indication of the precision of the discriminant function.
Discussion
Human identification is one of the most challenging subjects that man has been confronted with. Human identification is based on numerous scientific principles and methods. Sometimes it becomes necessary to apply lesser known and unusual techniques like cheiloscopy and palatoscopy.[14]
Thomas and Kotze studied the rugae patterns of 6 South African populations to analyse the interracial difference. Their results indicate that rugae were unique to each ethnic group and can be used successfully as a medium for genetic research.[15] Hence, this shows the applicability of rugae in population differentiation and it has been revealed in the present study also.
Hauser et al. compared the rugae patterns of Swazi and Greek populations and observed definite differences in the rugae pattern between the two populations. It was evident that the degree of development of rugae was dependent on the growth of the palate.[16] According to English et al. palatal rugae pattern is sufficiently characteristic to discriminate between individuals. They are unique and identification could be based on their comparison.[2]
The observation of palatal rugae is a subjective phenomenon and it poses a problem when interpreted at two different moments. Lack of complete standardization in interpretation raises the validity of comparison between different studies. Hence, the intra observer variability was calculated and it was found to be k = 0.93; which shows that the difference attributed to the observation is practically inexistent.
Population variations in rugae shape are evident from the present study also. The present study showed more than 42% of wavy, curved and straight rugae forms in each population. This is consistent with finding of Australian Aborigines,[6] Caucasians,[6] Indians (Southern and Western)[13] for wavy and curved rugae patterns. But the straight form of rugae was also found to be higher in the present study. Unification, non-specific and circular was less common. However, circular forms of rugae were very few in number.
Thomas and Kotze[11] and Nayak[13] et al. in their study to identify two genetically similar groups, obtained a jack-knife accuracy of 61.8% and 70% respectively. The classification of jack-knife accuracy obtained from the present investigation, observing two relatively similar populations, showed a relatively higher accuracy of 87% when compared to the previous studies and hence, the type of rugae patterns used has got discriminating ability.
The rugae shapes which are considered for classification in the present work are discrete variables when compared to that of rugae dimensions (continuous variables) used in previous classifications. When genetically similar populations were considered for differentiation continuous variables such as rugae measurements may have its limitations. Therefore use of discrete variables such as rugae shapes could provide better results.[13]
The present analysis has revealed that incidence of all the rugae shapes were significantly higher in Northern Indian population when compared to Southern Indian population except for non-specific rugae. But the rugae shapes used as a predictor variable for Southern Indian population in the present study showed a variable rate of incidence when compared to the previous study.[13] Hence, we believe that even variations within the same country (Uttar Pradesh and Tamilnadu) can show significant rugae pattern variations.
The predictor variable entered the discriminant function in the present study showed a variance when compared to the study conducted by Nayak et al.[13] More number of predictor variables entered the discriminant function in our study which is attributed to the usage of larger sample size for population differentiation.
Conclusion
The discriminant function equation obtained from the different rugae shapes in the present study was highly accurate enough to distinguish the Southern and Northern Indian population with the classification accuracy of 87.8%. Thus to identify a specific population, separate discriminant function formulae have to be developed. Hence, the study of palatal rugae is one of the simple and reliable tools for population identification in forensic science.
Footnotes
Source of Support: Nil
Conflict of Interest: None declared
References
- 1.Muthu Subramanian M, Limson KS, Julian R. Analysis of rugae in burn victims and cadavers to simulate rugae identification in cases of incineration and decomposition. J Forensic Odontostomatol. 2005;23:26–9. [PubMed] [Google Scholar]
- 2.English WR, Robinson SF, Summitt JB, Oesterle LG, Brannon RB, Morlang WM. Individuality of human palatal rugae. J Forensic Sci. 1988;33:718–26. [PubMed] [Google Scholar]
- 3.Limson KS, Julian R. Computerised recording of the palatal rugae pattern and an evaluation of its application in forensic identification. J Forensic Odontostomatol. 2004;22:1–4. [PubMed] [Google Scholar]
- 4.Thomas CJ, Kotze TJ. The palatal rugae in forensic odonto-stomatology. J Forensic Odontostomatol. 1983;1:11–8. [PubMed] [Google Scholar]
- 5.Lysell L. Plicae palatinae transversae and papilla incisive in man: A morphologic and genetic study. Acta Odont Scand. 1955;13(Suppl 18):5–137. [Cited in: Kapali S, Townsend G, Richards L, Parish T. Palatal rugae patterns in Australian Aborigines and Caucasians. Aust Dent J 1997;42:129-33] [PubMed] [Google Scholar]
- 6.Kapali S, Townsend G, Richards L, Parish T. Palatal rugae patterns in Australian Aborigines and Caucasians. Aust Dent J. 1997;42:129–33. doi: 10.1111/j.1834-7819.1997.tb00110.x. [DOI] [PubMed] [Google Scholar]
- 7.Yamazaki Y. Morphological study of plicae palatinae transversae and papilla incisiva in the Japanese. Anthropol Rep Niigata. 1962;34:36–58. [Cited in: Hauser G, Daponte A, Roberts MJ. Palatal rugae. J Anat 1989;165:237] [Google Scholar]
- 8.Yamazaki Y. Cross-sectional study of plicae palatinae transversae in the Japanese. Anthropol Rep Niigata. 1962;34:59–76. [Cited in: Hauser G, Daponte A, Roberts MJ. Palatal rugae. J Anat 1989;165:237] [Google Scholar]
- 9.Thomas CJ, van Wyk CW. The palatal rugae in an identification. J Forensic Odontostomatol. 1988;6:21–7. [PubMed] [Google Scholar]
- 10.Caldas IM, Magalhaes T, Afonsa A. Establishing identity using Cheiloscopy and palatoscopy. Forensic Sci Int. 2007;165:1–9. doi: 10.1016/j.forsciint.2006.04.010. [DOI] [PubMed] [Google Scholar]
- 11.Thomas CJ, Kotze TJ. The palatal ruga pattern in six southern African human populations. Part-II. Inter-racial differences. J Dent Assoc South Afr. 1983;38:166–72. [PubMed] [Google Scholar]
- 12.Shetty SK, Kalia S, Patil K, Mahima VG. Palatal rugae pattern in Mysore and Tibetan populations. Indian J Dent Res. 2005;16:51–5. [PubMed] [Google Scholar]
- 13.Nayak P, Acharya AB, Padmini AT, Kaveri H. Differences in the palatal rugae shape in two populations of India. Arch Oral Biol. 2007;52:977–82. doi: 10.1016/j.archoralbio.2007.04.006. [DOI] [PubMed] [Google Scholar]
- 14.Acharya AB, Sivapathasundharam B. Forensic Odontology. In: Rajendran R, Sivapathasundharam B, editors. Shafer's Textbook of Oral Pathology. 5th ed. New Delhi: Elsevier; 2006. pp. 1199–227. [Google Scholar]
- 15.Thomas CJ, Kotze TJ. The palatal ruga pattern: A new classification. J Dent Assoc South Afr. 1983;38:153–76. [PubMed] [Google Scholar]
- 16.Hauser G, Daponte A, Roberts MJ. Palatal rugae. J Anat. 1989;165:237–49. [PMC free article] [PubMed] [Google Scholar]