Abstract
BACKGROUND
Rapid and effective host cell invasion and vascularization is essential for durable incorporation of avascular tissue-replacement scaffolds. In this study, we sought to qualitatively and quantitatively determine which of the two commercially-available products Strattice® and Integra® facilitate more rapid cellular and vascular invasion in a murine model of graft incorporation.
METHODS
Integra® and Strattice® were implanted subcutaneously in the dorsa of C57BL/6 mice, harvested after 3, 7, or 14 days, and stained with hematoxylin & eosin, DAPI, and immunohistochemical (IHC) stains for CD31 and α-smooth muscle actin. Exponential decay equations describing cellular invasion through each layer were fit to each material/time point. Mean cell density and cell frequency maps were created denoting extent of invasion by location within the scaffold.
RESULTS
Qualitative analysis demonstrated extensive cellular infiltration into Integra® by 3d and increasing over the remaining 14d. Invasion of Strattice® was sparse, even after 14d. αSMA IHC revealed blood vessel formation within Integra® by 14d, but no analogous neovascularization in Strattice®. Mean decay equations for Integra® and Strattice® were y=76.3(0.59)x and y=75.5(0.33)x, respectively. Both cell density measurements and frequency mapping demonstrated that at all time points, Integra® manifested a greater density/depth of cellular invasion when compared with Strattice®.
CONCLUSION
These data confirm empiric clinical observations that Integra® is more rapidly invaded than Strattice® when placed in a suitable host bed. A remnant microvasculature template is not sufficient for effective cellular ingrowth into an artificial tissue construct. These findings provide insight into means for improving future dermal replacement products.
Introduction
The ultimate goal of tissue engineering is to restore lost or damaged tissue. Accordingly, the optimization of cell guidance through autologous or artificial tissue scaffolds has long been a topic of great interest. The most prevalent and thus far the most successfully applied off-the-shelf “tissue-engineered” products were all originally intended to serve as dermal replacement scaffolds. While many such products are commercially available, all are acellular and thus share the common requirements of host cell invasion and vascularization to achieve durable incorporation. Because this process is prolonged, requiring a minimum of several weeks for completion and necessitating obligatory dressing changes, wound immobilization, and nursing care (1, 2), there is significant interest in developing a more thorough understanding of the scaffold parameters that could optimize the rate of cellular invasion. Currently available acellular dermal replacements can be categorized into two broad groups: products derived from decellularized dermis and synthetic products based on naturally-derived hydrogels.
Strattice® and Alloderm® belong to the former group and consist of decellularized cadaveric porcine and human dermis, respectively. As a result of the decellularization process, Alloderm® contains an internal network of microchannels with an intact basement membrane that are the remnants of the native dermal microvasculature (3). It seems logical to hypothesize that a matrix which contains an inherent network of channels with an architecture derived from actual vasculature would promote optimal cell invasion and vascularization.
Integra®, another commonly applied dermal regeneration template, is comprised of a synthetic “dermal” porous layer of cross-linked type I bovine collagen and chondroitin-6-sulfate covered by an “epidermal” semi-permeable silicone sheet. Following implantation, this sheet is replaced with split-thickness autograft once the dermal layer has vascularized (4–9). Unlike Strattice® and Alloderm®, Integra® is representative of products without an internal vascular structure and is instead characterized by its random porosity (mean pore diameter 30–120μm) (10).
While these products are commonly used in clinical practice (11–15), there have been no studies directly comparing the rate and extent of host cell invasion and vascularization of these scaffolds. As such, we designed a study to rigorously and quantitatively evaluate the relative rates of invasion and vascularization of these different acellular scaffolds in a murine model of graft incorporation.
Materials and Methods
In vivo Murine Model
Sixteen 8-week-old male C57BL/6J mice were used for this study. All animals were provided chow and water ad libitum and were maintained in a climate-controlled facility accredited by the Association for Assessment and Accreditation of Laboratory Animal Care International. All animal care and experimental procedures were in compliance with the Guide for the Care and Use of Laboratory Animals (16), and this protocol was approved by the Weill Cornell Medical College Institutional Animal Care and Use Committee (Protocol #0812-801A).
Strattice® and Integra®
Strattice® and Integra® were obtained from the Division of Plastic Surgery at Weill Cornell Medical College.
Disc implantation and tissue harvesting
Mice were anesthetized via intraperitoneal injection of ketamine (80 mg/kg) and xylazine (6 mg/kg). Four vertical 5mm incisions were made on the dorsum of each mouse. One 8mm diameter disc of either Integra® or Strattice® was implanted in the subcutaneous layer beneath the panniculus carnosus of each incision. The Integra® scaffolds were implanted with the silicone layer facing superficially. Incisions were closed with a continuous 4-0 Vicryl® intradermal suture and protected with a clear adhesive dressing. After 3, 7, or 14 days, the mice were sacrificed and the scaffolds were explanted, fixed in 10% buffered formalin, embedded in paraffin, and sectioned.
Histology
Hematoxylin and eosin (H&E) staining was performed for each implant type. Stained sections were imaged with an inverted microscope using bright field microscopy to qualitatively determine the extent of cellular invasion.
Immunohistochemical staining was performed for CD31 (platelet endothelial cell adhesion molecule-1, PECAM-1) using a rabbit polyclonal anti-CD31/PECAM-1 antibody (1:50 dilution). α-Smooth muscle actin (α-SMA) immunohistochemistry was performed using a mouse monoclonal anti-α-SMA antibody (1:50 dilution). Nuclei were stained with 4′,6-diamidino-2-phenylindole (DAPI) for both cell identification and quantification.
Slides were prepared through deparaffinization, rehydration, and antigen-retrieval processing (Dako Target Retrieval). Next, they were incubated for 30 min in a blocking solution consisting of 2% bovine serum albumin and 0.5% Triton-X for membrane permeabilization. Additional blocking was performed with the Vector M.O.M. block according to the manufacturer’s instructions. The slides were then incubated sequentially for 1 hour each in primary and secondary antibodies (goat anti-rabbit IgG, and goat anti-mouse IgG respectively, 1:100 dilution). Fluorescent images were obtained with an inverted fluorescent microscope.
Exponential Decay Analysis of Cellular Invasion
Photomicrographs of multiple H&E slides were taken with an upright brightfield microscope on 40x magnification and adjoined using Adobe Photoshop to form a complete image of each 5μm thick section. Scaffold images were divided into 4 (for Integra®) or 8 (for Strattice®) vertical layers of equal thickness. Strattice® was divided into twice the number of layers as cells are able to invade the scaffold from both below and above, in contrast to Integra®, where the cell-impermeable silicone membrane prevents cellular invasion from the more superficial surface. Layers were numbered according to distance from the cell-scaffold interface.
For each section, cell densities were obtained by quantifying the nucleated cells within each layer. Layers were then aggregated to determine an overall cell density gradient for each type of scaffold and time point. For Strattice® grafts, only the four deepest layers were included in the analysis (i.e., the four layers immediately superficial to the underlying muscle). Using regression analysis in Microsoft Excel, exponential decay equations of the form:
were extrapolated from this data, where “y” represents the nucleated cell count per layer, “a” is the invasion coefficient reflecting the degree of invasion into the most external scaffold layer (i.e., the scaffold layer in direct contact with host tissue), “b” represents the rate of decay with respect to the number of cells in each layer, “(1−b)” is therefore the decay factor, and “x” corresponds to the layer number (1 through 4). Note that higher values of a correlate with a greater degree of cellular invasion into the first (wound bed-adjacent) layer, and as (1−b) approaches zero, the amount of decay increases. A coefficient of determination (R2) was used to evaluate the quality of the fit.
Quantification of cell density gradient
Cell density graphs representing the density of cellular invasion (ρ) as a function of depth within the scaffold (z) were extrapolated from DAPI cell counts. Differential mean cell densities through each disc were calculated by counting the total number of nuclei seen on DAPI florescence images per unit area in the z-direction for 15 representative sections of each material.
Cell Frequency Mapping
Cell frequency maps denoting extent of invasion by depth in the z-direction (Figure 1) were extracted from a combination of 15 DAPI florescence images, each 200 μm wide by 500 μm in height. For each fluorescent image, a binary image was created using a global threshold generated using Otsu’s methods through image processing algorithms in ImageJ (National Institutes of Health, Bethesda, MD). Cell nuclei greater than 4 pixels in size were counted and their center points translated into a matrix of coordinates that were subsequently exported through MATLAB (MathWorks, Natick, MA). Cell frequency maps were generated by combining 15 such matrices of 3 templates for each material and timepoint.
Figure 1.
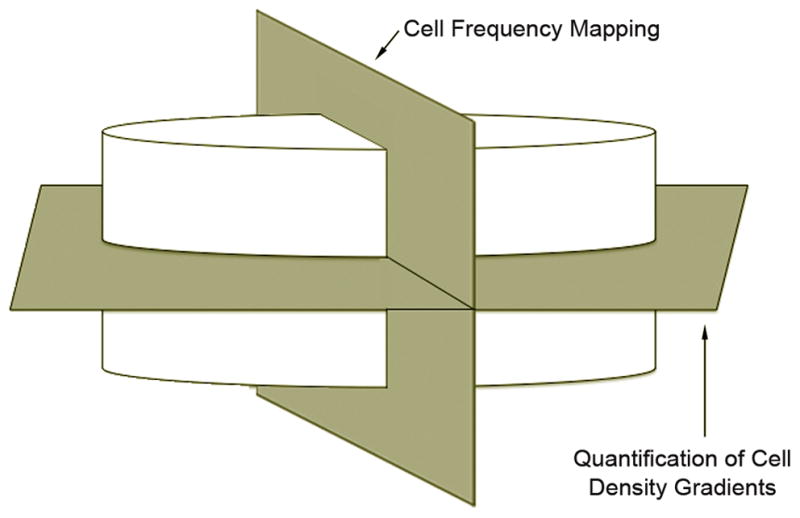
Schematic representation of the orthogonal scaffold planes utilized in cell density gradient quantification and cell frequency mapping. Quantification of cell density gradients is performed parallel to the scaffold-tissue interface, while cell frequency analysis occurs in a perpendicular plane.
Results
Hematoxylin & Eosin and Immunohistochemical Staining
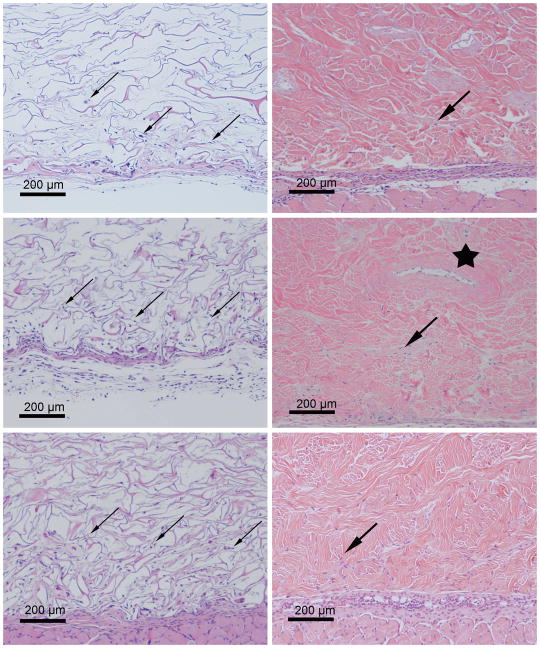
Qualitative analysis based on H&E staining demonstrated diffuse and extensive cellular infiltration into Integra® by day 3. Cellular invasion increased steadily over the remaining 2 weeks to reach the greatest level seen in this study by 14 days. Only isolated invading cells were seen in Strattice®, even after 14 days (Figure 2).
Figure 2.
Representative H&E stained sections of Integra® (left) and Strattice® (right) templates explanted after 3 (top), 7 (middle), and 14 (bottom) days. Diffuse and extensive cellular infiltration into the loose Integra® matrix occurs by day 3 and is increased by 2 weeks (small arrows). Only isolated invading cells were seen within the more dense Strattice® matrix, even after 14 days (large arrows). The Strattice® template contains an inherent microchannel network (star), a remnant of the dermal vasculature prior to the decellularization process. Host cells have invaded into the lumen of this particular channel by day 7.
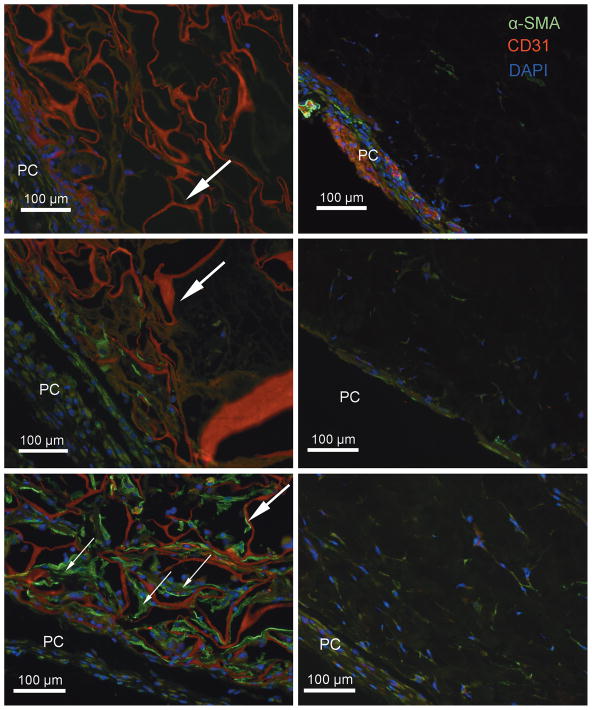
Staining for α-SMA (a marker for perictytes) revealed blood vessel formation within Integra® grafts by day 14. CD31 staining (an endothelial cell marker) in Integra® overlapped with autofluorescence of the extracellular matrix components. However, there was not consistent perivascular CD31 positivity, which suggests that these blood vessels were not fully mature. There was no analogous vascularization in Strattice®, as demonstrated by the lack of CD31 or α-SMA positivity by 14 days (Figure 3).
Figure 3.
Representative IHC stained sections of Integra® (left) and Strattice® (right) templates explanted after 3 (top), 7 (middle), and 14 (bottom) days. The panniculus carnosus (PC) is at the bottom-left of each image (PC). α-SMA positivity reveals blood vessel formation in Integra® by 14 days (small arrows), but no analogous vascularization in Strattice®. CD31 staining in Integra® overlapped with autofluorescence of the extracellular membrane components (large arrows) making it impossible to differentiate between the two. However, there was not consistent perivascular CD31 positivity, which suggests that these blood vessels were not fully mature. α-SMA=green; CD31=red; DAPI=blue.
Exponential Decay Analysis
The mean decay equations for Integra® and Strattice® were y=76.3(0.59)x and y=75.5(0.33)x, respectively (Tables 1–2). The greater density and depth of invading cells seen within Integra® is reflected by the decay equations and their corresponding graphic representations (Figure 4): there are a greater number of cells per layer in Integra® as compared with Strattice® at all timepoints. The depth and extent of cell invasion into Strattice® was symmetrical from above and below (data not shown). Furthermore, Strattice® grafts demonstrate a greater decay rate b (and therefore a lower decay factor 1−b) at all timepoints. This translates into a steeper decline of each decay curve with increasing layer depth, correlating with the decreased penetration of cells into the bulk of the Strattice® matrix when compared with Integra®.
Table 1.
Mean (± standard error) number of cells per layer for each scaffold material and time point. These values were used to calculate exponential decay equations in Table 2.
| Layer
|
||||||||
|---|---|---|---|---|---|---|---|---|
| Integra® | Strattice® | |||||||
|
| ||||||||
| Day | 1 | 2 | 3 | 4 | 1 | 2 | 3 | 4 |
| 3 | 28.3±3.1 | 13.8±2.0 | 10.5±1.1 | 10.3±1.2 | 7.9±2.3 | 0.3±0.1 | 0.4±0.2 | 0.1±0.0 |
| 7 | 50.5±3.3 | 19.9±1.5 | 9.5±0.9 | 3.8±0.6 | 52.0±4.2 | 8.1±1.4 | 2.6±0.8 | 1.6±0.6 |
| 14 | 56.9±2.3 | 26.6±2.0 | 14.0±1.4 | 13.3±1.3 | 45.1±3.1 | 14.7±1.3 | 5.5±0.8 | 3.6±1.3 |
Table 2.
Values (± standard error) describing the exponential decay equations for Integra® and Strattice® of the form y=a*(1−b)x; “y” = nucleated cell count per layer; “a” = invasion coefficient reflecting the degree of invasion into the most external scaffold layer; “b” = rate of cell count decay between layers; “(1−b)”= the decay factor; “x” = layer number (1 through 4); “R2”= coefficient of determination representing the “goodness of fit.”
| Integra® | Strattice® | |||||||
|---|---|---|---|---|---|---|---|---|
|
| ||||||||
| Day | a | 1−b | b | R2 | a | 1−b | b | R2 |
| 3 | 32.6±0.3 | 0.72±0.11 | 0.28 | 0.81 | 17.6±1.2 | 0.24±0.43 | 0.76 | 0.84 |
| 7 | 115.7±0.1 | 0.43±0.03 | 0.57 | 1.00 | 118.1±0.6 | 0.31±0.21 | 0.69 | 0.94 |
| 14 | 80.5±0.3 | 0.61±0.12 | 0.39 | 0.90 | 90.7±0.3 | 0.43±0.11 | 0.57 | 0.97 |
|
| ||||||||
| Mean | 76.3 | 0.59 | 0.41 | - | 75.5 | 0.33 | 0.67 | - |
Figure 4.
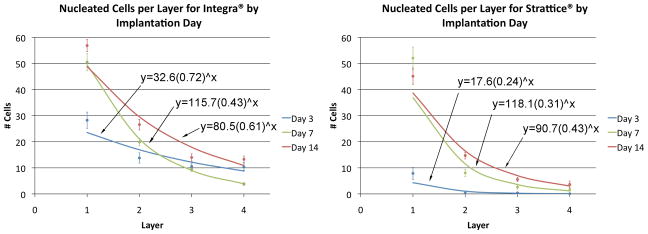
Number of nucleated cells in each layer by implantation day for Integra® (left) and Strattice® (right). Points represent mean measured value ± SEM; lines represent exponential decay curves calculated by regression analysis. At all time points, Integra® demonstrated a greater number of cells per layer.
Cell Density Gradient Analysis
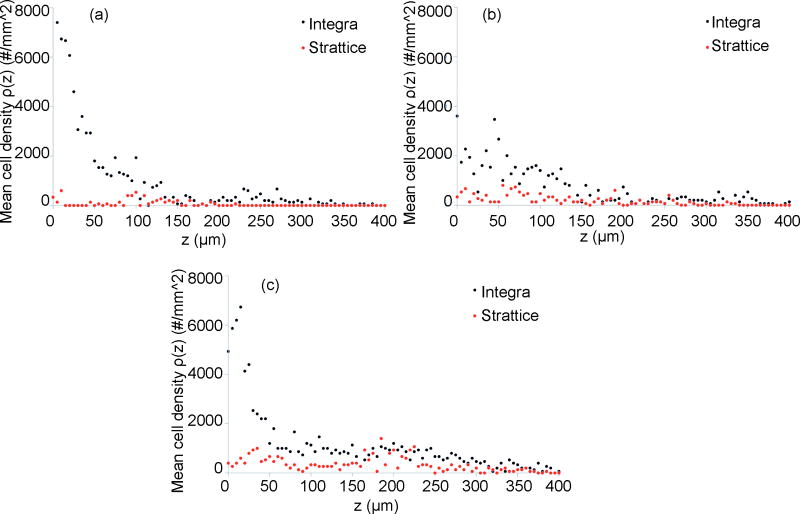
At all time points, when compared with Strattice®, Integra® demonstrated a greater density and depth of cellular invasion (Figure 5). The number of invading cells within Integra® decreased slightly from day 3 to day 7 and rebounded to the greatest value seen in this study by day 14. In contrast, the cellular invasion profile of Strattice® did not change considerably over the 2-week period.
Figure 5.
Cell density graphs representing mean cellular density “ρ” (i.e., the number of DAPI-positive nuclei per unit area) as a function of distance from the graft/tissue interface, “Z,” at (top left) 3 days, (top right) 7days, and (bottom center) 14 days. At all time points, Integra® demonstrates a greater density and depth of cellular invasion. The number of invading cells within Integra® nadirs slightly from day 3 to day 7 and rebounds to its greatest value by day 14as reflected by a decrease and subsequent increase in cell density over this time period. In contrast, the cellular invasion profile of Strattice® does not change considerably over the 2-week period.
Cell Frequency Mapping
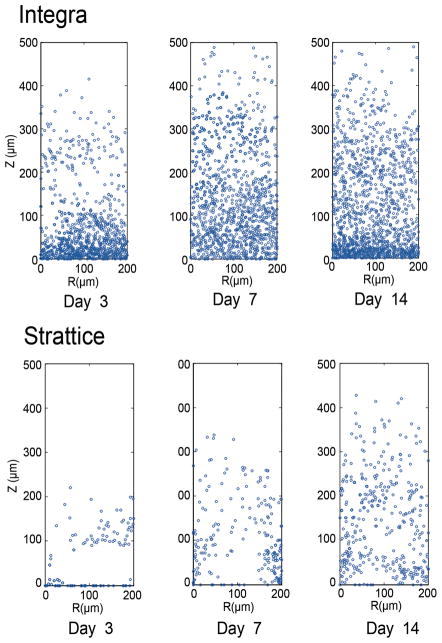
Cell frequency mapping represents an alternative method of evaluating cellular invasion and depicts cell location within each graft in a plane orthogonal to that used in gradient density analysis. Frequency mapping reveals a greater density and depth of invasion with Integra® when compared with Strattice® at all time points (Figure 6), thereby confirming the results obtained by density gradient analysis.
Figure 6.
Cell frequency maps extracted from 15–200μm × 500μm DAPI fluorescence images denoting extent and depth of cellular invasion at three sequential time points. The R -axis lies along the graft/tissue interface, while the Z-axis denotes the distance from this interface. Analogous to the results obtained by cell density measurements, a greater cell frequency and depth of invasion is seen with Integra® (top) as compared with Strattice® (bottom) at all time points. Likewise, the number of invading cells within Integra® nadirs slightly from day 3 to day 7 and rebounds to its greatest value by day 14 as reflected by a decrease and subsequent increase in cell frequency over this time period. In contrast, the cellular invasion profile of Strattice® does not change considerably over the 2-week period.
Discussion
While primary or even secondary closure of full-thickness tissue defects is optimal, it is frequently not possible due to the magnitude of tissue loss. Additional reconstructive options include split or full-thickness skin grafting, tissue expansion, random or pedicled flaps, and free tissue transfer. Although technological advances and the evolution of surgical techniques have rendered such measures more effective, these methods continue to suffer from significant limitations. First, if present, tissue available for transfer is finite in quantity and therefore may be insufficient to cover large wounds. Secondly, these increasingly complex operations produce obligatory secondary donor sites wounds with their own inherent potential for morbidity including failure to heal, pain, infection, and scarring. These considerations have led researchers to develop tissue replacement scaffolds (including decellularized dermal products and semi-synthetic porous matrices) that can permanently and reproducibly address full-thickness tissue defects without limiting potential reconstructive options in the future (17, 18).
Despite the clear advantages of tissue replacement scaffolds, their use is not without substantial associated cost. For example, the production of decellularized dermal products requires tissue acquisition and harvesting, as well as decellularization and sterilization processes (19, 20). Furthermore, use of decellularized products carries the at least theorectical risk of disease transmission (18). Lastly, standard clinical application of dermal replacement scaffolds necessitates two separate operative procedures (graft application followed by split-thickness skin grafting) with their own obligatory inherent costs (4, 18, 21, 22).
The fate of tissue regeneration scaffolds has previously been studied in animal models (1, 2, 11, 23–25). Fibroblast infiltration into acellular dermal and synthetically derived grafts occurs soon after implantation and is followed by the ingrowth and maturation of vascular structures over approximately a two-week period in both rodent and leporine subjects (1, 2, 25). Furthermore, in the clinical setting, Integra® grafts are typically sufficiently vascularized to support a split-thickness skin graft after 14 days when placed in an ideal wound bed. It is for these reasons that a 14-day endpoint was selected for our study. For example, in a rodent model of graft incorporation Wong et al. report myofibroblast invasion into Alloderm® grafts after 3 days that increased 8-fold by day 14, as well as invasion of CD31+ cells after 3 days and the presence of mature endothelial-cell lined vessels by 2 weeks (2). Baynosa et al. report capillary perfusion as measured by laser Doppler as well as histological evidence of neovascularization by 2 weeks following Integra® placement onto a rodent vascular wound bed (25). Analogous results are routinely reported in human hosts, particularly in the setting of extensive burn injuries (4, 12, 21, 22).
However, as of yet, there has been no direct comparison of the rate and extent of cellular and vascularization between tissue regeneration scaffolds in the same animal model. Furthermore, these have never been compared using rigorous quantitative methods. Therefore, given two very different scaffolds that seek to achieve the same goal, we sought to directly compare these two products with respect to cellular invasion patterns so as to identify potential factors that may be used to enhance cellular invasion into future tissue replacement templates.
To accomplish this goal, we utilized both direct quantification and novel mathematical modeling to characterize cellular invasion. Examination of the invasion exponential decay equations (Figure 4) reveals two interesting features: first, the invasion coefficient a is greater for Integra® than for Strattice® across all time points. This corresponds to a higher cell density within the most external scaffold layers. Furthermore, the depth of cellular invasion into Integra® is consistently greater. Specifically, the values of b (representing the rate of decay of cellular invasion) at each time point are greater for Strattice® than for Integra® and represent a decreased penetration of cells from the scaffold-tissue interface of Strattice® grafts inwards. These findings were determined by qualitative H&E and IHC assessment of cell invasion (Figures 2–3), as well as cell density analyses and frequency mapping (Figures 5–6).
As stated above, cell density distribution within Integra® grafts manifested a distinct temporal pattern of invasion: cell numbers were high by day 3, decreased slightly by day 7, and rebounded by day 14. This finding is consistent with the known sequence of wound healing events: immuno-inflammatory cells predominate initially and with their regression give way to fibroblast and vascular proliferation. The presence of αSMA+ vascular structures on immunohistochemical staining of Integra® grafts by day 14 further supports this finding. In contrast to Integra® grafts, as well as to the results seen by Eppley and Wong et al. with Alloderm®, the cellular invasion profile of Strattice® was largely unchanged over the two-week experimental period.
Many factors likely influence the differential rates of cellular and vascular invasion observed in this study. Integra® contains a relatively loose and porous matrix which allows cells to easily migrate through the scaffold. In contrast, decellularized dermis is composed of a highly dense collagen matrix, which appears to impede cellular invasion and thus delays biointegration (10, 20)despite the fact that it contains many of the original chemical cues inherent to the original extracellular matrix components, including collagen, elastin, and proteoglycans (2). As such, potential explanations for the failure of Strattice® to elicit a robust inflammatory response like Integra® include the inability of immune cells to penetrate the dense Strattice® matrix and interact with antigens located within, or the genetic modification of the porcine donors to render them more similar to humans in their antigenic profile. Although the microchannel network native to Strattice® grafts ultimately does become repopulated with host cells, this is a prolonged process requiring significantly more time to result in a truly vascularized scaffold than Integra®.
While this study is the first to directly and simultaneously compare two widely-applied commercially-available tissue regeneration templates, it is not without limitations. Our quantitative analyses were based on nucleated cell counts and did not distinguish between specific cell types. In addition, animal models, however appropriate, do not necessarily accurately represent the complex wound-healing milieu of human patients, particularly those with chronic wounds (cellular and vascular invasion may not be equivalent with clinical success). Lastly, our analysis was only carried through 14 days; longer investigations are required to determine the ultimate fate of tissue regeneration scaffolds.
Conclusion
In conclusion, these data confirm empiric clinical observations that Integra® is more rapidly and efficiently vascularized than Strattice® when placed in a suitable host bed. Furthermore, the presence of a remnant microvasculature template is not sufficient for effective cellular and vascular ingrowth into an artificial tissue construct. Due to differences in their invasion profiles and tensile strength, that Integra® is more suitable for dermal reconstruction, whereas Strattice® is more appropriate for uses where strength takes precedence over rapid vascularization, such as in abdominal wall or breast reconstruction. These findings provide further insight into means of improving future tissue replacement products so as to elicit more rapid host cellular invasion and vascular incorporation.
Acknowledgments
FUNDING SUPPORT:
A portion of this research was funded by a Glorney-Raisbeck Medical Student Grant in Cardiovascular Research, the Morgan Tissue Engineering Foundation, the Empire Clinical Research Investigator Program, and a Ruth L. Kirschstein National Research Service Award (NRSA) Institutional Research Training Grants (NIH 5T32HL083824-05).
Footnotes
Portions of this work has been presented at the 5th Annual American Surgical Congress in San Antonio, TX, the 55th Annual Meeting of the Plastic Surgery Research Council in San Francisco, CA, and the 6th Annual American Surgical Congress in Huntington Beach, CA.
FINANCIAL DISCLOSURES:
None of the authors have any financial interests to disclose.
PRODUCTS:
Integra® (Integra LifeSciences Corporation; Plainsboro, NJ)
Strattice® (LifeCell Corporation; Branchburg, NJ)
Alloderm® (LifeCell Corporation; Branchburg, NJ)
Vicryl (Ethicon; Somerville, NJ)
DAPI (Invitrogen Co.; Carlsbad, CA)
Target Retrieval Solution (Dako; Carpinteria, CA)
C57BL/6J mice (Jackson Laboratory; Ben Harbor, ME)
Axio Observer (Carl Zeiss, Inc.; Thornwood, NY)
Rabbit polyclonal CD31 antibody (Abcam; Cambridge, CA)
Mouse anti-actin (smooth muscle) (InvitrogenCo.; Carlsbad, CA)
Vector M.O.M. block (Vector Labs; Burlingame, CA)
Alexa Fluor 568 goat anti-rabbit IgG (Invitrogen Co.; Carlsbad, CA)
Alexa Fluor 488 goat anti-mouse IgG (Invitrogen Co.; Carlsbad, CA)
Upright brightfield microscope (Nikon; Tokyo, Japan)
Adobe Photoshop CS2 (Adobe Systems; San Jose, CA)
Microsoft Excel version 12.2.8 (Microsoft Corporation; Redmond, WA)
Matlab (MathWorks; Natick, MA)
ImageJ (U.S. National Institutes of Health; Bethesda, MD).
References
- 1.Eppley BL. Experimental assessment of the revascularization of acellular human dermis for soft-tissue augmentation. Plast Reconstr Surg. 2001;107:757–762. doi: 10.1097/00006534-200103000-00016. [DOI] [PubMed] [Google Scholar]
- 2.Wong AK, Schonmeyr B, Singh P, et al. Histologic analysis of angiogenesis and lymphangiogenesis in acellular human dermis. Plast Reconstr Surg. 2008;121:1144–1152. doi: 10.1097/01.prs.0000302505.43942.07. [DOI] [PubMed] [Google Scholar]
- 3. [Accessed February 20, 2011];LifeCell Alloderm product description. Available at: http://www.lifecell.com/alloderm-regenerative-tissue-matrix/96/
- 4.Burke JF, Yannas IV, Quinby WC, Jr, et al. Successful use of a physiologically acceptable artificial skin in the treatment of extensive burn injury. Ann Surg. 1981;194:413–428. doi: 10.1097/00000658-198110000-00005. [DOI] [PMC free article] [PubMed] [Google Scholar]
- 5.Dagalakis N, Flink J, Stasikelis P, et al. Design of an artificial skin. Part III. Control of pore structure. J Biomed Mater Res. 1980;14:511–528. doi: 10.1002/jbm.820140417. [DOI] [PubMed] [Google Scholar]
- 6.Yannas IV, Burke JF, Gordon PL, et al. Design of an artificial skin. II. Control of chemical composition. J Biomed Mater Res. 1980;14:107–132. doi: 10.1002/jbm.820140203. [DOI] [PubMed] [Google Scholar]
- 7.Yannas IV, Burke JF. Design of an artificial skin. I. Basic design principles. J Biomed Mater Res. 1980;14:65–81. doi: 10.1002/jbm.820140108. [DOI] [PubMed] [Google Scholar]
- 8.Yannas IV, Burke JF, Orgill DP, et al. Wound tissue can utilize a polymeric template to synthesize a functional extension of skin. Science. 1982;215:174–176. doi: 10.1126/science.7031899. [DOI] [PubMed] [Google Scholar]
- 9.Yannas IV, Burke JF, Warpehoski M, et al. Prompt, long-term functional replacement of skin. Trans Am Soc Artif Intern Organs. 1981;27:19–23. [PubMed] [Google Scholar]
- 10.van der Veen VC, van der Wal MB, van Leeuwen MC, et al. Biological background of dermal substitutes. Burns. 36:305–321. doi: 10.1016/j.burns.2009.07.012. [DOI] [PubMed] [Google Scholar]
- 11.Truong AT, Kowal-Vern A, Latenser BA, et al. Comparison of dermal substitutes in wound healing utilizing a nude mouse model. J Burns Wounds. 2005;4:e4. [PMC free article] [PubMed] [Google Scholar]
- 12.Campitiello E, Della Corte A, Fattopace A, et al. The use of artificial dermis in the treatment of chronic and acute wounds: regeneration of dermis and wound healing. Acta Biomed. 2005;76 (Suppl 1):69–71. [PubMed] [Google Scholar]
- 13.Haertsch PA. Re: “The use of a non-cultured autologous cell suspension and Integra) dermal regeneration template to repair full thickness skin wounds in a porcine skin model: a one-step process” [Burns 2007;33(6):693–700] Burns. 2008;34:899. doi: 10.1016/j.burns.2007.12.012. author reply 900-891. [DOI] [PubMed] [Google Scholar]
- 14.Rennekampff HO. Skin graft procedures in burn surgery. Unfallchirurg. 2009;112:543–549. doi: 10.1007/s00113-009-1655-5. [DOI] [PubMed] [Google Scholar]
- 15.Lineen E, Namias N. Biologic dressing in burns. J Craniofac Surg. 2008;19:923–928. doi: 10.1097/SCS.0b013e318175b5ab. [DOI] [PubMed] [Google Scholar]
- 16.Institute of Laboratory Animal Resources (U.S.) Guide for the care and use of laboratory animals. 7. Washington, D.C: National Academy Press; 1996. [Google Scholar]
- 17.Schulz JT, 3rd, Tompkins RG, Burke JF. Artificial skin. Annu Rev Med. 2000;51:231–244. doi: 10.1146/annurev.med.51.1.231. [DOI] [PubMed] [Google Scholar]
- 18.Park CA, Defranzo AJ, Marks MW, et al. Outpatient reconstruction using integra* and subatmospheric pressure. Ann Plast Surg. 2009;62:164–169. doi: 10.1097/SAP.0b013e31817d87cb. [DOI] [PubMed] [Google Scholar]
- 19.Mofid MM, Singh NK. Pocket conversion made easy: a simple technique using alloderm to convert subglandular breast implants to the dual-plane position. Aesthet Surg J. 2009;29:12–18. doi: 10.1016/j.asj.2008.12.005. [DOI] [PubMed] [Google Scholar]
- 20.Ng KW, Khor HL, Hutmacher DW. In vitro characterization of natural and synthetic dermal matrices cultured with human dermal fibroblasts. Biomaterials. 2004;25:2807–2818. doi: 10.1016/j.biomaterials.2003.09.058. [DOI] [PubMed] [Google Scholar]
- 21.Moiemen NS, Staiano JJ, Ojeh NO, et al. Reconstructive surgery with a dermal regeneration template: clinical and histologic study. Plast Reconstr Surg. 2001;108:93–103. doi: 10.1097/00006534-200107000-00015. [DOI] [PubMed] [Google Scholar]
- 22.Stern R, McPherson M, Longaker MT. Histologic study of artificial skin used in the treatment of full-thickness thermal injury. J Burn Care Rehabil. 1990;11:7–13. doi: 10.1097/00004630-199001000-00003. [DOI] [PubMed] [Google Scholar]
- 23.Chu CS, McManus AT, Matylevich NP, et al. Integra as a dermal replacement in a meshed composite skin graft in a rat model: a one-step operative procedure. J Trauma. 2002;52:122–129. doi: 10.1097/00005373-200201000-00021. [DOI] [PubMed] [Google Scholar]
- 24.Reagan BJ, Madden MR, Huo J, et al. Analysis of cellular and decellular allogeneic dermal grafts for the treatment of full-thickness wounds in a porcine model. J Trauma. 1997;43:458–466. doi: 10.1097/00005373-199709000-00012. [DOI] [PubMed] [Google Scholar]
- 25.Baynosa RC, Browder LK, Jones SR, et al. Evaluation of artificial dermis neovascularization in an avascular wound. J Reconstr Microsurg. 2009;25:405–410. doi: 10.1055/s-0029-1223848. [DOI] [PubMed] [Google Scholar]


