Abstract
We demonstrate rapid and efficient sensing of mammalian cell types and states using nanoparticle-based sensor arrays. These arrays are comprised of cationic quantum dots (QDs) and gold nanoparticles (AuNPs) that interact with cell surfaces to generate distinguishable fluorescence responses based on cell surface signatures. The use of QDs as the recognition elements as well as the signal transducers presents the potential for direct visualization of selective cell surface interactions. Notably, this sensor is unbiased, precluding the requirement of pre-knowledge of cell state biomarkers and thus providing a general approach for phenotypic profiling of cell states, with additional potential for imaging applications.
Keywords: Quantum dots, Gold nanoparticles, Cell surface differentiation, Sensor array
1. Introduction
Early detection and screening of cancerous cell states is a crucial determinant for successful treatment and patient survival. Current methodologies for cancer diagnosis are based on the detection of 0biomarkers, such as genes, proteins, or other specific molecules [1,2]. For example, prostate specific antigen (PSA) is a widely used clinical biomarker for prostate cancer in the early detection [3,4], and receptor tyrosine kinases (RTKs) are surface biomarkers used for cancer cell monitoring [5,6]. Antibody arrays [7], DNA micro-arrays [8], mass spectrometry [9], and electrophoresis [10] have been employed as useful tools for cancer diagnosis based on the understanding of the cancer biomarkers. However, single “lock-key” recognition of specific biomarker is limited by the requirement of pre-knowledge about the disease biomarkers. Lack of a unique marker or combination of biomarkers for cell types often poses a major challenge in the early detection of cancer [11]. Therefore, alternate methodologies with greater selectivity, higher sensitivity, rapid detection ability, and exploiting the overall cellular signatures would enhance our ability to detect and identify cancer.
Selective array-based sensing methodologies provide potential alternatives to specific recognition approaches, relying on the differential affinities for analyte identification [12]. Sensors have been developed utilizing this approach for identification of cancer cells, using fluorescent polymers [13,14], magnetic glyco-nanoparticles [15], and non-covalent conjugates of gold nanoparticles and fluorophores [16,17].
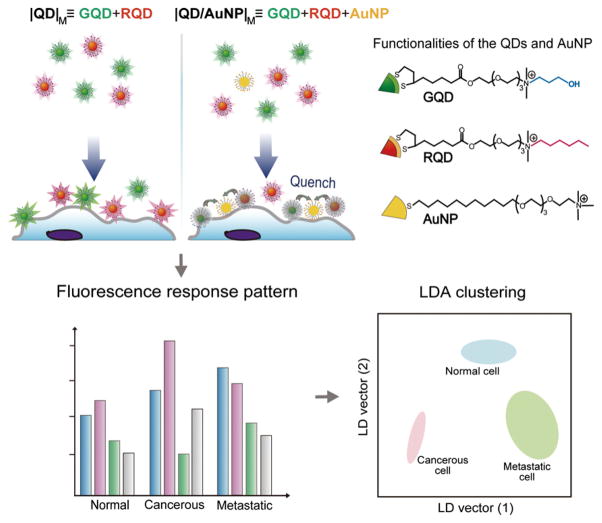
We introduce here a new nanoparticle-based sensor for discriminating between cell types and states by their surface properties. This sensor strategy uses quantum dots and gold nanoparticles as recognition elements. The quantum dots serve as transducers [18], relying on their unique optical properties, such as high quantum yield, excellent photostability, and spatially resolvable multiple emission signals [19,20]. The gold nanoparticle serves to modulate the fluorescence response of the sensor, employing distance-dependent quenching of quantum dot emission [21]. With these unique physicochemical properties of quantum dots and gold nanoparticles, we fabricated a sensing system using two quantum dots (green: GQD and red: RQD) and one gold nanoparticle (AuNP) for cell state discrimination (Scheme 1). Variation in fluorescence provides distinct patterns to discern between different cell types/states. Moreover, this quantum dot-gold nanoparticle-based sensor achieves dual-channel fluorescence output from each particle mixture, providing four fluorescence signals with single excitation that enables rapid, effective, and one-step detection.
Scheme 1.
Schematic illustration of the interaction between the nanoparticles and cell surface in the sensing system generating differential quenching and providing distinct patterns to discern different types/states of cells. The sensing system contains two arrays: |QD|M is the mixture of GQD and RQD; |QD/AuNP|M is the mixture of GQD, RQD, and AuNP. These two arrays are placed in separated wells and each array provides two fluorescence responses.
2. Materials and methods
2.1. Materials
All chemicals were purchased from Sigma–Aldrich unless otherwise stated. The organic solvents were bought from Pharmco-Aaper or Fisher Scientific and used as received except for dichloromethane that was distilled in the presence of calcium hydride. Dulbecco’s Modified Eagle’s Medium (DMEM) (Sigma, D5523) and fetal bovine serum (Fisher Scientific, SH3007103) were used in cell culture.
2.2. Preparation of quantum dots and gold nanoparticles
Trioctylphosphine oxide/trioctylphosphine/hexadecylamine (TOPO/TOP/HDA)-capped CdSe/ZnS core–shell quantum dots were prepared according to reported procedures [22]. 6 nm dodecanethiol-protected gold nanoparticles (AuNPs-DT) were prepared according to Miyake’s heat-induced size evolution of gold nanoparticles with a slight modification. 2 nm AuNPs-DT were heated to 165 °C at the heating rate of 2 °C/min and held for 30 min at 165 °C [23]. Ligand exchange reactions were used to obtain the water-soluble cationic quantum dots and gold nanoparticles. The general synthetic procedures for dithiolate ligands are available in the Supporting information (Scheme S1).
2.3. Confocal microscopy
HeLa cell (human cervical cancer cell) suspension (10 μL, 10,000 cells) was added to |QD|M or |QD/AuNP|M solution (200 μL) for 15 min incubation. The mixture solution was transferred into a glass-bottom dish (MatTek Corporation, 14 mm microwell). Confocal microscopy images were obtained on a Zeiss LSM 510 Meta microscope using a 63× objective. Differential interference contrast images (DIC) were collected using a bright light source. Different excitation lines and emission spectra windows were used for different colors of quantum dot: GQD was excited with a 488 nm Argon laser and the emission window was 505– 530 nm; RQD was excited with a 543 nm He–Ne laser and the emission window was beyond 650 nm. The z-stack confocal images were obtained from a series of images (time, z, x–y), and the 3D projections were generated from z-stack images with 11 z-slices and z-slice thickness of 2 μm.
2.4. Cell culture
Human cancerous cells (HeLa, HepG2, MCF-7, and NT2) were cultured at 37 °C under a humidified atmosphere of 5% CO2. The cells were cultured in low glucose Dulbecco’s Modified Eagle’s Medium (DMEM, 1.0 g/L glucose) containing 10% fetal bovine serum (FBS) and 1% antibiotics (100 U/mL penicillin and 100 μg/mL streptomycin) in T75 flasks. Isogenic BALB/c mice cells (CDBgeo, TD, and V14) were grown in high glucose DMEM (4.5 g/L glucose) containing 10% FBS and 1% antibiotics in T75 flasks.
2.5. Cell sensing studies
Cells grown in T75 flasks were washed with Dulbecco’s Phosphate Buffered Saline (DPBS), trypsinized with 1× trypsin and diluted with DPBS buffer for centrifugation. Finally, cells were resuspended in DPBS. The sensing array |QD|M was prepared by mixing GQD (50 nM) and RQD (50 nM) in 1 mM sodium phosphate buffer (pH 7.4). |QD/AuNP|M was prepared by mixing GQD (50 nM), RQD (50 nM), and AuNP (10 nM) in 1 mM sodium phosphate buffer (pH 7.4) for 15 min. 200 μL of each solution (|QD|M or |QD/AuNP|M) was loaded into a 96-well plate and fluorescence intensities of complexes were recorded at 550 nm and 590 nm on a Molecular Devices SpectraMax M5 microplate reader with excitation at 420 nm. After measuring the initial fluorescence intensities (I0), these arrays were incubated with cell suspension (10 μL, 10,000 cells/well) to determine the final fluorescence intensities (I). The fluorescence response patterns were plotted as the ratios of final to initial QD fluorescence intensities (I/I0) from |QD|M and |QD/AuNP|M.
2.6. Linear discriminant analysis (LDA)
The fluorescence change (I/I0) patterns were subjected to linear discriminant analysis (LDA) using SYSTAT (version 11.0) to classify and identify different cells. LDA is a supervised multivariate method that is used to separate classes of objects or assign new objects to appropriate classes. The analysis generates a new space given by the canonical discriminant factors (LD vectors), which describes best similarities and differences between groups under consideration. The raw fluorescence response patterns were transformed to canonical patterns where the ratio of between-class variance to the within-class variance was maximized according to the pre-assigned grouping. We followed the “leave-one-out” method to identify the unknown cell test by checking the Mahalanobis distance in LDA. The Mahalanobis distance is the distance of a case to the centroid of a group in a multidimensional space and is calculated for the new case to the centroid of respective training samples. The new case is assigned to the group with the shortest Mahalanobis distance.
3. Results and discussion
3.1. Characterization of quantum dots and gold nanoparticles
Three quaternary ammonium ligands featuring thiolated anchoring groups were used to functionalize the quantum dots (previously capped with TOPO/TOP/HDA) and gold nanoparticles (originally protected by dodecanethiol). GQDs were functionalized with hydroxypropyl terminated group and RQDs were modified with hexyl terminated group. These two headgroups capable of different non-covalent interaction with cell provide the selectivity of nanoparticle attachment on cell surfaces. Additionally, the design of the ligands is based on previous reports where these ligands contributed principally in the differential sensing [17,24]. The GQDs and RQDs showed the emission maxima at 550 nm and 590 nm respectively, and the fluorescence intensities could be measured at the well-separated maxima without any interference (Fig. 1a). AuNPs were functionalized with trimethylammonium terminated ligands through a Murray place exchange reaction [25,26]. The typical surface plasmon resonance (SPR) absorption maxima of the 6 nm AuNPs was observed around 520 nm (Fig. 1b). Dynamic light scattering (DLS) experiment indicated the hydrodynamic diameters of these nanoparticles ranged from 13 nm to 15 nm, and all the particles possessed positive charges with a zeta potential of 18–22 mV (Fig. S1).
Fig. 1.
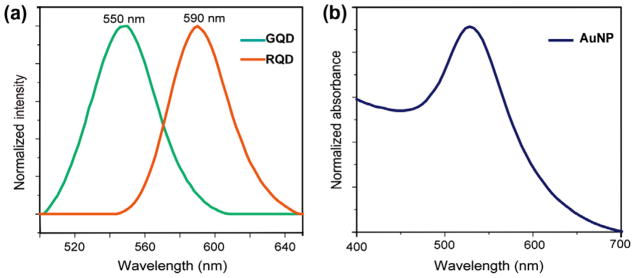
(a) Emission spectra of the cationic GQD and RQD. (b) Absorption spectrum of the AuNP.
3.2. Imaging and sensor arrays
The sensing system was composed of two arrays of cationic nanoparticle mixtures: |QD|M, a mixture of GQD and RQD, and |QD/AuNP|M, a mixture of GQD, RQD, and AuNP. The positively charged surfaces of the nanoparticles interacted with cell surface through electrostatic attraction [27]. In addition to electrostatic interactions, the surface functionalities on the particles were designed to introduce different non-covalent interactions [28–30]. GQDs were functionalized with a hydroxyl head group to provide hydrogen bonding affinity, whereas RQDs functionalized with a n-hexyl head group were expected to introduce hydrophobic interactions. The AuNPs were equipped with trimethylammonium terminated ligands to offer solely electrostatic interaction. Since different cell membrane surfaces consist of various amounts and types of amphipathic phospholipids, carbohydrates, and membrane proteins [31], our sensor would be expected to achieve nanoparticle– cell surface recognition by differential competitive and selective non-covalent interactions.
Confocal microscopy was employed to visualize the interactions between nanoparticles and cell surfaces. A fluorescent ring was clearly observed around the HeLa cell surfaces after incubation with the |QD|M for 15 min, indicating efficient and rapid attachment of the cationic QDs on the negatively charged cell surfaces (Fig. 2a–d). Furthermore, the merged image of red and green channels indicated the co-assembly of the two QDs in |QD|M on the cell surfaces. Upon incubation with |QD/AuNP|M, fluorescence intensities of the QDs on the cell surfaces became weaker (Fig. 2f–h), suggesting co-localization of the QDs and gold nanoparticles on the cell surfaces leading to fluorescence quenching by the AuNPs. To investigate the potential cellular uptake during the incubation of nanoparticles with cell suspensions, the z-stack confocal images and 3D projections were applied that demonstrated QD distribution (Fig. S2 and Video S1). GQDs were incubated with cell suspensions for 15 min before recording the z-stack images that were used to generate 3D projections of the GQD distribution. Clearly, the 3D projections showed the green fluorescence of QDs on the cell surface, and no obvious fluorescence was observed inside the cell. This result indicated that there was absence of cellular uptake of QDs during the 15 min incubation with cell suspensions. Taken together, the confocal fluorescence images indicated a recognition-mediated assembly behavior of the sensor elements on the cell surfaces. The assembly behavior of the QDs demonstrated the potential of the system for both selectivity-based sensing and imaging applications.
Fig. 2.
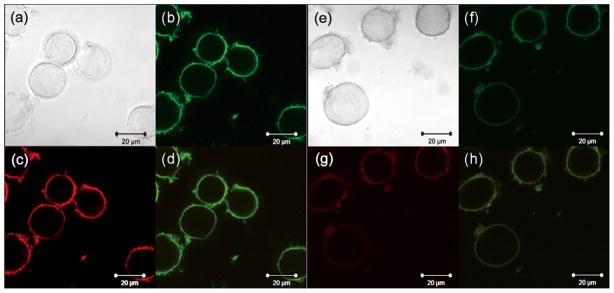
Confocal images of |QD|M (a–d) and |QD/AuNP|M (e–h) after the incubation with HeLa cell suspensions for 15 min: (a and e) bright field; (b and f) green channel; (c and g) red channel; (d and h) merged images. These confocal images were taken under the same microscope setting as described in Section 2. (For interpretation of the references to color in this figure legend, the reader is referred to the web version of this article.)
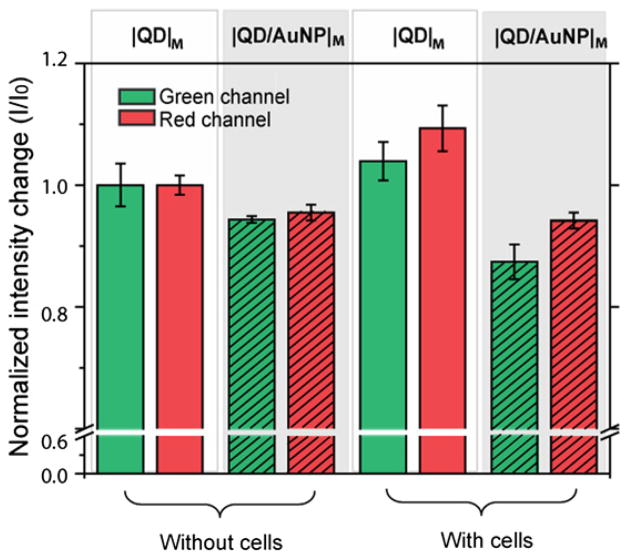
Following the observation of the nanoparticle assembly on cell surfaces, we used fluorescence spectroscopy to isolate the effect of the nanoparticle headgroups on the differential recognition behaviors. The fluorescence intensities of the nanoparticle mixtures were measured at 550 nm (green) and 590 nm (red). Fluorescence changes of |QD|M and |QD/AuNP|M in the absence and presence of HeLa cells were monitored along the green and red channels (Fig. 3). In the absence of cells, both the green and red fluorescence presented lower intensities when incubated with the AuNP, showing its quenching ability. Interestingly, |QD|M and |QD/AuNP|M presented different fluorescence modulations in the presence of cells. |QD|M presented higher fluorescence intensities along the green and red channels upon interaction with cells, as observed with other quantum dot–bimolecule interactions [32,33]. On the other hand, |QD/AuNP|M presented a further fluorescence decrease in the presence of cells, implying co-localization of the QDs and gold nanoparticles upon assembly on the cell surfaces since the quenching efficiency of the gold nanoparticle is principally distance dependent [34].
Fig. 3.
Fluorescence changes of the sensing arrays in the absence or presence of HeLa cells by monitoring the green and red channels: |QD|M: unshaded bars, |QD/AuNP|M: shaded bars. All the fluorescence intensity changes (I/I0) of green channel were normalized to the intensity change of green channel in |QD|M without cell, and all the fluorescence intensity changes (I/I0) of red channel were normalized to the intensity change of red channel in |QD|M without cell. Each fluorescence response is an average of six parallel measurements and the error bars represent standard deviation. (For interpretation of the references to color in this figure legend, the reader is referred to the web version of this article.)
3.3. Discrimination of different cancer cell types
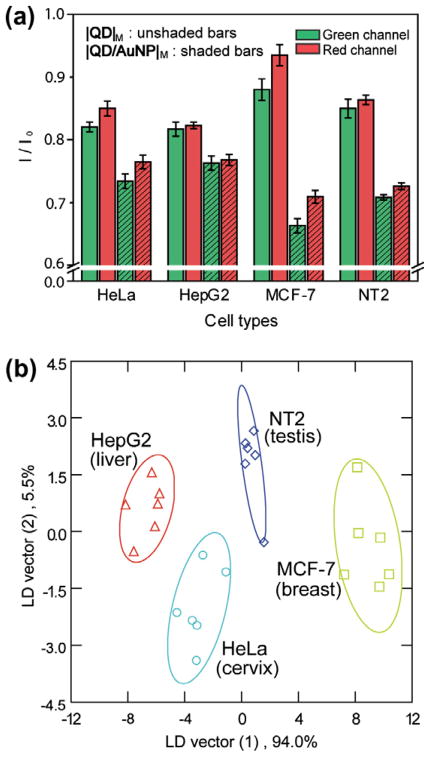
The above experimental results imply that cell surfaces act as platforms to provide unique micro-environments, resulting in distinct assembly of nanoparticles around different cell types that generate distinguishing fluorescence responses for each cell type. As a preliminary test of selective interaction between particles and cell surfaces, four types of human cancer cells from different organs were discriminated using the particle-based sensor: HeLa (cervical), HepG2 (liver), MCF-7 (breast), and NT2 (testis). Each cell suspension (10 μL in DPBS) was added into |QD|M and |QD/AuNP|M solutions (200 μL) in six replicates. Owing to the diverse cell membrane compositions and the variety of nanoparticle surfaces, nanoparticles interacting with the different cell surfaces generated different fluorescence responses in |QD|M and |QD/AuNP|M (Fig. 4a). The ratios of final to initial fluorescence intensities showed a distinct pattern characteristic of each cell type. We used linear discriminant analysis (LDA) to statistically characterize the fluorescence responses and classify these cells into different groups according to their response signatures. LDA generated canonical factors that were linear combinations of the response patterns (4 sensor elements × 4 cell types). Using the first two canonical factors that contained 94.0% and 5.5% of the variation, we plotted the fluorescence responses against these four cancer cells. As shown in Fig. 4b, the cell lines were classified into four distinct clusters with 100% accuracy (95% confidence ellipses). Overall, this simple sensor could efficiently distinguish between cancer cells, exploiting their cell surface signatures.
Fig. 4.
Differentiation of four types of human cancer cells. (a) Fluorescence changes of the nanoparticle mixtures (|QD|M and |QD/AuNP|M) after the incubation with different cell lines. Each response was averaged by six parallel measurements. (b) Canonical plots for the obtained fluorescence patterns with LDA against four cell lines.
3.4. Discrimination of isogenic cell states
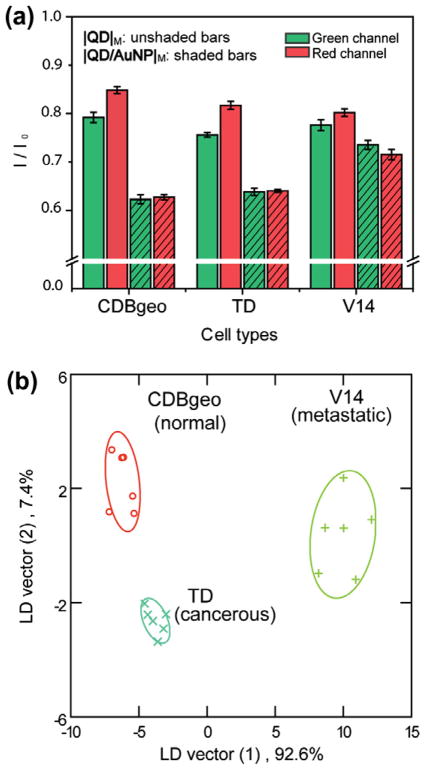
Isogenic cells with the same genetic background provide an important testbed for sensor validation on subject-to-subject variability. To verify the ability of the sensor to differentiate between isogenic normal, cancerous, and metastatic cells, we used three cell lines derived from BALB/c mice. CDBgeo cells, with normal outgrowths, were prepared by retroviral infection with a marker gene encoding the fusion of β-galactosidase and neomycin resistance. Tumorigenic TD cells were prepared by treating CDBgeo cells with 10 ng/mL TGF-β for 14 days [35] followed by withdrawal for five passages. V14 cell line was established from a primary mammary tumor in BALB/c-Trp53+/− mice [36]. These cells lack p53 protein and possess a metastatic characteristic in mice. The training set contained 2 nanoparticle mixtures (|QD|M and |QD/AuNP|M) × 3 isogenic cells × 6 replicates. Fig. 5a represents the fluorescence responses from |QD|M and |QD/AuNP|M upon incubation with the cells. The fluorescence patterns were found to be very distinct and reproducible. LDA clustered the responses from the three isogenic cell lines into three non-overlapping groups (95% confidence ellipses, and 100% identification accuracy) with two canonical factors containing 92.6% and 7.4% of the variation.
Fig. 5.
Differentiation of three isogenic cell lines. (a) Fluorescence changes of the nanoparticle mixtures (|QD|M and |QD/AuNP|M) after the incubation with different cells. Each response was averaged by six parallel measurements. (b) Canonical plots for the obtained fluorescence patterns with LDA against three isogenic cell lines.
These results demonstrate the ability of this simple sensing array to fully discriminate between the isogenic normal, metastatic, and cancerous cells based on the subtle changes on their cell surfaces. The detection limit in our sensing system was ~ 10,000 cells with only 15 min of response time. Furthermore, we observed 100% identification accuracy of 30 unknown samples, validating the robustness of the sensor (see Supporting information).
4. Conclusion
We have successfully demonstrated the ability of a nanoparticle-based sensing system to discriminate four types of cancer cells as well as isogenic normal, cancerous, and metastatic cells. Notably, the sensing approach relies on the phenotypic differences in the physicochemical properties of cell surfaces. In the sensor, the use of QDs as both the recognition elements and transducers not only presented a stable signal transduction and the simultaneous signal acquisition from a single well of the microplate, but also provided a ‘toolkit’ for direct visualization of selectivity-based cell surface interactions. Taken together, this unbiased sensor provides a simple but effective method to profile different cell types and states, with the potential of cell surface sensing and imaging for point-of-care diagnosis.
Supplementary Material
Acknowledgments
This work was supported by the NSF Center for Hierarchical Manufacturing at the University of Massachusetts (CMMI-1025020,), and NIH Grants GM077173. Q. Liu acknowledges support from the China scholarship council for the state scholarship fund.
Appendix A. Supplementary material
Supplementary data associated with this article can be found, in the online version, at http://dx.doi.org/10.1016/j.canlet.2012.09.013.
References
- 1.Jen J, Wu L, Sidransky D. An overview on the isolation and analysis of circulating tumor DNA in plasma and serum. Ann NY Acad Sci. 2000;906:8– 12. doi: 10.1111/j.1749-6632.2000.tb06581.x. [DOI] [PubMed] [Google Scholar]
- 2.Srinivas PR, Kramer BS, Srivastava S. Trends in biomarker research for cancer detection. Lancet Oncol. 2001;2:698–704. doi: 10.1016/S1470-2045(01)00560-5. [DOI] [PubMed] [Google Scholar]
- 3.Yao SL, Lu-Yao G. Interval after prostate specific antigen testing and subsequent risk of incurable prostate cancer. J Urol. 2001;166:861–865. [PubMed] [Google Scholar]
- 4.Ross KS, Carter HB, Pearson JD, Guess HA. Comparative efficiency of prostate-specific antigen screening strategies for prostate cancer detection. J Am Med Assoc. 2000;284:1399–1405. doi: 10.1001/jama.284.11.1399. [DOI] [PubMed] [Google Scholar]
- 5.Brunelleschi S, Penengo L, Santoro MM, Gaudino G. Receptor tyrosine kinases as target for anti-cancer therapy. Curr Pharm Des. 2002;8:1959– 1972. doi: 10.2174/1381612023393530. [DOI] [PubMed] [Google Scholar]
- 6.Jiao Y, Ou W, Meng F, Zhou H, Wang A. Targeting HSP90 in ovarian cancers with multiple receptor tyrosine kinase coactivation. Mol Cancer. 2011;10:1– 12. doi: 10.1186/1476-4598-10-125. [DOI] [PMC free article] [PubMed] [Google Scholar]
- 7.Ingvarsson J, Wingren C, Carlsson A, Ellmark P, Wahren B, Engstrom G, Harmenberg U, Krogh M, Peterson C, Borrebaeck CAK. Detection of pancreatic cancer using antibody microarray-based serum protein profiling. Proteomics. 2008;8:2211–2219. doi: 10.1002/pmic.200701167. [DOI] [PubMed] [Google Scholar]
- 8.Sánchez-Carbayo M. Use of high-throughput DNA microarrays to identify biomarkers for bladder cancer. Clin Chem. 2003;49:23–31. doi: 10.1373/49.1.23. [DOI] [PubMed] [Google Scholar]
- 9.Wollscheid B, Bausch-Fluck D, Henderson C, O’Brien R, Bibel M, Schiess R, Aebersold R, Watts JD. Mass-spectrometric identification and relative quantification of N-linked cell surface glycoproteins. Nat Biotechnol. 2009;27:378–386. doi: 10.1038/nbt.1532. [DOI] [PMC free article] [PubMed] [Google Scholar]
- 10.Marrero JA, Su GL, Wei W, Emick D, Conjeevaram HS, Fontana RJ, Lok AS. Des-gamma carboxyprothrombin can differentiate hepatocellular carcinoma from nonmalignant chronic liver disease in American patients. Hepatology. 2003;37:1114–1121. doi: 10.1053/jhep.2003.50195. [DOI] [PubMed] [Google Scholar]
- 11.Sánchez-Carbayo M. Antibody arrays: technical considerations and clinical applications in cancer. Clin Chem. 2006;52:1651–1659. doi: 10.1373/clinchem.2005.059592. [DOI] [PubMed] [Google Scholar]
- 12.Umali AP, Anslyn EV. A general approach to differential sensing using synthetic molecular receptors. Curr Opin Chem Biol. 2010;14:685–692. doi: 10.1016/j.cbpa.2010.07.022. [DOI] [PMC free article] [PubMed] [Google Scholar]
- 13.Scott MD, Dutta R, Haldar MK, Guo B, Friesner DL, Mallik S. Differentiation of prostate cancer cells using flexible fluorescent polymers. Anal Chem. 2012;84:17–20. doi: 10.1021/ac202301k. [DOI] [PMC free article] [PubMed] [Google Scholar]
- 14.Bajaj A, Miranda OR, Phillips R, Kim IB, Jerry DJ, Bunz UHF, Rotello VM. Array-based sensing of normal, cancerous, and metastatic cells using conjugated fluorescent polymers. J Am Chem Soc. 2010;132:1018–1022. doi: 10.1021/ja9061272. [DOI] [PMC free article] [PubMed] [Google Scholar]
- 15.El-Boubbou K, Zhu DC, Vasileiou C, Borhan B, Prosperi D, Li W, Huang XF. Magnetic glyco-nanoparticles: a tool to detect, differentiate, and unlock the glyco-codes of cancer via magnetic resonance imaging. J Am Chem Soc. 2010;132:4490–4499. doi: 10.1021/ja100455c. [DOI] [PubMed] [Google Scholar]
- 16.Bajaj A, Rana S, Miranda OR, Yawe JC, Jerry DJ, Bunz UHF, Rotello VM. Cell surface-based differentiation of cell types and cancer states using a gold nanoparticle-GFP based sensing array. Chem Sci. 2010;1:134–138. [Google Scholar]
- 17.Bajaj A, Miranda OR, Kim IB, Phillips RL, Jerry DJ, Bunz UHF, Rotello VM. Detection and differentiation of normal, cancerous, and metastatic cells using nanoparticle-polymer sensor arrays. Proc Natl Acad Sci USA. 2009;106:10912–10916. doi: 10.1073/pnas.0900975106. [DOI] [PMC free article] [PubMed] [Google Scholar]
- 18.Wagner MK, Li F, Li J, Li XF, Le XC. Use of quantum dots in the development of assays for cancer biomarkers. Anal Bioanal Chem. 2010;397:3213–3224. doi: 10.1007/s00216-010-3847-9. [DOI] [PubMed] [Google Scholar]
- 19.Resch-Genger U, Grabolle M, Cavaliere-Jaricot S, Nitschke R, Nann T. Quantum dots versus organic dyes as fluorescent labels. Nat Methods. 2008;5:763–775. doi: 10.1038/nmeth.1248. [DOI] [PubMed] [Google Scholar]
- 20.Medintz IL, Uyeda HT, Goldman ER, Mattoussi H. Quantum dot bioconjugates for imaging, labelling and sensing. Nat Mater. 2005;4:435– 446. doi: 10.1038/nmat1390. [DOI] [PubMed] [Google Scholar]
- 21.Pons T, Medintz IL, Sapsford KE, Higashiya S, Grimes AF, English DS, Mattoussi H. On the quenching of semiconductor quantum dot photoluminescence by proximal gold nanoparticles. Nano Lett. 2007;7:3157–3164. doi: 10.1021/nl071729+. [DOI] [PubMed] [Google Scholar]
- 22.Yeh YC, Patra D, Yan B, Saha K, Miranda OR, Kim CK, Rotello VM. Synthesis of cationic quantum dots via a two-step ligand exchange process. Chem Commun. 2011;47:3069–3071. doi: 10.1039/c0cc04975a. [DOI] [PubMed] [Google Scholar]
- 23.Teranishi T, Hasegawa S, Shimizu T, Miyake M. Heat-induced size evolution of gold nanoparticles in the solid state. Adv Mater. 2001;13:1699–1701. [Google Scholar]
- 24.De M, Rana S, Akpinar H, Miranda OR, Arvizo RR, Bunz UHF, Rotello VM. Sensing of proteins in human serum using conjugates of nanoparticles and green fluorescent protein. Nat Chem. 2009;1:461–465. doi: 10.1038/nchem.334. [DOI] [PMC free article] [PubMed] [Google Scholar]
- 25.You CC, Miranda OR, Gider B, Ghosh PS, Kim IB, Erdogan B, Krovi SA, Bunz UHF, Rotello VM. Detection and identification of proteins using nanoparticle–fluorescent polymer ‘chemical nose’ sensors. Nat Nanotechnol. 2007;2:318–323. doi: 10.1038/nnano.2007.99. [DOI] [PubMed] [Google Scholar]
- 26.Hostetler MJ, Templeton AC, Murray RW. Dynamics of place-exchange reactions on monolayer-protected gold cluster molecules. Langmuir. 1999;15:3782–3789. [Google Scholar]
- 27.Cho EC, Xie J, Wurm PA, Xia Y. Understanding the role of surface charges in cellular adsorption versus internalization by selectively removing gold nanoparticles on the cell surface with a I2/KI etchant. Nano Lett. 2009;9:1080–1084. doi: 10.1021/nl803487r. [DOI] [PubMed] [Google Scholar]
- 28.Moyano DF, Goldsmith M, Solfiell DJ, Landesman-Milo D, Peer D, Rotello VM. Nanoparticle hydrophobicity dictates immune response. J Am Chem Soc. 2012;134:3965–3967. doi: 10.1021/ja2108905. [DOI] [PMC free article] [PubMed] [Google Scholar]
- 29.Tan SJ, Jana NR, Gao S, Patra PK, Ying JY. Surface ligand dependent cellular interaction, subcellular localization, and cytotoxicity of polymer-coated quantum dots. Chem Mater. 2010;22:2239–2247. [Google Scholar]
- 30.Chompoosor A, Saha K, Ghosh PS, Macarthy DJ, Miranda OR, Zhu ZJ, Arcaro Kathleen F, Rotello VM. The role of surface functionality on acute cytotoxicity, ROS generation and DNA damage by cationic gold nanoparticles. Small. 2010;6:2246–2249. doi: 10.1002/smll.201000463. [DOI] [PMC free article] [PubMed] [Google Scholar]
- 31.Alberts AJB, Lewis J, Raff M, Roberts K, Walter P. Molecular biology of the cell, garland science. Taylor and Francis Group; New York: 2002. [Google Scholar]
- 32.Zhang F, Ali Z, Amin F, Riedinger A, Parak WJ. In vitro and intracellular sensing by using the photoluminescence of quantum dots. Anal Bioanal Chem. 2010;397:935–942. doi: 10.1007/s00216-010-3609-8. [DOI] [PubMed] [Google Scholar]
- 33.Wang LY, Kan XW, Zhang MC, Zhu CQ, Wang L. Fluorescence for the determination of protein with functionalized nano-ZnS. Analyst. 2002;127:1531–1534. doi: 10.1039/b206587h. [DOI] [PubMed] [Google Scholar]
- 34.Swierczewska M, Lee S, Chen X. The design and application of fluorophore–gold nanoparticle activatable probes. Phys Chem Chem Phys. 2011;13:9929–9941. doi: 10.1039/c0cp02967j. [DOI] [PMC free article] [PubMed] [Google Scholar]
- 35.Deugnier MA, Faraldo MM, Teuliere J, Thiery JP, Medina D, Glukhova MA. Isolation of mouse mammary epithelial progenitor cells with basal characteristics from the Comma-Dβ cell line. Dev Biol. 2006;293:414–425. doi: 10.1016/j.ydbio.2006.02.007. [DOI] [PubMed] [Google Scholar]
- 36.Blackburn AC, McLary SC, Naeem R, Luszcz J, Stockton DW, Donehower LA, Mohammed M, Mailhes JB, Soferr T, Naber SP, Otis CN, Jerry DJ. Loss of heterozygosity occurs via mitotic recombination in Trp53+/− mice and associates with mammary tumor susceptibility of the BALB/c strain. Cancer Res. 2004;64:5140–5147. doi: 10.1158/0008-5472.CAN-03-3435. [DOI] [PubMed] [Google Scholar]
Associated Data
This section collects any data citations, data availability statements, or supplementary materials included in this article.


