

Abstract
Tissue-specific stem cells can be coaxed or harvested for tissue regeneration. In this study, we identified and characterized a new type of stem cells from the synovial membrane of knee joint, named neural crest cell-like synovial stem cells (NCCL-SSCs). NCCL-SSCs showed the characteristics of neural crest stem cells: they expressed markers such as Sox10, Sox17, and S100, were clonable, and could differentiate into neural lineages as well as mesenchymal lineages, although NCCL-SSCs were not derived from neural crest during the development. When treated with transforming growth factor 1 (TGF-1), NCCL-SSCs differentiated into mesenchymal stem cells (MSCs), lost the expression of Sox17 and the differentiation potential into neural lineages, but retained the potential of differentiating into mesenchymal lineages. To determine the responses of NCCL-SSCs to microfibrous scaffolds for tissue engineering, electrospun composite scaffolds with various porosities were fabricated by co-electrospinning of structural and sacrificial microfibers. The increase of the porosity in microfibrous scaffolds enhanced cell infiltration in vitro and in vivo, but did not affect the morphology and the proliferation of NCCL-SSCs. Interestingly, microfibrous scaffolds with higher porosity increased the expression of chondrogenic and osteogenic genes but suppressed smooth muscle and adipogenic genes. These results suggest that the differentiation of NCCL-SSCs can be controlled by both soluble chemical factors and biophysical factors such as the porosity of the scaffold. Engineering both NCCL-SSCs and scaffolds will have tremendous potential for tissue regeneration.
Keywords: Synovial stem cells, neural crest, electrospinning, scaffold, porosity
1. Introduction
Osteoarthritis represents structural breakdown of the synovial joint, affecting 70 million people in the United States [1]. Thus, there is an urgent need to develop effective treatment for the regeneration of tissues such as cartilage, bone and tendon. Mesenchymal stem cells (MSCs) have been isolated from synovial membrane and show potential for cartilage, bone, and tendon tissue engineering [2]. In addition, bioactive scaffolds with transforming growth factor β3 (TGF-3) or stromal cell derived factor-1 (SDF-1) have been used for in situ cartilage regeneration by recruiting synovial stem cells (SSCs) [3,4]. These results suggest that SSCs are a valuable cell source for both in vitro tissue engineering and in situ knee joint repair. However, the characterization of synovial MSCs is limited to non-specific surface markers such as CD29 and CD44, and whether MSCs exist in synovial membranes at an earlier differentiation stage is not clear. Here we used explant culture to isolate a precursor of MSCs from the synovial membrane, characterized as neural crest cell-like SSCs (NCCL-SSCs), and investigated how soluble chemical factors and scaffold property could regulate the functions of this MSC precursor.
Scaffolds can be fabricated for tissue engineering by various methods. Electrospinning is a highly versatile method that allows the fabrication of porous, nonwoven and three-dimensional fibrous structures with controllable fiber diameter ranging from nano- to micro-scale [5,6], and thus has been used extensively in bone, cartilage, tendon, adipose tissue and muscle tissue engineering [7–9]. However, the porosity of electrospun scaffolds is generally low as a result of densely packed network of interconnected fibers. In order to increase the porosity of electrospun scaffolds for cell infiltration, many approaches have been investigated, including using a rotating metal-frame cylinder with different rotation speeds [10], tailoring fiber diameter [11], combining nano- and microfibers [9], using NaCl crystals as porogen agents [12], post-processing by laser ablation [13] or ultraviolet radiation treatment [14], and incorporation of sacrificial fibers [15]. Here, we utilized co-electrospinning method to create microfibrous scaffold with various numbers of sacrificial fibers and thus varying porosity. In this study, we investigated the effect of scaffold porosity as a biophysical cue of extracellular matrix (ECM) on SSC differentiation, which is not well understood compared to the effects of soluble biochemical stimuli [16].
2. Materials and Methods
2.1. Cell isolation
The synovial membrane was isolated from the knee joints of Sprague Dawley (SD) rats under a dissecting microscope. Tissue segments were washed three times with phosphate buffered saline (PBS) supplemented with 1% penicillin/streptomycin (P/S), cut into mm-size and placed onto the surface of 6-well plates coated with 1% CellStart (Invitrogen Corp.), and maintained at 37°C in an incubator with 5% CO2. The cells were cultured in DMEM with 2% chick embryo extract (CEE) (MP Biomedical, Inc.), 1% FBS, 1% N2 supplement (Invitrogen Corp.), 2% B27 supplement (Invitrogen Corp.), 100 nM retinoic acid (RA) (Sigma-Aldrich, Inc.), 50 nM 2-mercaptoethanol (Sigma-Aldrich, Inc.), 1% P/S and 20 ng/ml bFGF (R&D Systems, Inc). Cells migrated out from the tissues within 3 days. Cells were also isolated from synovial membranes of Wnt1-Cre/LoxP-yellow fluorescence protein (YFP) mouse [17] by using the same method.
2.2. Immunostaining and dye staining
For immunostaining, cells were fixed with 4% paraformaldehyde, permeabilized with 0.5% Triton X-100 (Sigma-Aldrich, Inc.), and blocked with 1% bovine serum albumin (BSA) (Sigma-Aldrich, Inc.). Samples were incubated with specific primary antibodies against Sox10 (R&D systems), Sox17 (R&D systems), Snail (Santa Cruz Biotechnology, Inc.), Pax-3/7 (Santa Cruz Biotechnology, Inc.), Slug (Santa Cruz Biotechnology, Inc.), vimentin (DAKO), NG2 (Millipore), S100 calcium binding protein B positive (S100β) (Sigma-Aldrich), neural filament-medium polypeptide (NFM) (Sigma-Aldrich, Inc.), glial fibrillary acidic protein (GFAP) (Millipore), neuronal class III β-Tubulin (TUJ1) (Chemicon), smooth muscle α-actin (SMA) (Epitomics, Inc), smooth muscle myosin heavy chain (SM-MHC) (Santa Cruz Biotechnology, Inc.), calponin-1 (CNN-1) (Epitomic, Inc.) and Collagen II (Chemicon) for 2 hours at room temperature, washed with PBS for 3 times, and incubated with appropriate Alexa 488- and/or Alexa 546-labeled secondary antibodies (Molecular Probes, Inc.). Nuclei were stained with DAPI (Invitrogen Corp.). Fluorescence images were collected using a Zeiss LSM710 confocal microscope (Carl Zeiss MicroImaging). For organic dye staining, cells were fixed with 4% paraformaldehyde for 30 min, washed and stained with alizarin red (Sigma-Aldrich, Inc.), alcian blue (Sigma-Aldrich, Inc.), or oil red (Sigma-Aldrich, Inc.) according to the instruction of the manufacturers. Images were collected using a Zeiss Axioskop 2 plus microscope.
2.3. Flow cytometry analysis
For flow cytometry analysis, cells were dissociated after the exposure to 0.2% EDTA for 20 min at room temperature. The cells in suspension were blocked with 1% BSA, incubated with specific pre-conjugated primary antibodies against CD29 (BD Pharmingen) and CD44 (BD Pharmingen). Negative control sample was incubated with a non-specific antibody with the same isotype as the specific primary antibody, and stained with the same secondary antibody. 7-AAD (BD Pharmingen) was used to exclude dead cells. Cells were analyzed by using FACScan flow cytometer (Becton Dickinson, Inc.) and FlowJo software (Tree Star, Inc.).
2.4. Single cell cloning and stem cell differentiation
For the clonal assays, cells were detached, resuspended with maintenance medium, and filtered through membranes with 40-μm pore size to obtain single cells. Filtered cells were seeded onto CellStart-coated 96-well plates at the clonal density (1 cell/well) and cultured for 3 weeks at 37°C in an incubator with 5% CO2. For the directed differentiation into peripheral neuron-like cells, Schwann-like cells, osteoblasts, adipocytes and chondrocytes, the cells were incubated in specific induction media for 1–3 weeks as described previously [18,19].
2.5. Fabrication of PLLA and PLLA/PGA microfibrous scaffolds
To produce single-polymer poly(L-lactide) (PLLA) (1.09 dL/g inherent viscosity, MW ~131,000) (Lactel Absorbable Polymers) microfibrous scaffolds (as control scaffolds), we performed electrospinning as described previously [14]. In addition, we used PLLA to make structural fiber and poly (glycolic acid) (PGA) (MW ~100,000) (Polysciences, Inc.) to make fast-degrading sacrificial fibers, and fabricated composite microfibrous scaffolds by co-electrospinning. First, we dissolved PLLA and PGA pellets in hexafluoroisopropanol (HFIP) to prepare PLLA (19% w/v) and PGA (12.5% w/v) solutions respectively. Two 10-mL syringes (loaded in syringe pumps) were filled with PLLA and PGA respectively and fitted with flexible silicon tubing connected to 1.5″ long stainless steel 23G dispensing needles. The two needles were electrically charged by connecting to a +12 kV high-voltage generator, and were placed 90° apart with the PLLA spinneret facing a grounded collecting drum horizontally. For the three types of scaffolds produced (19% w/v PLLA, 19% w/v PLLA/12.5% w/v PGA (low) and 19% w/v PLLA/12.5% w/v PGA (high)), a random orientation of microfibers was achieved by using a low speed of rotation (200 rpm) for the collecting drum. We altered the flow rate and gap distance (distance between needle tip and collecting drum) conditions for PGA to generate two different composite scaffolds with varying numbers of PGA fibers. Briefly, the PGA solution was delivered at a flow rate of 0.4 ml/hr and gap distance of 7 cm for one type of composite scaffold with lower PGA content (referred to as PLLA/PGA (low)) and at a higher flow rate of 1 ml/hr and a shorter gap distance of 4 cm for another type of composite scaffold with higher PGA content (referred to as PLLA/PGA (high)). Depending on the collecting time, finalized microfibrous scaffolds were approximately 200–350 μm in thickness based on measurements with a thickness gauge (Mitutoyo America).
To degrade the microfibrous scaffolds and selectively remove the PGA sacrificial fibers from co-electrospun composite scaffolds, we prepared 1-cm × 1-cm scaffolds and degraded them in phosphate saline buffer (PBS) at 37ºC for 2 weeks or 4 weeks. Due to acidic polymer remnants as a result of random hydrolytic degradation, PBS was changed every other day throughout the study. The 2-week and 4-week post-degraded (PD) scaffolds as well as the as-spun (AS) scaffolds without degradation were examined and imaged with a field emission scanning electron microscope (SEM) (TM-1000, Hitachi). Furthermore, to confirm the removal of PGA sacrificial fibers, we performed Fourier transform infrared (FTIR) spectrometry with a FTIR spectrometer (Nicolet Avatar 360, Thermo Fisher Scientific) on the AS and 4-week PD scaffolds from the PLLA and PLLA/PGA (high) groups as described previously [20].
2.6. Characterization of porosity and mechanical properties of microfibrous scaffolds
We conducted image analysis using Matlab and Image J on the SEM micrographs (three micrographs per scaffold group) to generate histograms of the pore size distribution as well as to approximate the average pore diameter (d) as previously described [21]:
where l and h are the maximum and minimum pore lengths respectively.
To quantify the porosity of the electrospun scaffolds, we used gravimetric analysis as previously described [9] with minor modifications. Briefly, 20 samples from each of the AS scaffold groups were prepared. Thickness, width, and length measurements of each sample were taken and recorded. Prior to degradation, each sample was weighed; after 2-week and 4-week degradation, the samples were air-dried and weighed again to determine their apparent density. Lastly, the porosity was calculated using the following formula:
where ρapparent = masssample/volumesample and ρbulk scaffold = (massPLLA/masstotal)(ρPLLA) + (massPGA/masstotal)(ρPGA).
To determine the mechanical strength of the scaffolds, at least three samples from each scaffold group were air-dried and then subjected to uniaxial tensile testing in the longitudinal direction using an Instron 5544 tester (Instron) as previously described [13]. The applied force and deformation were recorded every second via Bluehill software (Instron). Elastic modulus was calculated by determining the slope from the applied force and scaffold deformation in the linear region of the stress-strain curve between 5–10% strain.
2.7. In vitro and in vivo cell infiltration
The 4-week PD scaffolds from the PLLA group, the PLLA/PGA (low) group, and the PLLA/PGA (high) group were selected and used for subsequent cell studies because of their significant porosity difference. For the cell studies in vitro, the cells were cultured in maintenance media as described previously in Section 2.1. Scaffolds were cut into 0.5-cm × 0.5-cm squares and secured to non-tissue-culture-treated polystyrene dishes via double-sided tape. Prior to cell seeding, these scaffolds were disinfected in 70% ethanol under germicidal ultraviolet light for 30 minutes, and subsequently washed with sterile deionized water for five times. The scaffolds were then immersed in 1% fibronectin (Sigma-Aldrich, Inc.) for 60 minutes at 37ºC and washed once with PBS before cell seeding.
To assess the effect of scaffold degradation on cell infiltration in vitro, approximately 100,000 stem cells were seeded onto each of the scaffolds followed by 30 minutes of incubation to allow for cell attachment. After incubation, sufficient media (DMEM + 10% FBS) was added to each dish. At day 7, the scaffold samples were fixed with 4% paraformaldehyde (PFA) and stained with DAPI for cell nucleus. Cross-sections of 20-μm thickness were generated in the transverse plane using a −20ºC cryosectioner. The fluorescent DAPI signals from the cells within these cross-sections were viewed with the Zeiss LSM710 confocal microscope. A minimum of 6 cryosections were examined for each scaffold to confirm consistency.
To evaluate the effect of the removal of sacrificial PGA fibers on cell infiltration in vivo, we utilized a rat subcutaneous cell infiltration model as described previously [14]. All experimental procedures with animals were approved by the ACUC committee at University of California, Berkeley. Briefly, three scaffolds from each of the three 4-week PD groups were implanted in the subcutaneous cavity of SD rats. On day 7, the scaffolds, along with their immediate surrounding tissue, were explanted and immediately fixed with 4% PFA before being embedded in OCT on dry ice. Cross-sections of 10-μm thickness were generated in the transverse plane using a −20ºC cryosectioner. The sections were stained with DAPI, and observed under the Zeiss LSM710 confocal microscope. A minimum of 6 cryosections were examined for each scaffold to confirm consistency between sections.
Cell infiltration in vitro was quantified as a percentage of total thickness by measuring the depth of infiltration (normalized to the entire scaffold thickness) of individual cells from the initial seeding surface. Likewise, cell infiltration in vivo was quantified also as a percentage of thickness by measuring the penetration depth (normalized to half of each scaffold’s thickness) of individual cells from the surface of the scaffold.
2.8. In vitro cell morphology and proliferation
For cell morphology study, microfibrous scaffolds from the three 4-week PD groups were prepared via the same protocol as described above. Approximately 40,000 cells were seeded onto scaffolds from the 3 groups After 30-minute incubation, sufficient media (DMEM + 10% FBS) was added to each dish. To visualize cell morphology and spreading, scaffolds were processed as described [22]. Briefly, samples were stained with Alexa Fluor 488 phalloidin and DAPI for actin filaments and cell nuclei, respectively.
For cell proliferation study, approximately 75,000 cells were seeded onto each of the scaffolds from the three groups via the same protocol as described above. Samples were fixed after 24 hours with 4% PFA, permeabilized, and immunostained for the proliferation marker Ki67 (Abcam, Inc.) along with DAPI nuclear counterstain. Image J was used to quantify the number of Ki67+ cells. Three scaffolds were examined and quantified for each scaffold group.
2.9. RNA Isolation and quantitative PCR (qPCR)
To directly explore the effect of cell infiltration on lineage specific gene expression of stem cells, approximately 1,000,000 cells were seeded on 3-cm × 3-cm scaffolds and cultured in spontaneous differentiation media (DMEM + 10% FBS + 1% P/S) for 1 week. Cells were then lysed with Trizol reagent (Invitrogen Corp.) and total RNA was extracted as previously described [23]. For qPCR, RNA pellets were resuspended in diethyl pyrocarbonate (DEPC)-treated H2O. cDNA was synthesized by using two-step reverse transcription with the ThermoScript RT-PCR system (Invitrogen Corp.), followed by qPCR with SYBR green reagent and the ABI Prism 7000 Sequence Detection System (Applied Biosystems). The sequences of the primers used in this study are listed in Supplementary Table 1.
2.10. Statistical Analysis
The data are presented as mean ± standard deviation. All data were compared by using one-way ANOVA tests. Holm’s t test was then performed to evaluate significant differences among the scaffold groups. P value less than 0.05 was considered statistically significant.
3. Results and Discussion
3.1. Cell isolation and characterization
We dissected the synovial membrane from rat knee joint under dissecting microscope and used tissue explant culture method to isolate stem cells with a modified medium for neural crest stem cells (NCSCs). The isolated synovial cells showed a fibroblast-like, spindle shaped morphology (Fig. 1A–B). The isolated cells express general MSC markers, including CD29 and CD44, as evidenced by flow cytometry analysis (Fig. 1C–D). To further characterize the marker expression of the isolated synovial cells, we performed protein marker expression screening with over 50 antibodies and found that the isolated cells also express neural crest markers including Sox10, snail, Pax-3/7, Slug, vimentin, endoderm markers Sox17, progenitor marker NG2, glial cell marker S100β, and neural cell marker NFM (Fig. 1E–M). These markers have not been reported in synovial MSC characterization, suggesting that the isolated cells might not be the same as previously identified MSCs.
Figure 1. Isolation and characterization of NCCL-SSCs.

(A–B) Phase contrast images of isolated synovial cells by using tissue explant culture method before and after passaging. Scale bar is 200 μm. (C–D) Flow cytometry analysis of isolated synovial cells by using antibodies against CD29 and CD44. (E–M) Immunostaining of isolated cells by using antibodies against Sox10, Sox17, Snail, Pax-3/7, Slug, vimentin, NG2, S100β and NFM. Scale bars are 100 μm.
To determine whether the isolated cells possess multipotency as NCSCs, the cells were cultured with specific induction media for 1–4 weeks. Immunostaining showed that the isolated cells can differentiate into GFAP+/S100β+ Schwann cell-like cells (Fig. 2A–B) and NFM+/TUJ1+ peripheral neuron-like cells (Fig. 2C–D) when cultured with specific neural induction media, indicating that they have the capability of differentiating into ectodermal lineages. However, further studies are required to determine whether the derived neural cells are functional. In addition, to test the potential of differentiation into smooth muscle cells (SMCs), we co-cultured the isolated cells with OP9-Delta-1 cell line for 2 weeks [24]. Immunostaining showed that the differentiated cells formed dense stress fibers and expressed SMA and SM-MHC (Fig. 2E–F), indicating the differentiation into mature SMCs. Furthermore, to test the chondrogenic differentiation potential, we cultured the cells as pellets with 10 ng/ml TGF-3 for 3 weeks. Alcian blue staining with sections of cell pellets showed significant aggrecan synthesis (Fig. 2G). Immunostaining also showed significant collagen II expression in the cell pellets (Fig. 2H), indicating chondrogenic differentiation. After we cultured the cells in adipogenic medium with insulin for 3 weeks, obvious oil droplets were found in culture (Fig. 2I). Oil red staining confirmed the differentiation into adipocytes (Fig. 2J). When the cells were cultured with osteogenic medium for 3 weeks, the cells showed significant calcification (Fig. 2K), as confirmed by Alizarin red staining (Fig. 2L).
Figure 2. Differentiation potential of NCCL-SSCs.
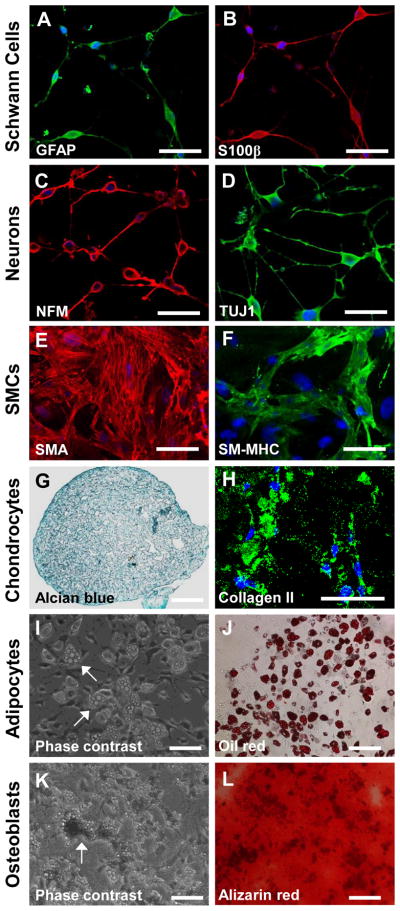
The isolated synovial cells were cultured in cultured in specific induction media. (A–B) The directed Schwann cell-like cells were immunostained by using antibodies against GFAP and S100β. Scale bars are 50 μm. (C–D) The directed peripheral neuron-like cells were immunostained by using antibodies against NFM and TUJ1. Scale bars are 50 μm. (E–F) The directed SMCs were immunostained by using antibodies against SMA and SM-MHC. Scale bars are 100 μm. (G–H) The directed chondrocytes were subjected to alcian blue staining and immunostaining by using an antibody against collagen II. Scale bars are 100 μm. (I–J) The Phase contrast image and oil red staining were used to show oil droplets, as indicated by the white arrows for characterization of directed adipocytes. Scale bars are 100 μm. (K–L) Phase contrast image and alizarin red staining were used to show calcium calcification of directed osteobalsts, as indicated by the white arrow. Scale bars are 100 μm.
In summary, the isolated cells not only could differentiate into mesenchymal lineages including SMCs, chondrocytes, adipocytes, and osteoblasts as previously reported, but also could differentiate into neural lineages, similar to NCSCs. Therefore, we named this type of cell as neural crest cell-like synovial stem cells (NCCL-SSCs).
3.2. Single cell cloning of NCCL-SSCs
To investigate whether the derived NCCL-SSCs is a single stem cell type with multipotency or a mixture of different progenitor cells, we performed single cell cloning in maintenance culture medium. The NCCL-SSCs were detached and seeded into 96-well plates at cloning density (1 cell/well) and cultured for 3 weeks. The average plating efficiency is about 10%, and the derived colonies uniformly express aforementioned markers including but not limited to Sox10 and Sox17 (Fig. 3A–B). Differentiation assay showed that the cloned NCCL-SSCs can differentiate into Schwann cell-like cells, peripheral neuron-like cells, SMCs, chondrocytes, adipocytes, and osteoblasts (Fig. 3C–H), indicating that NCCL-SSCs indeed are a type of multipotent stem cells, providing a valuable cell source for tissue engineering.
Figure 3. Single cell cloning of NCCL-SSCs.
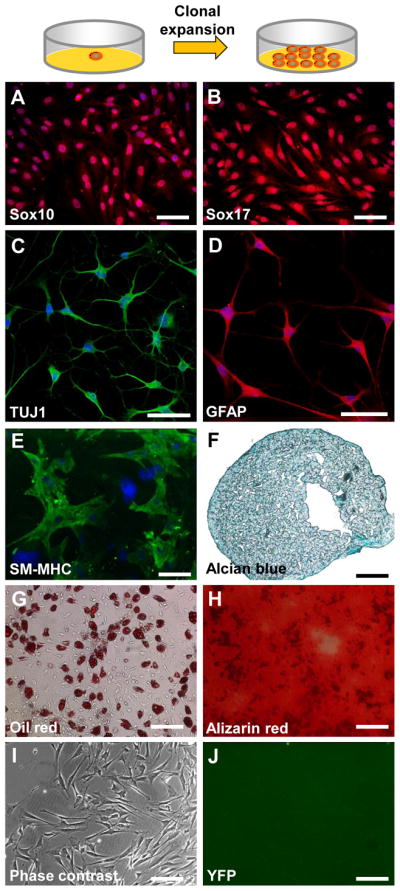
The isolated synovial cells were plated onto 96-well plates at cloning density and cultured in maintenance medium for 3 weeks. (A–B) The cloned cells were immunostained with antibodies against Sox10 and Sox17. Scale bars are 100 μm. (C–H) The cloned cells were differentiated and characterized as in Figure 1. Scale bars are 100 μm in C–E; scale bars are 200 μm in F–H. (I–J) The synovial cells were isolated from Wnt1-Cre/LoxP-YFP mice. Phase contrast and fluorescence images are used to show that the isolated synovial cells were not derived from neural crest. Scale bars are 200 μm.
Knee joint tissues are generally not derived from neural crest; however, given the fact that NCCL-SSCs possess NCSC properties, we performed a lineage tracing experiment by using Wnt1 as a marker to investigate the developmental origin of NCCL-SSCs. NCCL-SSCs were isolated from the synovial membrane of a Wnt-1-Cre/loxP-YFP mouse, but we found that the isolated NCCL-SSCs did not express YFP (Fig. 3I–J), suggesting that NCCL-SSCs were not derived from neural crest.
3.3. Transition of NCCL-SSCs into MSCs
To determine the relationship between NCCL-SSCs and previously identified synovial MSCs, we cultured the NCCL-SSCs in a general medium (DMEM + 10% FBS) that was widely used to culture synovial MSCs in previous studies [2,25,26]. TGF-β1 was also added into the medium to promote mesenchymal differentiation. After treatment for 1 week, immunostaining showed that the NCCL-SSCs still retained the expression of some markers including Sox10 and S100β (Fig. 4A–B), gained the expression of CNN1 (Fig. 4C), but lost the expression of Sox17 (Fig. 4D). Flow cytometryic analysis showed that the derived cells still retained the expression of the general MSC markers, including CD29 and CD44 (Fig. 4E–F). However, differentiation assay showed that the cells at this stage lost the response to neural and Schwann cell induction media, indicating that they lost the potential of differentiating into neural lineages (Fig. 4G–H). Immunostaining also confirmed that the cells shown in Figure 4G–H were negative for neural and Schwann cell marker such as GFAP and TUJ1 (data not shown). However, the cells at this stage could still differentiate into SMCs, chondrocytes, osteoblasts, and adipocytes (Fig. 4I–L), suggesting a transition or differentiation into MSCs. Therefore, it is likely that previously identified synovial MSCs are partially differentiated NCCL-SSCs in undefined medium.
Figure 4. Mesenchymal transition of NCCL-SSCs.
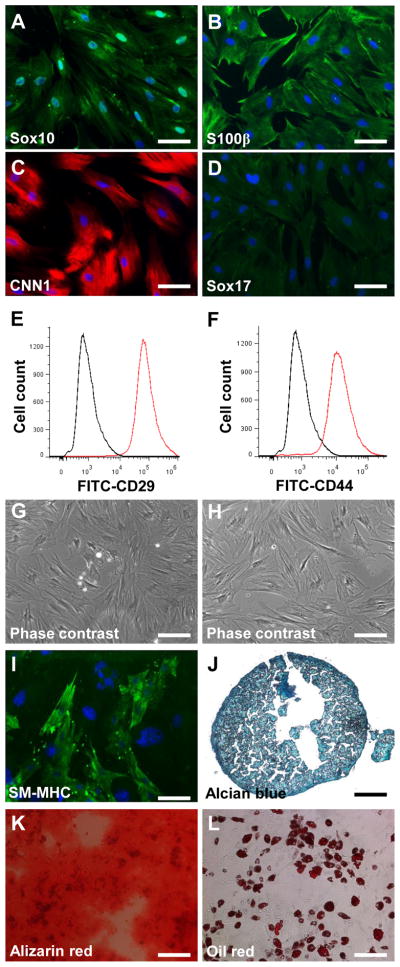
The isolated NCCL-SSCs were partially differentiated in DMEM with 10% FBS and 10 ng/ml TGF-β1 for 1 week. (A–D) The differentiated NCCL-SSCs were immunostained with antibodies against Sox10, S100β, CNN1 and Sox17. Scale bars are 100 μm. (E–F) Flow cytometry analysis of differentiated NCCL-SSCs with antibodies against CD29 and CD44. (G–H) Phase contrast images were used to show the differentiated NCCL-SSCs cultured with neural and Schwann cell induction media. Scale bars are 200 μm. (I–L) The multipotency into mesenchymal lineages of partially differentiated NCCL-SSCs was characterized as in Figure 1. Scale bar is 100 μm in I; scale bars are 200 μm in J–L.
3.4. Fabrication and characterization of microfibrous scaffolds
To determine how NCCL-SSCs responded to microfibrous scaffolds, we fabricated the scaffolds with various porosities by co-electrospinning of slow-degrading PLLA structural fibers and fast-degrading PGA sacrificial fibers [15,27]. In fact, PLLA has a degradation half-life of a year, whereas PGA degrades between 2 and 4 weeks [28,29]. The composite scaffolds contained various numbers of PGA fibers. These sacrificial PGA fibers were subsequently removed by in vitro degradation for 2 and 4 weeks to improve the porosity of the composite scaffolds.
Prior to using the microfibrous scaffolds for biological studies, the AS and PD scaffolds were characterized for fiber architecture via SEM (Fig. 5). We were able to obtain single-polymer PLLA scaffolds as well as composite PLLA/PGA scaffolds with different amounts of PGA content (Fig. 5A, D, G), with fiber diameter ranging from approximately 330 nm to 3.3 μm (Table 1). We then degraded the three types of scaffolds in PBS at 37°C for durations of 2 weeks (Fig. 5B, E, H) and 4 weeks (Fig. 5C, F, I), changing the PBS every other day to prevent the accumulation and retention of acidic byproducts that could have undesired effects on cell behaviors [30]. SEM visualization indicated that the PLLA fibers and overall scaffold structure and integrity remained intact despite the removal of a significant portion of PGA fibers. Using image analysis, we generated histograms to show the apparent two-dimensional (2D) pore size distribution of the different scaffold groups (Supplementary Figure 1) and approximated the average pore diameter as previously described (Table 1) [21], which increased directly with degradation time for both PLLA and PLLA/PGA scaffolds. However, these results may be limited in that analyses were conducted on 2D SEM micrographs, which cannot accurately delineate the geometry and size of the three-dimensional (3D) pores. In addition, utilizing gravimetric analysis to quantify porosity [10,31], we observed a gradual increase in porosity as a result of controlled degradation and the time-dependent removal of sacrificial PGA fibers. After 2-week degradation, the PLLA/PGA (high) scaffolds exhibited a statistically significant increase in porosity compared to the PLLA (control) and PLLA/PGA (low) scaffolds; after 4-week degradation, not only was the porosity of PLLA/PGA (high) scaffolds significantly higher, the porosity of PLLA/PGA (low) scaffolds was also significantly higher compared to the PLLA scaffolds (Fig. 5J). Nevertheless, due to limitations of 2-D image analysis and gravimetric analysis, detailed measurements of porosity and distribution of pore size require further analysis using standardized techniques described in previous study as well as ASTM F316 and F2150, specifically capillary flow porometry [31]. Furthermore, FTIR measurement confirmed that PGA completely disappeared after 4-week degradation, in which characteristic peaks of PGA, including δCH2 bending at 1420 cm−1, were only observed in the AS-PLLA/PGA (high) scaffolds (Fig. 5K) [32].
Figure 5. Characterization of electrospun microfibrous scaffolds.

Scanning electron micrographs were taken of the fabricated electrospun fibrous scaffolds, with 19% PLLA (A–C), 19% PLLA/12.5% PGA (low) (D–F), and 19% PLLA/12.5% PGA (high) (G–I). The scaffolds were as-spun (AS) (A, D, G), 2-week post-degraded (PD) (B, E, H), and 4-week PD (C, F, I). Scale bar is 100 μm. (J) The porosity of the scaffolds was measured and quantified using gravimetric analysis (n>20). * indicates significant difference (P<0.005). (K) FTIR spectra of AS-PLLA (green), 4-wk PD-PLLA (red), AS-PLLA/PGA (high) (yellow), and 4-wk PD-PLLA/PGA (high) (blue) were obtained as the averages of six measurements taken from the two surfaces of three identical samples. The black arrow indicates a characteristic peak of PGA at 1420 cm−1 due to δCH2 bending. (L) The elastic modulus for each scaffold group was calculated from the slope of the curves and the scaffold dimensions (n>3). * indicates significant difference (P<0.0002).
Table 1.
Analysis and Characterization of Electrospun Scaffolds
| Scaffold | Average Fiber Diameter (μm) | Minimum Fiber Diameter (μm) | Maximum Fiber Diameter (μm) | Average Pore Diameter (μm) | Median Pore Size (μm2) |
|---|---|---|---|---|---|
| AS-PLLA | 1.496 ± 0.295 | 0.978 | 2.428 | 2.962 ± 0.262 | 4.75 |
| AS-PLLA/PGA (low) | 0.982 ± 0.360 | 0.328 | 1.547 | 2.667 ± 0.198 | 4.23 |
| AS-PLLA/PGA (high) | 0.772 ± 0.224 | 0.437 | 1.194 | 2.088 ± 0.295 | 4.24 |
| 2-wk PD-PLLA | 1.588 ± 0.459 | 0.661 | 3.287 | 3.339 ± 0.228 | 3.94 |
| 2-wk PD-PLLA/PGA (low) | 1.087 ± 0.325 | 0.478 | 1.672 | 4.751 ± 0.182 | 7.83 |
| 2-wk PD-PLLA/PGA (high) | 1.272 ± 0.228 | 0.956 | 1.774 | 4.875 ± 0.074 | 6.65 |
| 4-wk PD-PLLA | 1.429 ± 0.243 | 0.778 | 1.937 | 6.975 ± 0.784 | 3.78 |
| 4-wk PD-PLLA/PGA (low) | 1.185 ± 0.285 | 0.547 | 1.752 | 7.422 ± 1.336 | 9.36 |
| 4-wk PD-PLLA/PGA (high) | 1.534 ± 0.401 | 0.969 | 2.679 | 9.229 ± 1.749 | 10.40 |
To assess the effects of sacrificial PGA fibers on the mechanical properties of the composite scaffolds, uniaxial tensile testing was performed on AS- and PD-PLLA, PLLA/PGA (low), and PLLA/PGA (high) scaffolds. The elastic moduli calculated from the linear portion of the stress-strain curves of the tested 2-week and 4-week PD scaffolds varied significantly (Fig. 5L). Prior to degradation, AS-PLLA, AS-PLLA/PGA (low), and AS-PLLA/PGA (high) scaffolds had comparable elastic moduli. The elastic moduli of the scaffolds, especially the PD-PLLA/PGA (high) scaffolds, decreased by up to 50% after in vitro-degradation as the sacrificial PGA fibers were removed and larger pores were introduced.
3.5. Effect of sacrificial PGA fiber removal on cell infiltration
We performed in vitro and in vivo experiments to investigate the effects of sacrificial PGA fiber removal on cell infiltration into the microfibrous network of the scaffolds. After culturing NCCL-SSCs on the 4-week PD scaffolds for 1 week, DAPI staining was performed to assess the extent of cell infiltration into the scaffolds. Cross-section images of the scaffolds indicated noticeable difference of cell infiltration into PLLA fiber meshes and composite PLLA/PGA meshes after PGA degradation (Fig. 6A–C). Cell infiltration was limited in PD-PLLA scaffolds (Fig. 6A), while in PD-PLLA/PGA scaffolds, cell infiltration increased with the number of sacrificial PGA fibers (Fig. 6B–C). In fact, cell infiltration quantification indicated that the PLLA/PGA (high) scaffolds exhibited approximately a 7.6-fold and 3-fold increase in cell infiltration compared to the PLLA (control) and PLLA/PGA (low) scaffolds, respectively (Fig. 6G). Thus, the improved cell infiltration into PD-PLLA/PGA scaffolds suggests that the increase in overall porosity and pore size is sufficient to facilitate and increase cell penetration. Although the pore size might be comparable to or smaller than cell size, the cells could deform and migrate through the 3D structure.
Figure 6. In vitro and in vivo cell infiltration into the microfibrous scaffolds.

Scaffolds from 4-week PD-PLLA (A, D), 4-week PD-PLLA/PGA (low) (B, E), and 4-week PD-PLLA/PGA (high) (C, F) were selected and used. (A–C) NCCL-SSCs were seeded and cultured for one week, followed by nucleus (DAPI) staining of the cells in the cross-sections of scaffolds. (D–F) Cellular infiltration into the microfibrous scaffolds in vivo after one week. Scaffolds were implanted subcutaneously between the superficial fascia and contacting muscular layer in the lower abdomen region of SD rats. Nucleus (DAPI) staining of cells in the cross-sections of the scaffolds was performed. Edges of the scaffolds are delineated by the white dashed lines; half of the scaffold thickness is delineated by the yellow dashed lines. Scale bar is 100 μm. Quantitative analyses indicate cell infiltration in vitro with respect to the depth of infiltration as a percentage of total scaffold thickness (n=3) (G), as well as cell infiltration in vivo with respect to the depth of infiltration as a percentage of half of the total scaffold thickness (n=3) (H). ** indicates significant difference (P<0.001). * indicates significant difference (P<0.05).
Furthermore, cell infiltration was further assessed in an in vivo rat subcutaneous cell infiltration model. Scaffolds from the three 4-week PD groups were implanted for 1 week, and the cross-sections were stained with DAPI to visualize the distribution and infiltration of cells throughout the scaffold thickness (Fig. 6D–F). In general, cell infiltration showed the same trend as that in vitro, in which the PLLA/PGA (high) scaffolds exhibited approximately a 2.7-fold and 1.4-fold increase in cell infiltration compared to the PLLA (control) and PLLA/PGA (low) scaffolds, respectively (Fig. 6H). However, although the observed penetration and distribution of cells in vivo were better than those in vitro, it is worth noting that in vivo cell infiltration may involve multiple cell types, including inflammatory cells and fibroblasts.
3.6. Effects of PGA fiber removal on cell morphology and proliferation
Actin staining was used to visualize NCCL-SSCs on the 4-week PD scaffolds after 1-day culture (Fig. 7A–C). No drastic difference in cell morphology on the scaffold surface was observed based upon the qualitative staining. In addition, the quantification of the cell spreading area indicated no statistically significant difference among the three scaffolds (Fig. 7G).
Figure 7. Cell morphology and proliferation on the microfibrous scaffolds.

Scaffolds from 4-week PD-PLLA (A, D), 4-week PD-PLLA/PGA (low) (B, E), and 4-week PD-PLLA/PGA (high) (C, F) were selected and used. NCCL-SSCs were seeded and cultured for one day. (A–C) Cell morphology was visualized by staining the cells with Alexa Fluor 488-phalloidin (actin filaments) and DAPI (nuclei). Scale bar is 50 μm. (D–F) Cell proliferation was quantified by staining for Ki67 (green) and DAPI (blue). Scale bar is 100 μm. Quantitative analyses show the average cell spreading area (G) and the percentage of proliferating cells positive for Ki67 (H) (n=6).
NCCL-SSCs had a cell doubling time of 50 hours, and the cell growth rate did not change significantly within 5 days after being seeded. To determine the effect of microfiber composition and degradation on cell proliferation, Ki67 staining was used to quantify proliferating cells in active phases of the cell cycle after being cultured for 1 day (Fig. 7D–F). There were no significant differences among the 4-week PD groups for PLLA, PLLA/PGA (low), and PLLA/PGA (high) (Fig. 6H). Even though scaffold structure with higher porosity and larger pore size has been shown to generate better cell growth [30], these results suggest that the manipulation of porosity by including and removing sacrificial PGA fibers did not adversely affect cell behaviors such as cell spreading and proliferation.
3.7. Effects of cell infiltration on lineage specification of NCCL-SSCs
To determine whether changes in the scaffold porosity regulate cell differentiation, we cultured the NCCL-SSCs on scaffolds with varying porosity using spontaneous differentiation media without any specific chemical clues for 1 week and analyzed the lineage marker expression. Although 4-week PD-PLLA/PGA (low) scaffolds were included in this study (data not shown), the 4-week PD-PLLA scaffold and 4-week PD-PLLA/PGA (high) scaffold with highest porosity were used as representatives. qPCR revealed that the expression of chondrogenic markers, aggrecan and collagen II, increased in cells on more porous scaffolds (Fig. 8A–B), suggesting that cell infiltration may be more favorable for NCCL-SSCs to differentiate into chondrogenic cells. Likewise, osteogenic markers, including osteocalcin (BGLAP) and Runx2, were increased by 2-fold (Fig. 8C–D), suggesting that cell infiltration may also favor osteoblastic differentiation. In contrast, SMC markers, including SMA and CNN1 (Fig. 8E–F), and adipogenic markers, including LPL and PPARγ (Fig. 8G–H), were significantly decreased. However, the change of porosity was not sufficient to drive the terminal differentiation of NCCL-SSCs, and other biochemical differentiation factors might be needed.
Figure 8. Effect of microfibrous scaffolds on lineage commitment of NCCL-SSCs.

Scaffolds from 4-week PD-PLLA (noted as PLLA) and 4-week PD-PLLA/PGA (high) (noted as PLLA+PGA) were selected and used. NCCL-SSCs were seeded and cultured for one week in spontaneous differentiation media. The cells were lysed and the extracted RNA was subjected to qPCR analysis for gene expression. Expressions of specific lineage markers for chondrocytes (AB), osteoblasts (C–D), SMCs (E–F) and adipocytes (G–H) were normalized to the expression level of 18S rRNA. Graphs were shown as relative fold change (y-axis) compared to PLLA group (n=3). * indicates significant difference (P<0.05).
4. Conclusions
In this study, we identified a precursor of synovial MSCs, i.e., NCCL-SSCs, that are multipotent as they can differentiate into both ectodermal and mesenchymal lineages. Transcriptional factors such as Sox17 and Sox10, instead of the widely used surface markers such as CD29 and CD44, can be used to characterize the differentiation stage of stem cells. The transition from NCCL-SSCs to MSCs may represent a general mechanism of adult stem cell differentiation. In addition, we demonstrated that co-electrospinning could be used to create composite scaffolds and manipulate the scaffold porosity; the inclusion of sacrificial PGA fibers and their subsequent time-dependent removal after controlled degradation significantly enhanced cell infiltration both in vitro and in vivo. Another important finding is that the engineered porosity of the scaffolds differentially regulates NCCL-SSC differentiation without specific chemical cues, indicating that certain properties of scaffolds can be tailored to regulate stem cell behaviors. It appears that porous scaffolds can facilitate cell infiltration and the differentiation into chondrogenic and osteogenic cells while suppressing the differentiation into SMCs and adipogenic cells. However, it remains to be determined whether this observation can be generalized beyond microfibrous scaffolds. Furthermore, how stem cells sense such change of topographic and three-dimensional cues and specify the differentiation lineage need to be elucidated. Although biophysical factors such as the porosity of the scaffolds can regulate stem cell differentiation, biochemical factors may be required to drive the terminal differentiation. Whether inflammation in the diseased tissues affects stem cell behavior also needs further investigation. Our findings on NCCL-SSCs and the regulation by biochemical and biophysical factors not only advance our understanding of adult stem cells, but also provide basis and guidance for the design and fabrication of desirable scaffolds for in situ tissue engineering applications by chemotactic homing of local tissue specific stem cells in specific tissues.
Supplementary Material
Histograms representing the distribution of pore size for each scaffold group were generated using Matlab analysis, with PLLA (A, D, G), PLLA/PGA (low) (B, E, H), and PLLA/PGA (high) (C, F, I). The scaffolds were as-spun (AS) (A–C), 2-week post-degraded (PD) (D–F), and 4-week PD (G–I).
Acknowledgments
The authors thank Dr. Bo Liu and Dr. Jill Helms in Stanford for providing mouse tissues, Kevin Liu for his assistance with Matlab analysis, and Mary West in QB3/CIRM Shared Stem Cell Facility of UC Berkeley for her technical assistance. This work was supported in part by the grants from National Institute of Health (EB012240 to S.L.), a pre-doctoral training grant from California Institute of Regenerative Medicine (TG2-01164 to Z.T.), a pre-doctoral training grant from National Institute of Health (T32GM098218 to B.L.) and Innovation and Attracting Talents Program for College and University (“111” Project of China) (B06023 to L.Y.).
Footnotes
Author Disclosure Statement
The authors have no professional or financial affiliations that would have biased this manuscript.
Publisher's Disclaimer: This is a PDF file of an unedited manuscript that has been accepted for publication. As a service to our customers we are providing this early version of the manuscript. The manuscript will undergo copyediting, typesetting, and review of the resulting proof before it is published in its final citable form. Please note that during the production process errors may be discovered which could affect the content, and all legal disclaimers that apply to the journal pertain.
References
- 1.Kraus VB. Pathogenesis and treatment of osteoarthritis. Med Clin North Am. 1997;81:85–112. doi: 10.1016/s0025-7125(05)70506-x. [DOI] [PubMed] [Google Scholar]
- 2.De Bari C, Dell’Accio F, Tylzanowski P, Luyten FP. Multipotent mesenchymal stem cells from adult human synovial membrane. Arthritis Rheum. 2001;44:1928–1942. doi: 10.1002/1529-0131(200108)44:8<1928::AID-ART331>3.0.CO;2-P. [DOI] [PubMed] [Google Scholar]
- 3.Mendelson A, Frank E, Allred C, Jones E, Chen M, Zhao W, et al. Chondrogenesis by chemotactic homing of synovium, bone marrow, and adipose stem cells in vitro. FASEB J. 2011;25:3496–504. doi: 10.1096/fj.10-176305. [DOI] [PMC free article] [PubMed] [Google Scholar]
- 4.Lee CH, Cook JL, Mendelson A, Moioli EK, Yao H, Mao JJ. Regeneration of the articular surface of the rabbit synovial joint by cell homing: a proof of concept study. Lancet. 2010;376:440–8. doi: 10.1016/S0140-6736(10)60668-X. [DOI] [PMC free article] [PubMed] [Google Scholar]
- 5.Lannutti J, Reneker D, Ma T, Tomasko D, Farson D. Electrospinning for tissue engineering scaffolds. Materials Science and Engineering: C. 2007;27:504–9. [Google Scholar]
- 6.Tan SH, Inai R, Kotaki M, Ramakrishna S. Systematic parameter study for ultra-fine fiber fabrication via electrospinning process. Polymer. 2005;46:6128–34. [Google Scholar]
- 7.Jang JH, Castano O, Kim HW. Electrospun materials as potential platforms for bone tissue engineering. Adv Drug Deliv Rev. 2009;61:1065–83. doi: 10.1016/j.addr.2009.07.008. [DOI] [PubMed] [Google Scholar]
- 8.Bhattarai SR, Bhattarai N, Yi HK, Hwang PH, Cha DI, Kim HY. Novel biodegradable electrospun membrane: scaffold for tissue engineering. Biomaterials. 2004;25:2595–602. doi: 10.1016/j.biomaterials.2003.09.043. [DOI] [PubMed] [Google Scholar]
- 9.Thorvaldsson A, Stenhamre H, Gatenholm P, Walkenström P. Electrospinning of Highly Porous Scaffolds for Cartilage Regeneration. Biomacromolecules. 2008;9:1044–9. doi: 10.1021/bm701225a. [DOI] [PubMed] [Google Scholar]
- 10.Zhu X, Cui W, Li X, Jin Y. Electrospun Fibrous Mats with High Porosity as Potential Scaffolds for Skin Tissue Engineering. Biomacromolecules. 2008;9:1795–801. doi: 10.1021/bm800476u. [DOI] [PubMed] [Google Scholar]
- 11.Soliman S, Sant S, Nichol JW, Khabiry M, Traversa E, Khademhosseini A. Controlling the porosity of fibrous scaffolds by modulating the fiber diameter and packing density. J Biomed Mater Res Part A. 2011;96A:566–74. doi: 10.1002/jbm.a.33010. [DOI] [PubMed] [Google Scholar]
- 12.Wright LD, Andric T, Freeman JW. Utilizing NaCl to increase the porosity of electrospun materials. Materials Science and Engineering: C. 2011;31:30–6. [Google Scholar]
- 13.Lee BL, Jeon H, Wang A, Yan Z, Yu J, Grigoropoulos C, et al. Femtosecond laser ablation enhances cell infiltration into three-dimensional electrospun scaffolds. Acta Biomater. 2012;8:2648–58. doi: 10.1016/j.actbio.2012.04.023. [DOI] [PMC free article] [PubMed] [Google Scholar]
- 14.Yixiang D, Yong T, Liao S, Chan CK, Ramakrishna S. Degradation of electrospun nanofiber scaffold by short wave length ultraviolet radiation treatment and its potential applications in tissue engineering. Tissue Eng Part A. 2008;14:1321–9. doi: 10.1089/ten.tea.2007.0395. [DOI] [PubMed] [Google Scholar]
- 15.Baker BM, Gee AO, Metter RB, Nathan AS, Marklein RA, Burdick JA, et al. The potential to improve cell infiltration in composite fiber-aligned electrospun scaffolds by the selective removal of sacrificial fibers. Biomaterials. 2008;29:2348–58. doi: 10.1016/j.biomaterials.2008.01.032. [DOI] [PMC free article] [PubMed] [Google Scholar]
- 16.Marion NW, Mao JJ. Mesenchymal stem cells and tissue engineering. Methods Enzymol. 2006;420:339–61. doi: 10.1016/S0076-6879(06)20016-8. [DOI] [PMC free article] [PubMed] [Google Scholar]
- 17.Rooker SM, Liu B, Helms JA. Role of Wnt signaling in the biology of the periodontium. Dev Dyn. 2010;239:140–7. doi: 10.1002/dvdy.22003. [DOI] [PMC free article] [PubMed] [Google Scholar]
- 18.Lee G, Kim H, Elkabetz Y, Al Shamy G, Panagiotakos G, Barberi T, et al. Isolation and directed differentiation of neural crest stem cells derived from human embryonic stem cells. Nat Biotechnol. 2007;25:1468–75. doi: 10.1038/nbt1365. [DOI] [PubMed] [Google Scholar]
- 19.Wang A, Tang Z, Park IH, Zhu Y, Patel S, Daley GQ, et al. Induced pluripotent stem cells for neural tissue engineering. Biomaterials. 2011;32:5023–32. doi: 10.1016/j.biomaterials.2011.03.070. [DOI] [PMC free article] [PubMed] [Google Scholar]
- 20.Cheng Q, Komvopoulos K. Synthesis of Polyethylene Glycol-Like Films from Capacitively Coupled Plasma of Diethylene Glycol Dimethyl Ether Monomer. Journal of Physical Chemistry C. 2009;113:213–9. [Google Scholar]
- 21.Depan D, Surya PK, Girase B, Misra RD. Organic/inorganic hybrid network structure nanocomposite scaffolds based on grafted chitosan for tissue engineering. Acta Biomater. 2011;7:2163–75. doi: 10.1016/j.actbio.2011.01.029. [DOI] [PubMed] [Google Scholar]
- 22.Park JS, Chu JS, Tsou AD, Diop R, Tang Z, Wang A, et al. The effect of matrix stiffness on the differentiation of mesenchymal stem cells in response to TGF-β. Biomaterials. 2011;32:3921–30. doi: 10.1016/j.biomaterials.2011.02.019. [DOI] [PMC free article] [PubMed] [Google Scholar]
- 23.Hashi CK, Derugin N, Janairo RR, Lee R, Schultz D, Lotz J, et al. Antithrombogenic modification of small-diameter microfibrous vascular grafts. Arterioscler Thromb Vasc Biol. 2010;30:1621–7. doi: 10.1161/ATVBAHA.110.208348. [DOI] [PMC free article] [PubMed] [Google Scholar]
- 24.Tang Z, Wang A, Yuan F, Yan Z, Liu B, Chu JS, et al. Differentiation of multipotent vascular stem cells contributes to vascular diseases. Nat Commun. 2012;3:875. doi: 10.1038/ncomms1867. [DOI] [PMC free article] [PubMed] [Google Scholar]
- 25.Nimura A, Muneta T, Koga H, Mochizuki T, Suzuki K, Makino H, et al. Increased proliferation of human synovial mesenchymal stem cells with autologous human serum: comparisons with bone marrow mesenchymal stem cells and with fetal bovine serum. Arthritis Rheum. 2008;58:501–10. doi: 10.1002/art.23219. [DOI] [PubMed] [Google Scholar]
- 26.Fan J, Varshney RR, Ren L, Cai D, Wang DA. Synovium-derived mesenchymal stem cells: a new cell source for musculoskeletal regeneration. Tissue Eng Part B Rev. 2009;15:75–86. doi: 10.1089/ten.teb.2008.0586. [DOI] [PubMed] [Google Scholar]
- 27.Ladd MR, Lee SJ, Stitzel JD, Atala A, Yoo JJ. Co-electrospun dual scaffolding system with potential for muscle-tendon junction tissue engineering. Biomaterials. 2011;32:1549–59. doi: 10.1016/j.biomaterials.2010.10.038. [DOI] [PubMed] [Google Scholar]
- 28.Leenslag JW, Pennings AJ, Bos RR, Rozema FR, Boering G. Resorbable materials of poly(L-lactide). VII. In vivo and in vitro degradation. Biomaterials. 1987;8:311–4. doi: 10.1016/0142-9612(87)90121-9. [DOI] [PubMed] [Google Scholar]
- 29.Li S. Hydrolytic degradation characteristics of aliphatic polyesters derived from lactic and glycolic acids. J Biomed Mater Res. 1999;48:342–53. doi: 10.1002/(sici)1097-4636(1999)48:3<342::aid-jbm20>3.0.co;2-7. [DOI] [PubMed] [Google Scholar]
- 30.Higgins SP, Solan AK, Niklason LE. Effects of polyglycolic acid on porcine smooth muscle cell growth and differentiation. J Biomed Mater Res A. 2003;67:295–302. doi: 10.1002/jbm.a.10599. [DOI] [PubMed] [Google Scholar]
- 31.Mukherjee DP, Smith DF, Rogers SH, Emmanual JE, Jadin KD, Hayes BK. Effect of 3D-microstructure of bioabsorbable PGA:TMC scaffolds on the growth of chondrogenic cells. J Biomed Mater Res B Appl Biomater. 2009;88:92–102. doi: 10.1002/jbm.b.31155. [DOI] [PubMed] [Google Scholar]
- 32.Kister G, Cassanas G, Vert M. Morphology of poly(glycolic acid) by IR and Raman spectroscopies. Spectrochimica Acta Part a-Molecular and Biomolecular Spectroscopy. 1997;53:1399–403. [Google Scholar]
Associated Data
This section collects any data citations, data availability statements, or supplementary materials included in this article.
Supplementary Materials
Histograms representing the distribution of pore size for each scaffold group were generated using Matlab analysis, with PLLA (A, D, G), PLLA/PGA (low) (B, E, H), and PLLA/PGA (high) (C, F, I). The scaffolds were as-spun (AS) (A–C), 2-week post-degraded (PD) (D–F), and 4-week PD (G–I).