

Abstract
Form and motion processing pathways of the primate visual system are known to be interconnected, but there has been surprisingly little investigation of how they interact at the cellular level. Here we explore this issue with a series of three electrophysiology experiments designed to reveal the sources of action selectivity in monkey temporal cortex neurons. Monkeys discriminated between actions performed by complex, richly textured, rendered bipedal figures and hands. The firing patterns of neurons contained enough information to discriminate the identity of the character, the action performed, and the particular conjunction of action and character. This suggests convergence of motion and form information within single cells. Form and motion information in isolation were both sufficient to drive action discrimination within these neurons, but removing form information caused a greater disruption to the original response. Finally, we investigated the temporal window across which visual information is integrated into a single pose (or, equivalently, the timing with which poses are differentiated). Temporal cortex neurons under normal conditions represent actions as sequences of poses integrated over ∼120 ms. They receive both motion and form information, however, and can use either if the other is absent.
Introduction
Our ability to perceive actions and movement, and to combine that information with the perception of who or what is acting or moving, is fundamental to our visual experience. What computations allow for successful perception of motion and the binding of these motions to the correct actors? What are the neural substrates of these computations? Visual processing has been roughly divided into ventral (“what”) and dorsal (“where/how”) streams (Ungerleider and Mishkin, 1982). These two streams are not wholly independent: neurons encoding both types of information have been described, particularly in the superior temporal sulcus (STS) (Bruce et al., 1981; Oram and Perrett, 1996; Jellema et al., 2004). This object/spatial distinction is, however, a widely accepted if rough subdivision of the function of the visual system.
Information from the dorsal and ventral streams can be encoded separately (Wu et al., 2004). In normal perception, however, information from different visual modalities is correctly bound together to give coherent percepts of objects with particular shapes and colors at particular places doing particular things. Must a binding problem (Treisman and Gelade, 1980) be solved to rejoin form with articulated action, or might the two remain coupled throughout the visual pathway?
Many neurons in the upper bank and fundus of anterior STS are selective for motion direction, and some are relatively invariant to visual form (Bruce et al., 1981). Some respond selectively to specific combinations of orientation and motion direction when monkeys observe humans walking or objects being moved in various locations and directions (Perrett et al., 1985; Oram and Perrett, 1996; Vangeneugden et al., 2009) Many of these neurons even respond to static poses reached during the performance of such actions (Jellema and Perrett, 2003). This area is reciprocally connected with inferior temporal cortex (IT) and receives input from more posterior dorsal-stream sources such as medial superior temporal area MST; nearby regions in the fundus of the posterior STS also project to IT (Baizer et al., 1991). Given these connections, it is not surprising that Gross et al. (1972) found that virtually all observed IT neurons were sensitive or even selective to motion. A region in the lower bank of the posterior STS shows heightened blood-oxygen-level-dependent responses to biological motion (Grossman et al., 2000; Beauchamp et al., 2003) of point-light walkers (Johansson, 1973). A nearby region shows a strong preference for motionless bodies relative to other objects (Downing et al., 2001), and this preference correlates on a voxel-by-voxel basis with preference for biological versus scrambled motion (Peelen et al., 2006).
In this study, we use visually rich, controlled, repeatable stimuli to show that temporal cortex neurons carry information about both object form and complex actions. We explore the nature and origins (pose-based vs motion-based) of the information giving rise to the action discrimination of these neurons. We also investigate the timescale of temporal integration (into a representation of a pose) versus differentiation (between poses).
Materials and Methods
Subjects
Three male rhesus monkeys (Macaca mulatta; monkeys G, R, and S), aged 7–11 years and weighing between 8 and 12 kg, were the subjects in these experiments. Before the experiment, the monkeys had been familiarized with the behavioral apparatus and had participated in unrelated studies. Monkeys had a recording chamber implanted over the left (tasks 1 and 2) or right (task 3) hemisphere (Horsley–Clark coordinates: +15 anterior, +20 lateral) and a titanium head post for head restraint. All surgeries were performed using sterile technique while the animals were intubated and anesthetized using isoflurane gas. All procedures conformed to the National Research Council Guide for the Care and Use of Laboratory Animals as well as the Brown University Institutional Animal Care and Use Committee.
Stimulus apparatus
Stimuli were presented on a dual-processor ×86 graphics workstation, running a custom OpenGL-based stimulation program under Windows XP (Microsoft). The screen resolution was 1024 × 768 with a vertical refresh rate of 100 Hz. Behavioral control for the experiments was maintained by a network of interconnected personal computers running the QNX real-time operating system (QSSL; QNX Software Systems). This system provides deterministic control and acquisition of button responses (with submillisecond precision) and eye position and communicates with the dedicated graphics machine using isolated high-speed Ethernet and direct digital input/output. Experimental control and data collection of behavioral measures were conducted using custom software. All behavioral data, such as button responses and eye-position signals, were available for online monitoring and stored to disk for offline analysis.
Monkeys were seated in a primate chair, with the head fixed. They responded by means of two buttons on a board on which they rested their hands (one button under each hand). Eye movements were recorded using an EyeLink II video eye-tracking system, running at 500 Hz (SR Research). Each recording session began with a simple eye-movement task to calibrate the eye-tracking system. Aside from the stimulus display, the recording booth was dark and well isolated from acoustic and electromagnetic interference.
Stimuli and tasks
Task 1: action recognition.
Each trial consisted of the same general sequence (Fig. 1), beginning with a fixation spot presented against a gray background. Once the monkey maintained continuous fixation for 450 ms, the spot disappeared. After a 500 ms blank period, one of eight fully textured rendered three-dimensional humanoid characters (Geo-metricks) appeared, in a neutral upright pose. Rendering relied on Granny3D (RadGameTools). Each character subtended ∼6° vertically in this neutral pose. The character remained motionless for 300 ms and then began performing one of eight different actions (MeGa MoCap V2; Credo Interactive). The segue into the action was blended with the neutral pose, so the initial moments of motion were subtle and difficult to distinguish. After 1300 ms of action, the character began moving back toward the neutral pose, reaching it after a total of 1900 ms of motion. At 800 ms later, the character vanished, ending the trial. The monkey's task was to use two buttons to classify the actions into two preset arbitrary (but fixed) groups. See supplemental Figure 1 (available at www.jneurosci.org as supplemental material) for images of all eight characters and supplemental Movie 1 (available at www.jneurosci.org as supplemental material) to see all eight actions performed by one of the characters. A button-press response immediately ended the trial, removing the character from the screen. The monkey received auditory feedback after each trial, accompanied by juice after a correct choice or a penalty delay of 2 s if incorrect. If the monkey did not respond by the end of the trial, it received the same feedback as if it responded incorrectly, and the stimulus was saved for reuse later in the block.
Figure 1.

Sequence of events in the action recognition and reduced action recognition tasks. The monkey initiated the trial by fixating for 450 ms on a central fixation point. This then vanished, leaving a blank screen for 500 ms. A humanoid figure (possibly subject to one of the manipulations in the reduced action task) appeared and stood in a neutral motionless pose for 300 ms before beginning an action. This action lasted 1900 ms or until the monkey responded; if the monkey still had not responded by the time the action completed, the figure remained motionless in the neutral pose for up to 800 ms longer.
Task 2: reduced action recognition.
Most aspects of this task were identical to the action recognition task. However, many of the action movies were manipulated, to either remove form information or remove motion information. The task requirements were identical, as were the particular actions and characters used. Only one character was used in a given recording session, however, to allow for sufficient trials with all actions and all types of stimuli. The character used for a particular session was chosen by eye to maximize action discrimination, based on real-time rasters during an initial survey using all characters and all actions.
The first new stimuli in this experiment, “strobe” stimuli, were identical to the original textured animated characters except that they were visible only for periodic 10 ms monitor refreshes separated by blank screens. The period of this strobe-light effect (determined by the length of the blank between frames) took several different values in different trials: 40, 80, 120, 180, or 260 ms. These were designed to remove motion information, to test responses to single snapshots, and to examine the time over which those static images could potentially combine to elicit neural responses similar to those driven by moving stimuli. For an example, see supplemental Movie 9 (available at www.jneurosci.org as supplemental material).
The second manipulation was designed to remove form information and to test the contribution of motion-sensitive mechanisms to the action-discriminative neurons from which we recorded. Construction of these stimuli, “formless dot fields,” is fully described by Singer and Sheinberg (2008). Essentially, these stimuli appear at any instant to be uniform random fields of ∼2000 2 × 2 pixel white dots. The dots persist for only 40 ms, and those that are situated on the screen in a position above the underlying animated stimulus (which is not visibly rendered) move as the stimulus moves. Although conveying essentially nothing about form, these stimuli contain motion information almost identical to the original stimuli. Supplemental Movie 10 (available at www.jneurosci.org as supplemental material) shows an example of such stimuli.
Finally, we used stimuli identical to the formless dot fields except that the foreground dots (over the figure) and the background dots were rendered in two different colors. This enabled easy segmentation of figure from ground, without providing any local form or texture information. We also showed strobed versions of these colored dot field stimuli, with the same frequencies as for the fully textured stimuli. Supplemental Movie 2 (available at www.jneurosci.org as supplemental material) shows examples of all manipulations used in this task.
Task 3: clipped action viewing.
Both the monkeys' behavioral task and the stimuli were new in this experiment. After the monkey fixated on a point at the center of the screen, a rendered image of a hand (subtending ∼6° of visual angle vertically) appeared. The hand remained motionless for 300 ms and then performed an action for 1200 ms before returning to its initial neutral pose and stopping. During this time, the monkey was required to keep its gaze on the hand; excursions beyond ∼0.5° from the extent of the hand aborted the trial. After the hand stopped moving, two peripheral targets appeared, one on each side of the hand; the monkey was then free to look where it wished and had to respond based on a change in one of the targets. The behavioral aspect of the task ensured that the monkey was attending to the task but is irrelevant to this experiment. For practical purposes, one may consider the monkeys to have performed viewing-only tasks. Because of the range of stimulus manipulations used in this experiment (see below), we decided not to teach the monkeys to respond differentially to the particular animated sequences; we did not want to bias them to attend to particular aspects of the actions. Our interest here was to better understand how single-neuron responses were affected by altering the temporal dynamics of the action sequences.
There were two basic actions that the hand could perform, spelling out either “LW” or “WL” in American Sign Language. These actions were identical but with the temporal order of individual frames reversed. There were also “clipped” trials: the movie of the action was broken up into short clips, and each clip was played backward while maintaining the overall order of the clips. One may conceptualize this manipulation by imagining a movie consisting of several reels, each corresponding to a clip. In the normal version of the movie, the reels are played in the correct order. In the clipped version, the same sequence of reels is used, but the film has been wound backward on each reel so that each reel starts at the end and plays in reverse. We used clip lengths of 4, 8, 12, 20, 30, and 60 frames (shown on a 100 Hz monitor), dividing up the 120 frames of the overall action. For example, with a clip length of 60 frames, the first half of the action played backward, followed by the second half running backward. Figure 2 schematizes full-motion and 30-frame (300 ms) clipped versions of both actions. In this way, we constructed a range of stimuli between the two basic actions: using 40 ms clips looks like a slightly jittery version of the basic action, whereas using 600 ms clips is equivalent to playing the opposite basic action but playing the second half of it first (for examples, see supplemental Movie 3, available at www.jneurosci.org as supplemental material). We also presented formless dot field versions of these stimuli at all clip lengths.
Figure 2.

Schemata of some of the stimuli used in the clipped action viewing task. The two basic full-motion actions are shown, progressing through several representative poses, along with the two stimuli broken up into 300 ms clips that are then reversed. Short vertical arrows indicate abrupt jumps from one pose to the other, happening between two frames. Other arrows indicate smooth transitions between poses. Arrows of the same color connect the same poses; if both stroke and color are the same, the transition is in the same order, whereas two same-colored arrows with different strokes indicate that the two motions are reversals of each other.
Recording apparatus
In the first two tasks, at the beginning of each recording session, a 25 gauge guide tube was inserted to a level just below the dura. A single electrode was advanced through the guide tube using a micropositioner (David Kopf Instruments). In the third task, single electrodes were lowered through chronically implanted guide tubes that could be pivoted to provide access to an extended region of cortex. Electrodes were composed of a tungsten core with glass coating (Alpha Omega). Neural signals were amplified (model A-1; BAK Electronics), bandpass filtered between 100 Hz and 12 kHz (model 3364; Krohn-Hite), and digitized at 34.375 kHz. We recorded from single units or small groups of units. The signals were thresholded and (when more than one unit was recorded at once) sorted using “wave_clus” (Quiroga et al., 2004).
In the first tasks, neurons were located in both banks of the STS in both monkeys and also in the inferior temporal gyrus in monkey S. Figure 3 shows recording locations in near-coronal magnetic resonance imaging (MRI) slices, ∼12 mm (for monkey G) and 15 mm (for monkey S) anterior of the interaural plane. We removed the recording hardware from monkey S after the first task so that only monkey G performed the second task, during which we recorded from the same site as in the first task. In the third task, we recorded from deep in the STS and in IT in monkey G, ∼14 mm anterior to the interaural plane. Monkey R also performed the third task; we do not have an MR image of monkey R's brain, but based on the stereotaxic coordinates of the chamber and two atlases of macaque brains (Paxinos et al., 2000; Saleem and Logothetis, 2006), we estimate that these cells were in the upper bank of the STS, in the superior temporal polysensory area TPO and/or area TAa in the superior temporal gyrus, ∼12 mm anterior to the interaural plane.
Figure 3.

Near-coronal MRI slices showing the approximate locations from which neurons were recorded in monkeys G and S. This included both banks of the left STS in both monkeys, left-hemisphere IT in monkey S, and IT and the lower bank of the STS in monkey G's right hemisphere. Neurons were ∼12 mm (for monkey G's left hemisphere) and 15 mm (for monkey S) anterior of the interaural plane, as shown in the insets. Monkey G's right hemisphere recordings (dashed ellipse) were ∼14 mm anterior of the interaural plane, 2 mm anterior of the region highlighted here.
Data analysis
The responses of the neurons we observed tended to be more diverse, more extended, and more robust than is commonly seen using flashed static images. Most stimuli elicited responses, and the responses sometimes persisted for several hundred milliseconds after the stimuli disappeared. This is in contrast to the typical selective phasic responses we observed to flashed static images while lowering the electrode and hunting for visual neurons. For these reasons, the conventional notion of “selectivity” (poor response to most stimuli and a strong response to the selected stimulus) is not useful. We speak instead of discrimination or information: are the firing rates of these neurons able to tell us what the monkey is looking at? Our analyses reflect this; instead of finding the stimulus for which each neuron was selective, we examined the capability of populations of neurons to represent various aspects of the stimuli. We also tested the generality of these representations and the importance of different stimulus properties in their construction, comparing responses between different stimulus conditions.
Poisson models.
To demonstrate how effectively even relatively small populations of cells could differentiate between the individual stimuli presented, we developed and tested a model based on the populations of neurons recorded from in each monkey in the first two tasks. We treated each unit as a rate-varying Poisson process; the rate parameter of such a process can be estimated by the mean observed rate. For each unit, for each trial, we determined the spike counts in each 40 ms bin after stimulus onset. We chose 40 ms because it maximized performance of the model, although bin sizes between 5s and 100 ms yielded qualitatively similar results and nearly the same level of performance. Then, for each unit and for each distinct stimulus, we calculated the average spike count in each bin, leaving one trial out for verification purposes. In the action recognition task, there were 64 distinct stimuli (8 actions × 8 characters); in the reduced action recognition task, there were only eight actions, because we only showed one character on any given day. There were typically only a small number of trials for each condition for each neuron; to overcome problems with unusual bins having an inordinate impact on the performance of the model, we processed the resulting (bin-indexed) vectors. Each vector was convolved with a Gaussian kernel with an SD of one bin. Then, any binwise firing rates less than the mean firing rate during the 500 ms before the onset of the stimulus were averaged with this baseline rate. At this point, we had estimates of the rate for each unit, at each time bin, in response to each of the 8 or 64 stimuli. Given a Poisson process with rate parameter λ per unit time, the probability of observing n events in one unit of time is . The probability of observing one of the left-out spike trains from a unit, given that a particular stimulus was shown, is the product of this term across all time bins.
No more than a few of these units were ever recorded simultaneously. However, as long as there are no long-term changes over time in the functioning of these populations of neurons, we can consider together all neurons from all recording sessions as one pseudo-population. In doing so, we treat the left-out trials of all the neurons, for each stimulus, as having been responses to the same presentation of that stimulus. Previous work has found no loss of information in comparing IT neuron responses across days in this manner (Anderson et al., 2007). It is then possible to construct a confusion matrix for the population of cells, plotting the probabilities assigned (as described above) to each of the 8 or 64 stimuli against each of the 8 or 64 left-out trials. The diagonal of the matrix indicates how reliably the responses to a given stimulus identify that stimulus, whereas the entries off the diagonal give a measure of the similarity in pseudo-population responses to the two stimuli indexed. Such a confusion matrix is based on a specific set of left-out trials; different sets of left-out trials yield different confusion matrices. By creating many confusion matrices and multiplying them together, we can estimate the information that these neurons are intrinsically capable of representing or simulate what a larger population (consisting of many neurons similar to each recorded neuron) might be able to do on a single trial. We evaluated the performance of each model by counting the number of left-out trials that were assigned the highest probability by their respective Poisson processes. In addition to collapsing across all time bins in the entire trial, we also looked at the accumulation of information (that is, the increase in performance) as successive bins were added to the model, increasing the temporal window of the model one bin at a time.
Evaluating the performance of these models is a way of measuring similarity: in these cases, similarity between individual (left-out) responses to each stimulus and the average responses to each stimulus. In the reduced action recognition task, we also used these models to quantify the similarity of responses between conditions. We did this by using models created from one set of data to evaluate trials from another.
Local and global similarity scores.
There were only two basic actions in the clipped action viewing task. Creating a classifier that successfully discriminated between them would tell us very little. Moreover, we were interested in comparing responses to a given stimulus at particular times with responses to other stimuli at different times. Specifically, are the responses to a given frame of animation more influenced by temporally local context (the order of frames within the clip, or motion information) or by the global action context in which the frame occurs (that is, the order of the clips: LW vs WL)? We therefore followed a different approach for analyzing these data, calculating local and global similarity scores. These tell us how similar the responses are to visually identical frames when they appear in the same local context or in the same global context, respectively. At clip durations for which the local similarity score is higher, information within clips exerts more influence on the responses to the frames of an action. When the global similarity score is higher, the positions of the frames within the overall action exert a greater influence.
For each neuron, for each basic action, and for each clip length, we binned the spike counts into 1 ms bins. These histograms were smoothed with a Gaussian window of 5 ms SD and then rebinned into 10 ms bins. Each such bin can be indexed by basic action, time bin, and clip duration. For each bin, we exhaustively calculated its absolute differences from all other bins. We used these differences to calculate a similarity value for each comparison, leading to local and global similarity scores for each clip length. For a given clip length, let Di,jsame refer to the sum of the two absolute differences between same-action conditions at bin i in the full-motion action and bin j in the clipped action. For example, D31,19same compares bin 31 of the full-motion LW action to bin 19 of the clipped LW action (for the clip length being considered), adding that difference to the difference between bin 31 of the full-motion WL action and bin 19 of the clipped WL action. Let Di,jopp refer to the corresponding sum of the two differences between opposite-action conditions. We then defined our similarity value for the same-action comparison as and for opposite-action comparisons as its reciprocal, . These similarity values for all i,j yield a similarity matrix, indexed by time in full-motion trials and time in clipped trials. There is one such matrix for same-action comparisons and one for opposite-action comparisons (corresponding values in these two matrices are reciprocal).
Di,jsame is low when the firing rate of the cell is low or when the responses in the ith bin of the full-motion action and the jth bin of the clipped action are similar. In the latter case, this similarity leads to a low Di,jopp also, unless the similarity is particular to the same-action comparison. Therefore, the similarity value for same-action comparisons should be high if and only if Di,jsame is low because of something particular to the same-action comparison. Likewise, opposite-action similarity should be high if and only if Di,jopp is low but Di,jsame is not. The value of the constant added to the numerator and denominator (0.025) is somewhat arbitrarily chosen such that it carries the same weight as a 25 Hz firing rate; other values work without qualitatively changing the results. It serves to prevent similarity values from becoming extremely high solely because of a low denominator and to help compensate for increased variance leading to increased rate differences at higher firing rates.
Relative to a full-motion action, the clipped versions of the opposite action contain all the same motion (except for the abrupt transitions between clips), but the clips are in the reverse order; the global sequence of poses is reversed. Conversely, full-motion and clipped versions of the same action contain the same overall sequences of general poses, but within each clip the local motion is reversed. By comparing the same-action versus opposite-action similarity values for visually identical frames, we can see the effect of stimulus history on the responses to those frames. Higher similarity values between matching frames in same-action comparisons indicate that a correct progression of general poses through the action is more important to the representation of the action. Higher similarity values between matching frames in the opposite-action cases indicate that the context within the clip of that frame is more important.
To calculate the local and global similarity scores for each clip length, we sum the similarity values corresponding to the responses to visually identical frames in the opposite-action and same-action comparisons, respectively. Visually identical frames of animation, blurred slightly and shifted to account for 130 ms of latency, are mapped in Figure 4 for same-action and opposite-action cases. We used these maps as masks, multiplying them pointwise by the similarity matrices and summing the results. This gives us two values for each neuron, a local (intraclip) similarity score and a global (interclip) similarity score. Both scores are derived from comparisons of identical frames in the two conditions, so any differences should be attributable to differences in context (motion in the correct direction versus the correct general sequence of poses). Figure 5 illustrates this process for one example cell, using trials with 300 ms clips.
Figure 4.

Masks relating identical frames of animation in same-action (top) and opposite-action (bottom) cases. Identical frames were shifted forward in time by 130 ms to account for latency to the neurons from which we recorded, and the masks were blurred slightly. For each neuron, these masks were multiplied pointwise by the same-action and opposite-action similarity score matrices, and the results were summed to give global and local similarity scores.
Figure 5.

Calculation of local and global similarity scores for one sample neuron at 300 ms clip length. For the local similarity score, the matrix of opposite-action similarity values for this neuron is calculated. This is then multiplied pointwise by the appropriate mask, which selects only those pairs of times at which the same animation frame is driving both neurons. The values in the resulting matrix (most of which are 0 because of the mask) are summed, yielding the local similarity score. The global similarity score is calculated with the same technique but starting with the similarity values from same-action trials and using a different mask.
Results
Learning and behavior
Monkeys G and S learned the action recognition task; they were first trained with only two of the eight characters. After three consecutive 64-trial blocks with 95% or better performance, those characters were replaced with two new characters. The monkey then trained on these two characters until the criterion was met. The last two pairs of characters were taught similarly. After a monkey reached this high-performance threshold on all characters, we began electrophysiological recordings. Blocks during recording sessions were also 64 trials, one for each combination of character and action.
Both monkeys were able to learn to perform the task extremely well. Learning all eight actions as performed by the first pair of characters took 3–9 d, and successive pairs of figures generally took successively less time to reach criterion. The third and fourth pairs took approximately 1 d each, for both monkeys (Fig. 6). This suggests that not only were the monkeys able to perform the task, they were able to transfer what they learned about an action to its performance by a new character. During the main experiment, after training, both monkeys did very well at all action/character combinations. Overall performance was above 90%. Reaction times were 1048 ± 229 ms for monkey S and 869 ± 121 ms for monkey G (mean ± SD). High performance in this task indicates that the eight actions are both perceptually and cognitively distinct and that the monkeys can respond invariantly with respect to the acting character.
Figure 6.

Learning curves for both monkeys in the action recognition task. Monkeys were trained on successive pairs of characters. Once a monkey reached criterion on a given pair (95% performance in 3 successive 64-trial blocks) that pair was set aside and the new pair was introduced. In both monkeys, the first pair took the longest, and the last two pairs were learned very quickly.
Monkey G learned the reduced action recognition task, in which stimuli consisted of one character performing the eight original actions under various conditions to remove different kinds of information from the stimuli. Strobe conditions removed motion information, formless dot fields removed form information, and colored dot fields removed texture and local form information, as well as motion information when the colored dot fields were also strobed. The monkey was able to perform all versions of the task at better than chance level and was near its peak performance in each condition after the first day of exposure to the new tasks. When faced with nonstrobe stimuli, it responded to colored dot fields almost as accurately as to fully textured stimuli. In both cases, performance fell off as the strobe period increased but remained well above chance. Formless dot field stimuli proved more difficult; the monkey performed well on six of eight actions but virtually always misclassified the remaining two. Behavioral performance is summarized in Figure 7.
Figure 7.

Behavioral performance in reduced action recognition tasks. Performance is divided up by strobe period, with full-motion stimuli indicated by a 10 ms strobe period (as the refresh rate of the monitor was 100 Hz). Black bars indicate proportion correct in trials with textured characters, dark gray bars indicate proportion correct in trials with colored dot stimuli, and the single light gray bar shows performance with formless dot fields (white dots). There were no strobed versions of these last stimuli because they contained only motion information.
The monkey's rapid learning of the reduced action recognition stimuli, comparable in speed with its learning of new characters performing the same actions in the action recognition task, suggests that it recognized the old actions despite the visual differences in the new stimuli. The monkey's extremely poor performance with two of the left-button formless dot field actions could arise from mistaking those actions for other actions with right-button mappings or from complete failure to perceive the actions combined with a default right-button choice. The latter case is unlikely, however; reaction times for the different right-button actions appear not to be drawn from the same population (Kruskal–Wallis test, p < 0.001). The monkey is not blindly pressing the right button except when one of the two left-button actions that it is able to identify appears. Reaction times for the two consistently misclassified actions are marginally different (means of 1194 and 1176 ms; Kruskal–Wallis test, p = 0.06). The monkey's decreased performance at longer strobe periods is also somewhat noteworthy. The same sequence of frames was shown in each trial with a given strobe period, and, even at the slowest period, the monkey would see two or three frames that unambiguously determined which action was being performed. The monkey could have simply learned one diagnostic frame for each action at each strobe period; we have seen monkeys learn many more difficult discrimination tasks. That it did not is another piece of evidence that it was attending to and basing its responses on the actions and that its decreased performance at longer periods was attributable to a failure to interpret an extremely sparse sequence of poses as a known action.
Monkeys G and R learned the clipped action viewing task. Neither monkey had difficulty maintaining fixation within the required window. Moreover, they executed the behavioral task at above 90% performance. This does not bear on the current study except as a demonstration that they were engaged in the stimuli.
Neural responses in action recognition task
We recorded from 107 units in monkey S and 69 in monkey G. We considered for additional analysis those cells for which the number of spikes in at least one of the two 600 ms windows between 100 and 1300 ms after stimulus onset carried significant information about the stimuli. Significance was determined with a permutation test at the p < 0.05 level, using the mutual information between spike count and stimulus as the permuted statistic. We calculated mutual information using the algorithm for the calculation of “Icount” with the classical debiaser as described by Victor (2002). This was done for both characters and actions, giving each cell four chances to pass the permutation test at an uncorrected p < 0.05 level. With this criterion in place, 55 cells from monkey S and 50 from monkey G remained. Note that this excluded many cells that were visually responsive but did not discriminate between the stimuli we used.
Further breaking down the results of this permutation test also reveals that we did not simply record from two different populations of cells with response properties suited exclusively for either character or action discrimination. In monkey G, 33 of 50 units carried information about both action and character. This left only three that carried significant information about action but no significant information about character and 14 that carried character but not action information. In monkey S, 18 units carried significant information about both character and action, leaving six that only discriminated between actions and 31 that showed only character information.
The number of neurons that carried information only about action was no greater than would be expected by chance, in line with the idea that most cells in this region of the STS and IT are at least somewhat responsive to form. Nevertheless, more than half of all informative cells did carry information about actions. Although the majority of these neurons (considering both monkeys together) were in the STS, many of the action-discriminative cells were located in IT (and many of the action-discriminative STS neurons were in the lower bank of the STS, part of temporal cortex area TE).
Figure 8 shows mean spike rates for one example unit, broken up by character, by action, and by both factors. Each character/action combination was presented 20 times, for a total of 1280 trials. Traces at the end of each row and column show the means for the associated character or action, respectively. Green lines indicate stimulus onset, and red lines in the collapsed means indicate average reaction times for each character or action. This unit was discriminative for character, for action, and for the specific combination of character and action. Other units exhibited varying response patterns, onset and offset latencies, and patterns of discrimination, with no clear categories or types of responses emerging.
Figure 8.

Mean firing rates from one sample cell (20 trials per stimulus, 1280 trials total). The main 8 × 8 grid of traces shows the mean firing rate in response to each specific combination of character and action. Characters are grouped by row and actions by column. The plots at the end of each row and column show the mean response for that character or action, respectively, collapsed across the other factor (160 trials each). Green lines indicate stimulus onset, and red lines indicate mean reaction time for a particular character or action.
We evaluated trial data with rate-varying Poisson models, whose rates are derived from the data not used in the evaluation. This let us compare similarity of response between the evaluated trials and the averaged responses, to both the same stimuli (yielding a measure of reliability of response encoding) and different stimuli (yielding a measure of similarity of response to the two different stimuli). Figure 9 shows graphically the product of 50 confusion matrices for each monkey, derived from 50 random collections of left-out trials. Each row represents one stimulus that a given trial might have contained; each column represents one left-out trial (actually, one such trial per neuron). The color at each position indicates the evaluation by the model of the probability that the spikes observed in trial of that column would be seen if the stimulus associated with that row were shown. Probability ranges from blue (low) through yellow to reddish brown (high). There is a clear series of 8 × 8 red blocks running down the diagonal. This corresponds to high probability assigned to the correct character. There is also, on the main diagonal, a width-one line of high probability corresponding to the correct model and action. Other width-one diagonal lines faintly visible off the main diagonal indicate relatively higher probability for the correct action but the incorrect character. Notably, the single highest probability in a column (i.e., for a particular left-out trial) corresponds to the correct stimulus in 38 of the 64 trials for monkey S and 64 of the 64 trials for monkey G. Although this high performance comes from 50 confusion matrices, it holds up well even with only five.
Figure 9.

Confusion matrices for models based on neuron populations from monkey S (left) and monkey G (right). Each column represents the left-out trials for one of the 64 stimuli used; each row represents the 64 different stimuli that the model might choose as having generated the left-out trials. High probability is indicated by deep red. Stimuli are sorted first by character and then by action; 8 × 8 blocks of high probability on the main diagonal indicate correct classification of the corresponding character, and single-pixel diagonal lines of high probability indicate correct classification of action. High probability on the main diagonal indicates good performance at both character and action.
Rather than collapsing across all time bins in the entire trial, we can look at the increase in performance as the probabilities of successive time bins are taken into consideration, thereby discovering when these neural populations begin to represent information about the viewed stimuli. Figure 10 shows average performance (averaged across 200 single realizations of the model) as the number of bins used increases. A very rapid initial rise corresponds to information about the character, followed much later by information about the action. Note that these curves were derived from individual confusion matrices, and so final performance here gives an indication of how well each of the confusion matrices that were used to make Figure 8 performed on its own. This plot also shows performance at identifying only the model and only the action, disregarding the other factor. Mean reaction times differed by approximately one bin width between different stimuli, and performance is good considerably before the monkeys typically responded, so the performance of the model is not simply an artifact of varying stimulus presentation durations or disappearance times. The most informative individual 40 ms bins (data not shown) were on average able to correctly identify 8 of 64 stimuli in monkey S and 25 of 64 in monkey G; chance performance would be 1 of 64. Even small populations of neurons are able to represent these complex stimuli using population rate codes over short windows of time.
Figure 10.

Plot showing mean cumulative performance of one Poisson model, as the number of 40 ms bins increases. Blue is for monkey G, and red is for monkey S. Solid lines indicate performance at predicting both character and action (chance performance is 1 of 64 correct); long dashes indicate performance at predicting action only, and short dashes indicate performance at predicting character only (both with chance performance at 8 of 64).
Neural responses in reduced action recognition task
During the reduced action recognition task, we recorded from 23 units from monkey G in the same region as in the previous task; these exhibited the same varied responses to full-texture full-motion stimuli observed in the action recognition task. Because of the small sample size and the high visual responsiveness of the cells, we used the entire population of neurons for analysis. Responses to colored dot fields tended to resemble responses to fully textured stimuli. In both cases, when tested with strobed stimuli, we found that, as the strobe period increased, responses became less discriminative and more phasic, with individual bursts of activity often visible at longer periods. The white formless dot field stimuli tended to drive only minimally discriminative responses, although they were robustly visual. Figure 11 shows peristimulus time histograms for one example unit.
Figure 11.
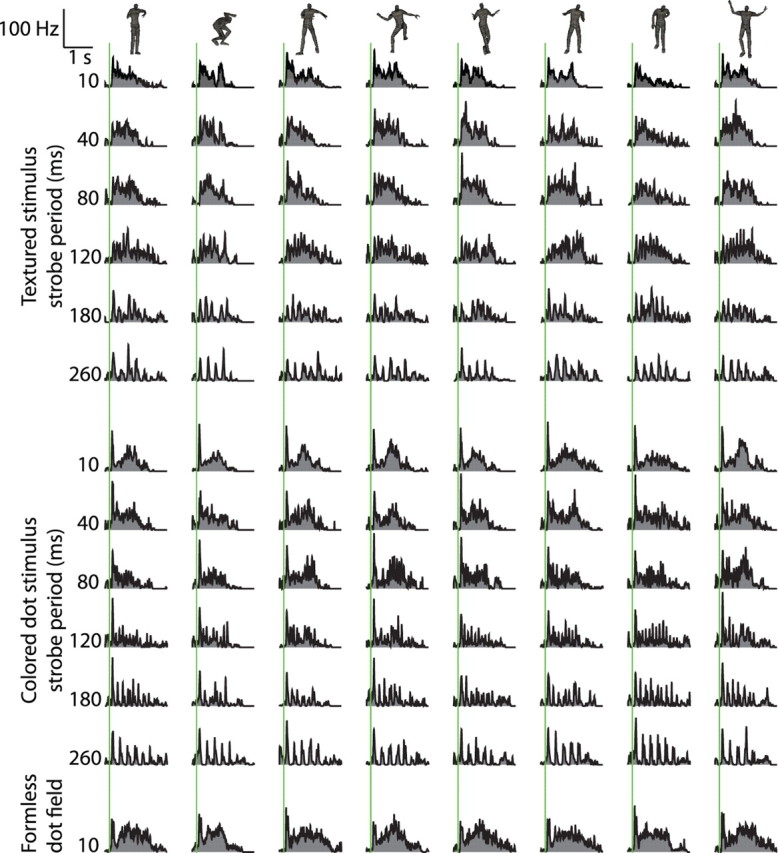
Responses of one unit in the reduced action recognition task. The top block of peristimulus time histograms shows responses to the eight actions performed by fully textured characters at six increasing strobe periods. The middle block shows responses to the actions rendered as colored dot fields, at the same strobe periods. The bottom row shows responses to the actions rendered as formless dot fields. Green lines indicate stimulus onset. Calibration at the top left gives scales for firing rate and time in all plots. Note that, at longer strobe periods, responses to individual image onsets are apparent.
The neurons from which we recorded exhibit properties similar to the properties ascribed by a functional MRI (fMRI) study to the lower superior temporal (LST) area (Nelissen et al., 2006); our recording sites were several millimeters more anterior than those described by Nelissen et al., although the difference might be partially explained by our monkey's 2:1 size advantage. Comparing the locations of their LST and our recording sites relative to nearby landmarks, it seems possible that at least some of the cells from which we recorded were located in this area.
To analyze the resulting data more quantitatively, we constructed and tested Poisson models as in the action recognition task. Because we only used one character at a time, the models only have to distinguish between the eight actions. Models constructed from fully textured and from colored dot field full-motion trials do well at classifying their respective left-out trials, correctly identifying an average of approximately six of the eight actions. As strobe period increases, the resulting models perform less well but still considerably above chance (averaging four or more correct, depending on period). The model generated from formless dot field stimuli performs worse than any of the other models, although it still reaches an average performance of ∼3.5 correct classifications by the end of the 1320 ms used. Figure 12 shows cumulative performance averaged across 200 instances of each model, for all these models. In all cases, performance is significantly above chance (t test and permutation test, p < 0.01).
Figure 12.

Performance of models based on reduced action recognition task trials. Each bar gives the mean number of actions correctly identified (of 8 actions, in total) by the model generated from trials of its respective stimulus type, tested with that same type of trial. Means were calculated across 200 instances of each model; they give an indication of how well this population of cells can encode actions, given stimuli with different strobe frequencies and rendering styles.
We also used these Poisson models to compare population codes between different stimulus types. Because we were interested in comparing the effects of removing form information and removing motion information, we used the full-motion colored dot field models as the baseline point of comparison. Using these models, we tested data from trials at the five strobe frequencies with colored dots (bringing the stimuli successively farther from full motion) and the formless dot field stimuli (removing all explicit form). These models classified strobed colored dot stimuli fairly well, with decreasing performance as strobe period increased. They performed barely (but significantly; t test, p < 0.05) above chance level on formless dot field trials and at the longest period of colored dot fields. Performance, averaged across 200 instances of each model, is shown in Figure 13. Performance levels at all conditions are significantly different from each other except for 260 ms strobed colored dot fields and formless dot fields, for which the poor performances are indistinguishable (permutation test, p > 0.2).
Figure 13.

Generalization of the model generated from full-motion colored-dot stimuli. This model was used to evaluate trials with colored-dot stimuli at different strobe periods, as well as trials in which formless dot field stimuli were presented. Each test was repeated 200 times, with a random selection of trials, and the mean performance is indicated here.
The model based on full-motion colored dot field trials performs marginally above chance even when applied to the longest period (260 ms) colored dot field trials, indicating that even the phasic stimulus-locked bursts of activity in the strobe trials have something in common with the responses to full-motion stimuli. In fact, this model generalizes to 260 ms colored dot field trials better than the model based on full-motion textured trials generalizes to 120 ms textured strobe trials (data not shown). This counterintuitive result may be attributable to the engagement of static object-recognition processes, based on detailed form and texture information, in the case of fully textured low-frequency strobe flashes. These could overpower the action information implicit in sparse sequences of poses. In the absence of such rich form information, however (i.e., in the colored dot field case), all that remains is this limited pose information, which engages the same action processing mechanisms as in the full-motion version.
Such an explanation could also explain the different quality of the neural response to formless dot fields. These stimuli contain the same motion information as colored dot fields and essentially the same motion information as fully textured actions but drive responses that are so different from the responses to naturalistic actions that models built off of responses to naturalistic actions perform extremely poorly when applied to formless dot field trials. Local motion information present in all three types of stimuli may only be strong enough to drive the responses of these cells (or might only be represented at all) when form/pose information is absent. It is also possible that the neurons from which we recorded never receive direct input of motion information and that even the observed discrimination of formless dot fields arises from pose information received from some source of structure-from-motion information (Orban et al., 1999).
Neural responses in clipped action viewing task
Only successfully completed trials were considered for analysis. We recorded from 60 neurons at 29 sites in monkey G and 63 neurons at 28 sites in monkey R. We excluded neurons for which a Poisson model classifier (as described above in Materials and Methods, Poisson models) was unable to discriminate between full-motion versions of the two actions with at least 95% certainty. This left 43 neurons from monkey G and 53 from monkey R. Any difference in the character of the neural responses between monkeys was overshadowed by differences between individual neurons; we therefore combined the two monkeys' data for all analyses. Figure 14 shows one example unit, which was most active when the hand moved through the “L” phases of actions. This sort of response, driven by one or the other main phase of action, was common but not the only sort we observed. Data from this neuron were used in Figure 5 as well.
Figure 14.

Responses of one sample neuron in the clipped action viewing task. Large plots show the responses of the cell to the two actions, collapsed across all treatments (full-motion and all clip lengths). The small plots to the right show the same responses, split up by clip length. In order, from top to bottom, these are 10 (full-motion), 40, 80, 120, 200, 300, and 600 ms. Responses are relatively invariant to clip length, driven by the “L” phase of the action regardless of how it is presented.
Figure 15 shows means for both similarity scores plotted at the six clip lengths tested. An ANCOVA failed to find any linear dependence on clip length when considering local and global similarity scores combined together (p > 0.1). With increasing clip length, local similarity scores increased and global similarity scores decreased relative to the combined population trend (p < 0.0001). Paired t tests at each clip length confirm that the local similarity scores and the global similarity scores are significantly different (p < 0.01) at all clip lengths except for 200 ms (p > 0.5). The same analysis of the data from the formless dot field versions of the stimuli revealed no results that were systematically significant other than a very small increase in the similarity scores (taken together) as clip length increased (p < 0.05). That local and global similarity scores in formless dot field trials are so poor and so similar suggests that these neurons are not able to extract very much information from these stimuli. This is not surprising, especially at the shorter clip lengths; it is difficult to establish and maintain correspondences between frames when the entire display changes radically several times per second. These values may be seen as liberal estimates for the similarity scores of stimuli between which these cells are unable to discriminate.
Figure 15.

Local and global similarity scores averaged across all action-discriminative cells in the population. Both scores are derived from comparisons of neural responses to matching frames of animation. The local similarity score was calculated by comparing responses to frames with identical local context, up to the limit of the clip size; global similarity score comes from comparing responses to frames in clips in which the local (within-clip) context is reversed but whose overall sequencing in the course of the action (between clips) matched. All differences are significant except for 20 frame (200 ms) clips. The dashed traces show the same values calculated from formless dot field trials. No differences reach significance, Bonferroni's corrected (and only at 80 ms are the differences significant without correcting for multiple comparisons, p < 0.05). Error bars indicate SEM.
The data indicate that, at clip lengths shorter than 200 ms, frames in full-motion trials elicit responses more like their matches in clipped trials with the same global pose progression. At clip lengths longer than 200 ms, however, responses to frames in full-motion trials resemble more the responses to their matches in clipped trials with the same local motion. Temporal context is important in determining neural response to a particular frame. Below 200 ms, the more important context is provided by what happens between clips; with long clips, the content within each clip exerts more contextual influence on response to each frame. Especially when taken with the results of the reduced action recognition task, this strongly suggests that neurons in the temporal lobe are integrating across ∼120 ms to build pose representations. The sequence of these poses then drives the action-specific response. As clip length increases in this experiment, individual clips become long enough that they contain multiple such poses. Eventually, the sequences of poses within each clip become more important than the between-clip sequences, causing the primacy of within-clip context seen at the longest clip lengths.
Selectivity and invariance
As noted previously, the neurons from which we recorded generally exhibited complex and sustained patterns of activity in response to our stimuli. While searching for neurons, we flashed static isolated images on the monitor in front of the monkey and typically observed stereotypical patterns of object selectivity. As soon as we found a visually responsive cell, we would attempt to achieve a stable signal. This done, we would begin the experiments. We did not preselect cells by any criterion other than having a visual response. We were therefore surprised at the rich variety of complex and extended responses we observed.
Although these neurons were not selective for moving characters in the conventional sense of responding more robustly to one stimulus than to all the others, they clearly carried information about the stimuli. We observed invariance for both character identity and action. A large minority of cells carried significant information about what character was shown but were invariant to the action performed. Although only a small number of neurons discriminated actions while remaining completely invariant to character identity, the cells that carried information about both stimulus dimensions generally showed common response features that were preserved regardless of which character was performing them (Fig. 8).
Discussion
In this study, we have raised and suggested an answer to a fundamental question about the neural underpinnings of an important aspect of visual perception: where and how are viewed articulated actions represented in the brain? We have shown that neurons in the superior temporal sulcus and inferior temporal cortex can represent not only the static form information with which they are often stimulated experimentally but the dynamic articulated action information that is so important in natural viewing conditions. Although they can extract information about actions from motion input, it is not the predominant source of action information. Instead, actions appear to be encoded as sequences of poses derived from visual form input integrated across 100 ms or more.
Fundamentally, any stimulus shown on a cathode ray tube monitor is a sequence of snapshots; at refresh rates of 100 Hz, however, such displays appear no different from true motion. The visual system ignores the jumps between frames. As anyone who has ever watched poorly animated cartoons can attest, even much lower frame rates with noticeable jumps between poses are sufficient to give a strong impression of action, without a compelling local motion percept. The results of the reduced action recognition task show that temporal cortex neurons can encode actions using either kind of information.
In the cell population from which we recorded, the removal of form information disrupts normal action representations much more than the removal of motion information (Fig. 12). This suggests that action representations are based more on form information, when both are available. These neurons were able to extract as much information about action from two or three static frames as they were from full-motion information in the absence of form cues. Moreover, the responses of neurons under all but the slowest strobe conditions were much more similar to how the neurons responded under natural viewing conditions than were responses to formless (but full-motion) dot fields (Fig. 13). This is in accord with recent fMRI evidence: Peelen et al. (2006) found correlations in fMRI signal between selectivity for biological motion and selectivity for bodies, but not selectivity for motion, in every brain region they considered. The neurons from which we recorded certainly carry information about action: at least 0.1 bit per neuron over the course of less than 1 s of animation, based on the ability of our simple model to discriminate actions. We have no way of knowing whether the cell populations we examined are normally necessary for biological motion perception; however, a study of human lesions showed that loss of tissue in the superior temporal gyrus, superior temporal sulcus, and middle temporal gyrus (along with frontal and supramarginal cortex) was implicated in significant biological motion perception deficits (Saygin, 2007).
Previous fMRI (Nelissen et al., 2006) and single-neuron (Vangeneugden et al., 2009) recordings have suggested that various regions of temporal cortex respond and adapt differently to different aspects of moving stimuli. However, we could not find any correlations between recording location and any of our mutual information measures in either monkey in the action recognition task. Although this might be explained by imprecision in locating the neurons from which we recorded, our stimuli were more complex than those used in previous experiments. The response patterns we observed were also more complex than those previously reported, and, in fact, most visual neurons that we encountered were well driven by most of the stimuli we used. It would not be surprising if a larger input space were mapped onto a larger region of representation space, that is, cortex. Without a histological study (which is not possible because the monkeys are still involved in other experiments), we have no way of distinguishing between these possibilities.
At timescales shorter than 200 ms, the temporal direction of local motion in the clipped action viewing task is less important to driving responses than the more global sequence of poses (Fig. 15). In other words, the neurons are driven more by what happens from clip to clip than they are by what happens within a clip. For animation clips longer than 200 ms, however, this reverses; the direction in which each clip plays exerts more influence on the responses of the neurons than does the order in which the clips play.
This result can be viewed as a measure of the timescale of integration (into a single pose) versus differentiation (between poses). Short clips are integrated into single elements, in terms of their representational power, whereas longer clips are differentiated into multiple pieces. The shift occurs as clips grow from 120 to 300 ms. Effectively, increasing clip length decreases the frame rate of the original action and increases the “actionhood” of the individual clips, which shift from being interpreted as poses to segments of the opposite action (Fig. 16). This result can also be understood from the perspective of the influence of recent input (that is, context or history) on neural response. The history leading up to a single frame of animation influences the response that frame elicits; this influence appears to span 120–200 ms.
Figure 16.

A, When the reversed clips are short (thick arrows), the information from the small number of similar video frames in each clip is integrated into a single pose representation (stick figure). Neural responses are driven by the sequence of these poses (thin arrows). B, As clip length grows, more frames are integrated into a smaller number of pose representations. C, The neural representation of a sufficiently long clip begins to resemble the representation of the matching part of the reversed action. This could be attributable to the development of a motion-based representation (motion vectors between the poses on top). Our results, however, suggest that the frames within such long clips are integrated into several poses (bottom), the sequence of which matches the sequence in the appropriate segment of the reversed action.
The idea of a neural window of pose integration fits well with many previous behavioral studies. Face parts are integrated into a holistic face percept when presented with interstimulus intervals as long as 120 ms (Singer and Sheinberg, 2006) or even 200 ms (Anaki et al., 2007). Caudek et al. (2002) found that three-dimensional motions can be determined by three dots presented sequentially for 182 ms each. EEG event-related potentials exhibit a characteristic component (putatively reflecting a break in integration) when one element of a rapidly presented visual sequence is omitted, as long as the period is faster than 180 ms (Czigler et al., 2006). Blake and Lee (2005) survey numerous other experiments, many of which show windows of integration in the range of 100–200 ms.
Although these results strongly suggest that ventral stream neurons in the temporal cortex represent actions as sequences of poses, there is still much to understand about action recognition. Motion information clearly does reach these neurons; could this be an epiphenomenon of form extracted from motion (Orban et al., 1999)? It is also not clear whether this pose-based temporal lobe representation is the primary visual representation of complex motions; neurons in frontal and parietal cortices, including mirror neurons (Rizzolatti and Craighero, 2004), also respond to viewed actions. Although there may be dorsal stream neurons selective for complex patterns of motion, they are typically described as selective for relatively simple patterns compatible with rigid object motion (Orban et al., 1992), as well as for three-dimensional depth derived from disparity (DeAngelis et al., 1998) or parallax (Nadler et al., 2008). The results presented here are compatible with a model of visual function in which the locations of the objects and changes in location are represented by the dorsal stream, whereas their shapes, and changes in those shapes, are represented by ventral stream neurons, updated several times per second.
Footnotes
This work was supported by the James S. McDonnell Foundation, National Institutes of Health Grant R01EY014681, and National Science Foundation Grants SBE-0542013 (to the Temporal Dynamics of Learning Center) and IIS-0827427. We thank Cheston Tan and Feraz Azhar for helpful comments about this manuscript.
References
- Anaki D, Boyd J, Moscovitch M. Temporal integration in face perception: evidence of configural processing of temporally separated face parts. J Exp Psychol Hum Percept Perform. 2007;33:1–19. doi: 10.1037/0096-1523.33.1.1. [DOI] [PubMed] [Google Scholar]
- Anderson B, Sanderson MI, Sheinberg DL. Joint decoding of visual stimuli by IT neurons' spike counts is not improved by simultaneous recording. Exp Brain Res. 2007;176:1–11. doi: 10.1007/s00221-006-0594-4. [DOI] [PubMed] [Google Scholar]
- Baizer JS, Ungerleider LG, Desimone R. Organization of visual inputs to the inferior temporal and posterior parietal cortex in macaques. J Neurosci. 1991;11:168–190. doi: 10.1523/JNEUROSCI.11-01-00168.1991. [DOI] [PMC free article] [PubMed] [Google Scholar]
- Beauchamp MS, Lee KE, Haxby JV, Martin A. fMRI responses to video and point-light displays of moving humans and manipulable objects. J Cogn Neurosci. 2003;15:991–1001. doi: 10.1162/089892903770007380. [DOI] [PubMed] [Google Scholar]
- Blake R, Lee SH. The role of temporal structure in human vision. Behav Cogn Neurosci Rev. 2005;4:21–42. doi: 10.1177/1534582305276839. [DOI] [PubMed] [Google Scholar]
- Bruce C, Desimone R, Gross CG. Visual properties of neurons in a polysensory area in superior temporal sulcus of the macaque. J Neurophysiol. 1981;46:369–384. doi: 10.1152/jn.1981.46.2.369. [DOI] [PubMed] [Google Scholar]
- Caudek C, Domini F, Di Luca M. Short-term temporal recruitment in structure from motion. Vision Res. 2002;42:1213–1223. doi: 10.1016/s0042-6989(02)00052-4. [DOI] [PubMed] [Google Scholar]
- Czigler I, Winkler I, Pató L, Várnagy A, Weisz J, Balázs L. Visual temporal window of integration as revealed by the visual mismatch negativity event-related potential to stimulus omissions. Brain Res. 2006;1104:129–140. doi: 10.1016/j.brainres.2006.05.034. [DOI] [PubMed] [Google Scholar]
- DeAngelis GC, Cumming BG, Newsome WT. Cortical area MT and the perception of stereoscopic depth. Nature. 1998;394:677–680. doi: 10.1038/29299. [DOI] [PubMed] [Google Scholar]
- Downing PE, Jiang Y, Shuman M, Kanwisher N. A cortical area selective for visual processing of the human body. Science. 2001;293:2470–2473. doi: 10.1126/science.1063414. [DOI] [PubMed] [Google Scholar]
- Gross CG, Rocha-Miranda CE, Bender DB. Visual properties of neurons in inferotemporal cortex of the macaque. J Neurophysiol. 1972;35:96–111. doi: 10.1152/jn.1972.35.1.96. [DOI] [PubMed] [Google Scholar]
- Grossman E, Donnelly M, Price R, Pickens D, Morgan V, Neighbor G, Blake R. Brain areas involved in perception of biological motion. J Cogn Neurosci. 2000;12:711–720. doi: 10.1162/089892900562417. [DOI] [PubMed] [Google Scholar]
- Jellema T, Perrett DI. Cells in monkey STS responsive to articulated body motions and consequent static posture: a case of implied motion? Neuropsychologia. 2003;41:1728–1737. doi: 10.1016/s0028-3932(03)00175-1. [DOI] [PubMed] [Google Scholar]
- Jellema T, Maassen G, Perrett DI. Single cell integration of animate form, motion and location in the superior temporal cortex of the macaque monkey. Cereb Cortex. 2004;14:781–790. doi: 10.1093/cercor/bhh038. [DOI] [PubMed] [Google Scholar]
- Johansson G. Visual perception of biological motion and a model for its analysis. Percept Psychophys. 1973;14:201–211. [Google Scholar]
- Nadler JW, Angelaki DE, DeAngelis GC. A neural representation of depth from motion parallax in macaque visual cortex. Nature. 2008;452:642–645. doi: 10.1038/nature06814. [DOI] [PMC free article] [PubMed] [Google Scholar]
- Nelissen K, Vanduffel W, Orban GA. Charting the lower superior temporal region, a new motion-sensitive region in monkey superior temporal sulcus. J Neurosci. 2006;26:5929–5947. doi: 10.1523/JNEUROSCI.0824-06.2006. [DOI] [PMC free article] [PubMed] [Google Scholar]
- Oram MW, Perrett DI. Integration of form and motion in the anterior superior temporal polysensory area (STPa) of the macaque monkey. J Neurophysiol. 1996;76:109–129. doi: 10.1152/jn.1996.76.1.109. [DOI] [PubMed] [Google Scholar]
- Orban GA, Lagae L, Verri A, Raiguel S, Xiao D, Maes H, Torre V. First-order analysis of optical flow in monkey brain. Proc Natl Acad Sci U S A. 1992;89:2595–2599. doi: 10.1073/pnas.89.7.2595. [DOI] [PMC free article] [PubMed] [Google Scholar]
- Orban GA, Sunaert S, Todd JT, Van Hecke P, Marchal G. Human cortical regions involved in extracting depth from motion. Neuron. 1999;24:929–940. doi: 10.1016/s0896-6273(00)81040-5. [DOI] [PubMed] [Google Scholar]
- Paxinos G, Huang XF, Toga AW. The rhesus monkey brain in stereotaxic coordinates. San Diego: Academic; 2000. [Google Scholar]
- Peelen MV, Wiggett AJ, Downing PE. Patterns of fMRI activity dissociate overlapping functional brain areas that respond to biological motion. Neuron. 2006;49:815–822. doi: 10.1016/j.neuron.2006.02.004. [DOI] [PubMed] [Google Scholar]
- Perrett DI, Smith PA, Mistlin AJ, Chitty AJ, Head AS, Potter DD, Broennimann R, Milner AD, Jeeves MA. Visual analysis of body movements by neurones in the temporal cortex of the macaque monkey: a preliminary report. Behav Brain Res. 1985;16:153–170. doi: 10.1016/0166-4328(85)90089-0. [DOI] [PubMed] [Google Scholar]
- Quiroga RQ, Nadasdy Z, Ben-Shaul Y. Unsupervised spike detection and sorting with wavelets and superparamagnetic clustering. Neural Comput. 2004;16:1661–1687. doi: 10.1162/089976604774201631. [DOI] [PubMed] [Google Scholar]
- Rizzolatti G, Craighero L. The mirror-neuron system. Annu Rev Neurosci. 2004;27:169–192. doi: 10.1146/annurev.neuro.27.070203.144230. [DOI] [PubMed] [Google Scholar]
- Saleem KS, Logothetis NK. A combined MRI and histology atlas of the rhesus monkey brain in stereotaxic coordinates. Ed 1. Boston: Elsevier; 2006. [Google Scholar]
- Saygin AP. Superior temporal and premotor brain areas necessary for biological motion perception. Brain. 2007;130:2452–2461. doi: 10.1093/brain/awm162. [DOI] [PubMed] [Google Scholar]
- Singer JM, Sheinberg DL. Holistic processing unites face parts across time. Vision Res. 2006;46:1838–1847. doi: 10.1016/j.visres.2005.11.005. [DOI] [PubMed] [Google Scholar]
- Singer JM, Sheinberg DL. A method for the realtime rendering of formless dot field structure-from-motion stimuli. J Vis. 2008;8:8.1–8.8. doi: 10.1167/8.5.8. [DOI] [PMC free article] [PubMed] [Google Scholar]
- Treisman AM, Gelade G. A feature-integration theory of attention. Cognit Psychol. 1980;12:97–136. doi: 10.1016/0010-0285(80)90005-5. [DOI] [PubMed] [Google Scholar]
- Ungerleider LG, Mishkin M. Two cortical visual systems. In: Ingle DJ, Goodale MA, Mansfield RJW, editors. Analysis of visual behavior. Cambridge, MA: Massachusetts Institute of Technology; 1982. pp. 549–586. [Google Scholar]
- Vangeneugden J, Pollick F, Vogels R. Functional differentiation of macaque visual temporal cortical neurons using a parametric action space. Cereb Cortex. 2009;19:593–611. doi: 10.1093/cercor/bhn109. [DOI] [PubMed] [Google Scholar]
- Victor JD. Binless strategies for estimation of information from neural data. Phys Rev E Stat Nonlin Soft Matter Phys. 2002;66 doi: 10.1103/PhysRevE.66.051903. 051903. [DOI] [PubMed] [Google Scholar]
- Wu DA, Kanai R, Shimojo S. Vision: steady-state misbinding of colour and motion. Nature. 2004;429:262. doi: 10.1038/429262a. [DOI] [PubMed] [Google Scholar]