

Abstract
The db/db mouse is a widely used preclinical model in diabetes research. Recent studies have shown that these mice also display aspects of psychosis and depression-like behaviors as seen in some psychiatric disorders. Here, we have performed multiplex immunoassay and liquid chromatography mass spectrometry profiling of the plasma and brain samples from db/db and control mice to identify altered pathways, which could be related to these behavioral abnormalities. This is the first study to carry out profiling of the brain proteome in this model. Plasma from the db/db mice had increased levels of leptin and insulin, decreased levels of peptide YY, glucagon and prolactin and alterations in inflammation-related proteins, compared with control mice. Frontal cortex tissue from the db/db mice showed changes in proteins involved in energy metabolism, cellular structure and neural functioning, and the hippocampus had changes in proteins involved in the same pathways, with additional effects on cellular signalling proteins. The overlap of these findings with effects seen in type 2 diabetes, schizophrenia, major depressive disorder and Alzheimer's disease might contribute to a common endophenotype seen in metabolic and neurological disorders.
Keywords: biomarkers, db/db mouse, diabetes, pathway analysis, proteomics, psychiatric disorders
Introduction
The link between metabolic conditions such as diabetes and psychiatric disorders has been reported widely.1 In most cases, metabolic abnormalities have been identified in association with psychiatric disorders as a side effect induced by commonly prescribed anti-psychotic medications.2 However, recent studies have shown that such changes can occur at disease onset even before medications have been applied. For example, hyperinsulinemia and insulin resistance have been reported in first onset, antipsychotic naive schizophrenia patients in several studies over the past decade.3, 4 This indicates that there may be an etiological link between metabolic and psychiatric conditions, which could be an important consideration in downstream treatment approaches.
The db/db mouse has been used as a model of type 2 diabetes mellitus and other metabolic conditions, such as obesity and dyslipidemia.5 This model was first described in 1965 by Hummel et al.,6 who identified random mutations in mice associated with obesity and excessive hunger. The models were later segregated as ob/ob mice with gene mutations for leptin, and db/db mice that have mutations for the gene encoding the long isoform of the leptin receptor, localized mainly in the hypothalamic region of the brain.7 The db/db mouse model mirrors the clinical picture of type 2 diabetes mellitus.
A recent study found that hippocampal inflammation in db/db mice is associated with increased anxiety-like behavior.8 It has been reported that patients with diabetes have an increased probability of developing major depressive disorder9 and Alzheimer's disease or cognitive impairments10 compared with non-diabetic people. It has also been suggested that type 2 diabetes and Alzheimer's disease share similar biochemical and molecular features.11 Consistent with the link between psychiatric and metabolic disorders, recent studies have shown that db/db mice exhibit behavioral abnormalities, such as impairments in memory function and long-term potentiation, as well as depression and psychosis-like behaviors.12, 13 Furthermore, treatment of db/db mice with anti-diabetic medications such as rosiglitazone has led to improved insulin signalling along with a decrease in measures of depression but not in psychosis-like behaviors.14
In this study, we have carried out molecular profiling of plasma samples from db/db mice in order to identify peripheral molecular pathways, which are altered in this model. In addition, we have carried out the first proteomic profiling analysis of brain tissues from these mice in order to gain insight into the altered molecular pathways associated with the observed schizophrenia- and depression-like behaviors.
Materials and methods
Animals
Male db/db mice (10-week old; background strain C57BL/KsJ (BKS-Cg-Dock7m +/+ Leprdb/J)) and age-matched non-diabetic lean control C57BL/KsJ mice (Jackson Laboratories; Bar Harbor, ME, USA) were housed singly in plastic cages with wooden shavings in a temperature controlled room (22–23 °C) on a 12-h/12-h light/dark cycle (lights on at 0500 hours) (Table 1). Single housing of db/db mice is routinely practiced in our lab and by most of the labs worldwide. Housing at this temperature range results in no change in diurnal rhythm of db/db mice compared with control mice.15 To assess the metabolic status of the mice, body weight, food consumption and water intake were monitored weekly (Table 2). Blood samples were taken from a cut made on the tip of the tail from each mouse and glucose concentrations were determined using an Accu-Check Advantage Blood Glucose Monitor (Roche Diagnostic Corporation, Indianapolis, IN, USA) to confirm development of diabetes in db/db mice compared with that in lean controls. Body fat composition was measured as described previously.13 The EchoMRI whole-body composition analyzer (Houston, TX, USA) was used to determine fat and lean body mass.16 Fat and lean mass were calculated as percentage of total mass. A total of 20 mice (10 db/db and 10 lean control mice) were killed according to schedule 1, decapitated and trunk blood was collected in ice-chilled tubes containing EDTA and centrifuged at1100 g, 4 °C for 15 min. Plasma was immediately separated and stored frozen at −80 °C for later use. Frontal cortex and hippocampal regions of the brain were dissected on ice and immediately frozen at −80 °C. All experiments were carried out in full compliance with the principles of laboratory animal care (NIH publication no. 85–23, revised 1985), and the protocols were approved by the Wright State University Animal Care and Use Committee.
Table 1. Physical and metabolic characteristics of db/db and control mice.
| Parameter | Control | db/db |
|---|---|---|
| Age (weeks) | 10 | 10 |
| Body weight (g) | 25.2±0.6 | 36.0±1.2* |
| Blood glucose (mg dl−1) | 140.3±8.8 | 583.2±35.9* |
| Plasma insulin (ng ml−1) | 1.3±0.2 | 4.6±1.5* |
| Percentage of fat mass | 17.9±1.0 | 58.9±0.8* |
| Percentage of lean mass | 70.4±1.0 | 42.7±1.4* |
*P<0.05 (unpaired t-test).
Table 2. Food and water consumption of db/db and control mice.
| Mouse strain | N | Food intake (g per day per mouse) | Water intake (gper day per mouse) |
|---|---|---|---|
| Lean control | 10 | 3.85±0.11 | 9.76±0.89 |
| db/db | 10 | 6.74±0.37* | 20.15±2.39* |
*P<0.05 versus lean control mice, unpaired t-test.
Plasma insulin measurements
Plasma insulin levels were determined at Mouse Metabolic Phenotyping Centre (Cincinnati, OH, USA) by using the commercial immunoassay kits (Millipore, St Charles, MO, USA) according to the manufacturer's specifications. Briefly, standards, quality controls and samples were incubated for 2 h in microplate wells pre-coated with mouse anti-rat insulin antibodies (80 μl per well). After washing, biotin-labeled polyclonal antibodies were added (100 μl per well) followed by incubation for 30 min. After washing, horse radish peroxidase conjugate and the substrate 3,3',5,5'-tetramethylbenzidine solution (100 μl per well) were added for a 15-min incubation. The reactions were halted by addition of 100 μl per well 0.3 ℳ HCl, and the absorbance of the resulting color product was measured at λ=450 nm. The concentrations of the experimental samples were determined by comparison of the absorbance values with those of a standard curve, constructed using 0.2, 0.5, 1, 2, 5 and 10 ng ml−1 insulin.
Multiplex immunoassay profiling
Plasma samples were analyzed using the RodentMAP, Rat MetabolicMAP and Rat KidneyMAP platforms comprising multiplexed immunoassays for a total of 89 analytes (86 proteins and 3 steroid hormones) (Supplementary Table S1) in a Clinical Laboratory Improved Amendments (CLIA)-certified laboratory at Myriad-RBM (Austin, TX, USA) as described recently.17 Immunoassays were calibrated using duplicate standard curves for each analayte and raw intensity measurements converted to protein concentrations using proprietary software. Multiplexed calibrators (eight levels per analyte) and controls (three levels per analyte) are developed to monitor key performance parameters, such as lower limit of quantification, precision, cross-reactivity, linearity, spike-recovery, dynamic range, matrix interference, freeze–thaw stability, and short-term sample stability are established for every assay as described by the manufacturer (http://www.myriadrbm.com/technology/data-quality/). Data analyses were performed using the statistical software package R (http://www.r-project.org) and the levels of analytes were determined. Analyses were conducted under blinded conditions with respect to sample identities, and samples were analyzed in random order to avoid any sequential biases.
Liquid chromatography mass spectrometry (LC-MSE) profiling
Frontal cortex and hippocampus tissues from db/db (n=10) and control (n=10) mice were sonicated in a buffer comprised of 7 ℳ urea, 2 ℳ thiourea, 4% chaps, 2% ASB14, 70 mℳ dithiothreitol and protease inhibitors (5:1 (v/w) ratio) at a 5:1 (v/w) ratio and mixed for 30 min. Samples were centrifuged for 3 min at 17 000 g at 4 °C and the supernatants recovered. Protein concentrations of the lysates were determined using a Bradford assay (Bio-Rad; Hemel Hempstead, UK). Proteins (approximately 100 μg) were precipitated using acetone, centrifuged for 3 min at 17 000 g at 4 °C and the pellets suspended in 50 mℳ ammonium bicarbonate. Disulfide bonds were reduced in 5 mℳ dithiothreitol at 60 °C for 30 min, and free sulfhydryl groups were alkylated by incubation in 10 mℳ iodacetamide in the dark at 37 °C for 30 min. Protein digestion was conducted using porcine trypsin at a 1:50 (w/w) ratio for 17 h at 37 °C, and reactions were stopped by addition of 8.8 ℳ HCl at a 1:60 (w/w) ratio. Quality control samples consisting of frontal cortex and hippocampus protein extracts from a wild-type mouse were prepared as above and underwent all experimental steps in parallel with the test samples to monitor machine performance.
LC-MSE analyses were carried out in triplicate of individual samples as described previously.18 Samples were diluted in 0.1% formic acid (Sigma-Aldrich; Poole, UK) to a final peptide concentration of 0.12 μg μl−1 and reverse phase LC separation was performed using a nanoACQUITY system (Waters Corporation; Milford, MA, USA) comprised of a C18 trapping column (180 μm × 20 mm; 5 μm particle size) and a C18 BEH nanocolumn (75 μm × 200 mm; 1.7 mm particle size). The buffers were as follows: (A) H2O+0.1% formic acid and (B) acetonitrile (Sigma-Aldrich)+0.1% formic acid. Initial buffer concentrations were 3% B (97% A) followed by 3–30% B over 90 min, 30−90% B over 25 min, 90−97% B over 5 min, constant 97% B for 10 min and 97−3% B over 1 min. The column was coupled online to a nanoESI emitter on a quadrupole time-of-flight (Q-TOF Premier) mass spectrometer (Waters Corporation). Approximately 500 fmol μl−1 of Glu Fibrinopeptide B (Waters Corporation) was infused every 30 s using a lock spray for mass calibration. The mass spectrometer was operated in V mode and analyses were performed using positive nanoESI ion mode. The collision energy was 5 eV for low-energy scans and ramped from 17 to 40 eV for high-energy scans with a cycle time of 1.3 s. The low collision energy generates intact precursor ion data, and the high collision energy provides information about the peptide fragments.
Data analysis
Analysis of multiplex immunoassay profiling data was conducted using nonparametric Wilcoxon rank-sum tests to account for any uneven distribution of the data. P<0.05 was considered as statistically significant. LC-MSE data were processed using ProteinLynx Global Server (PLGS) v.2.4 (Waters Corporation) and Rosetta Elucidator v.3.3 (Rosetta Biosoftware; Seattle, WA, USA) for time and mass/charge alignment of ion fragments as described previously.18 The Mus musculus complete proteome FASTA (sourced from www.uniprot.org) sequence Integr8 database was used for the appropriate protein searches. Acceptable modifications were set to include oxidation of methionine and phosphorylation of serine, threonine or tyrosine residues. The criteria for valid protein identifications were set at a minimum of three fragment ions/peptide ion and seven fragment ions/protein and detection of peptides in at least two out of three replicates. In addition, proteins had to be identified in 60% of samples to ensure biological reproducibility. The results were imported into Elucidator for alignment and annotation of the features. The end result was a matrix that included peptide intensities for each sample. Proteins identified by ⩾2 peptides were considered for further analyses (Supplementary Table S2).
Statistical analyses
Significant differences in protein expression generated by the LC-MSE analyses, between db/db and control mice, were determined using Wilcoxon signed-rank tests (P<0.05). The false discovery rate was calculated, although no adjustments were made for multiple comparisons in order to not exclude possible true positives. Nevertheless, only those molecules with a false discovery rate <0.4 and a fold change cut off of 0.10 for the LC-MSE analyses were applied in order that only those molecules with the most robust changes were considered.
Classification of differentially expressed proteins
The UniProt accession codes of significantly altered proteins found in brain tissues from db/db and control mice were uploaded to the Ingenuity Pathway Analysis Knowledge Base (IPKB; Ingenuity Systems; Mountain View, CA, USA). Networks and pathways that were most significant to the data set were determined by overlaying the uploaded proteins onto predefined pathway maps in the IPKB. A right-tailed Fisher's exact test was used to calculate the P-values associated with the identified canonical pathways.
Results
Plasma analysis
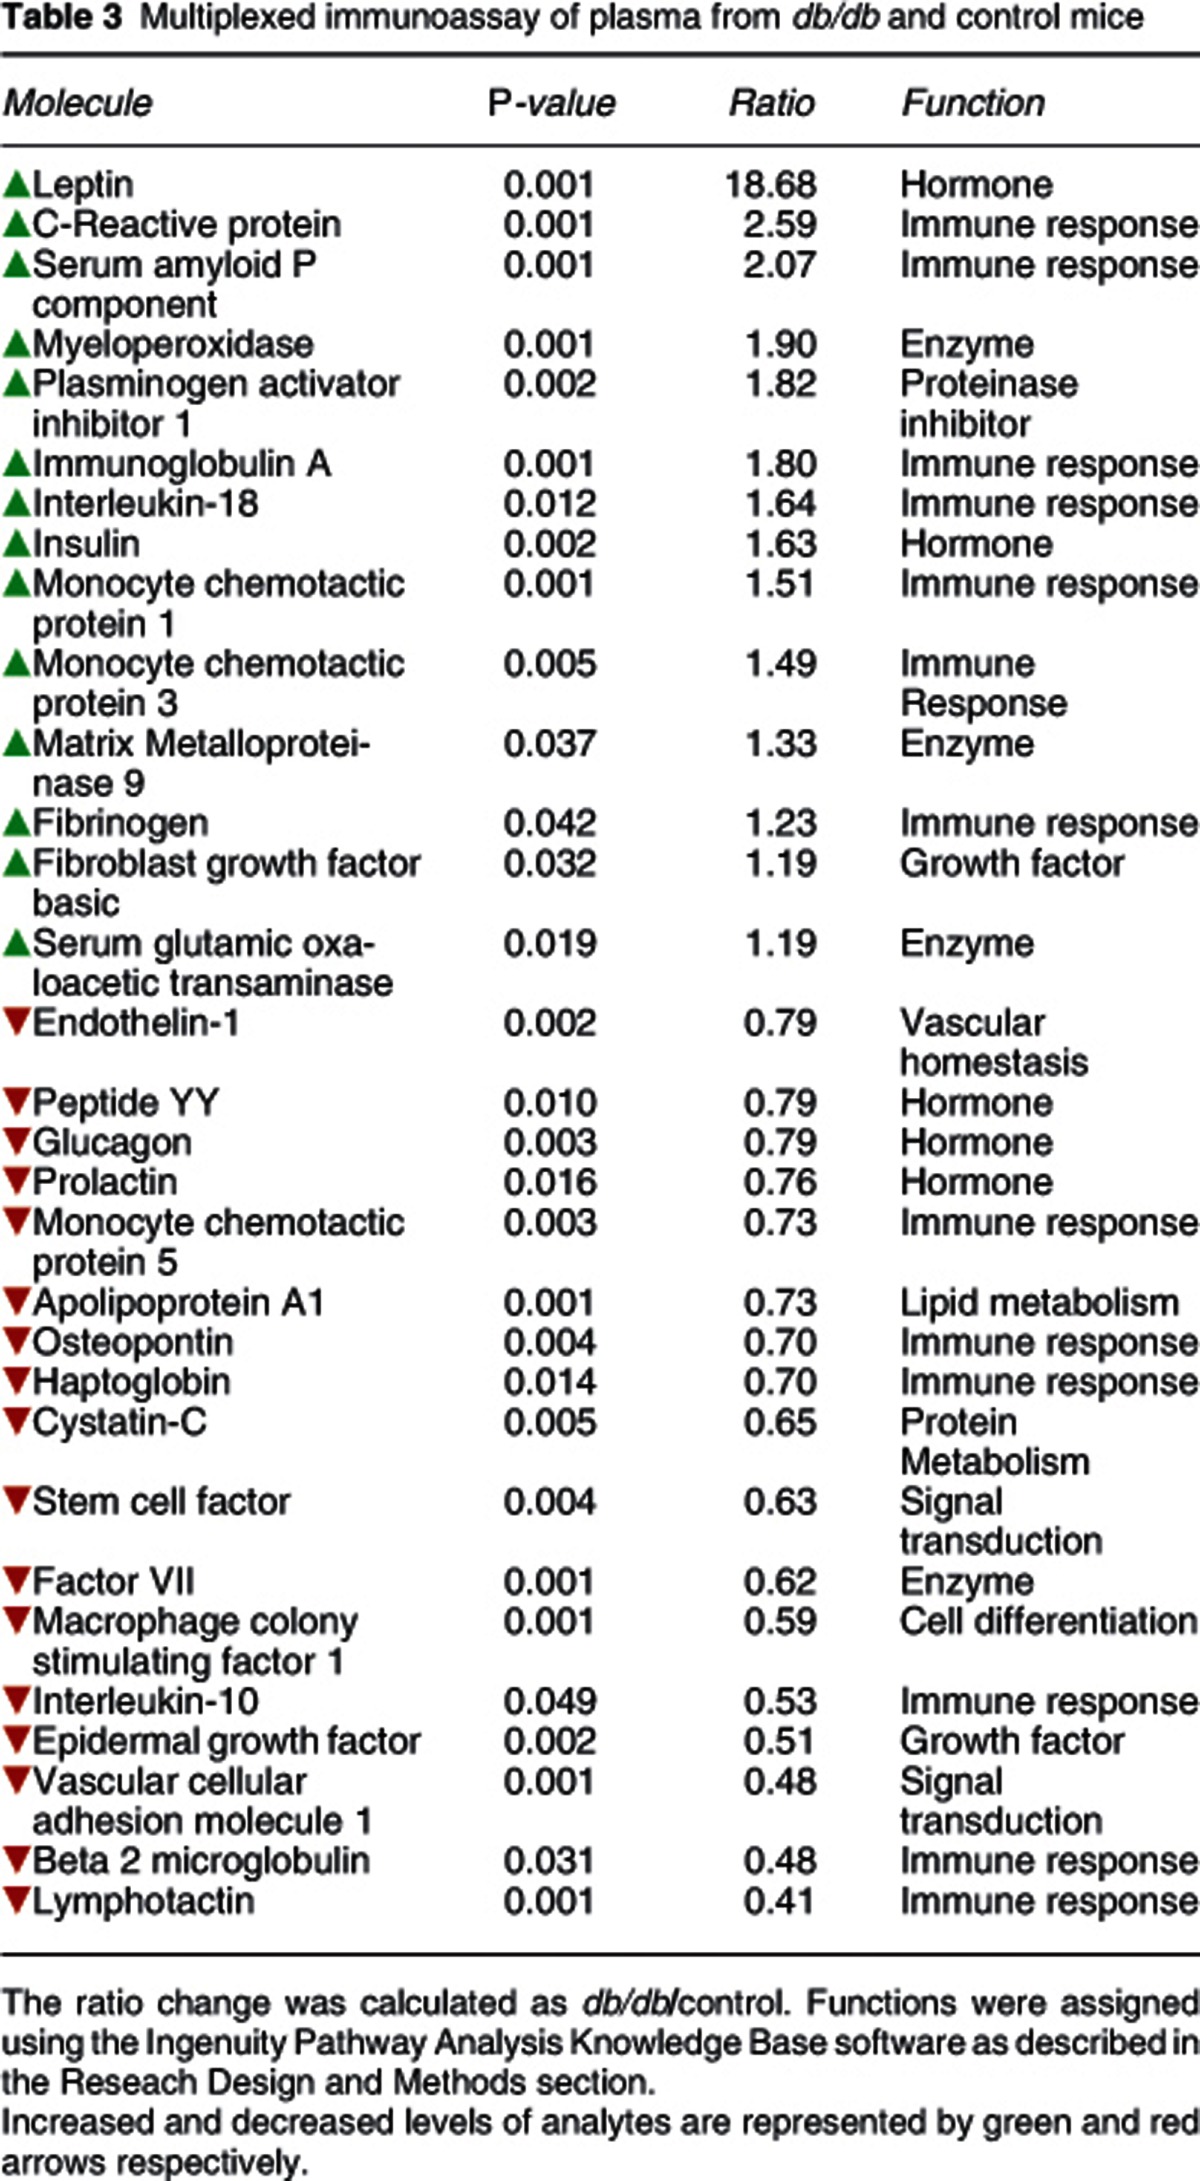
Multiplex immunoassay profiling of plasma samples showed that 31 molecules were present at different levels between db/db and control mice (Table 3). As expected, leptin levels were significantly higher (approximately 18-fold) in db/db compared with the control mice. Several other molecules were also present at higher levels in the db/db mice, including insulin, C-reactive protein, serum amyloid P component, immunoglobulin A, interleukin 18, monocyte chemotactic proteins 1 and 3 and fibrinogen. In addition, other proteins showed decreased levels in the db/db mice peptide YY, glucagon, prolactin, apolipoprotein A, monocyte chemotactic protein 5, osteopontin, haptoglobin, interleukin 10, beta 2 microglobulin and lymphotactin.
Table 3. Multiplexed immunoassay of plasma from db/db and control mice.
Frontal cortex analysis
Brain proteome analyses of the db/db and control mice were performed using LC-MSE to determine whether changes occurred as described in some post-mortem studies of neuropsychiatric and neurodegenerative diseases. LC-MSE analysis of whole frontal cortex extracts led to the identification of 478 proteins. Of these proteins, 13 were found to be significantly altered in db/db compared with control mice (Table 4). Four of these proteins were increased and nine decreased. The highest increase was observed for the insulin-like growth factor 2 mRNA binding protein 1 and the calcium calmodulin-dependent protein kinase type II alpha chain (CAMK2A). The most robust decreases were observed for stathmin 2 and neuromodulin. In silico functional analysis using the IPKB software analysis showed that 12 of the 13 altered proteins could be incorporated into a single interaction network (Figure 1). The top disease identified with the uploaded proteins was neurological disorder (P=7.1E-5–4.4E-2) and Parkinson's disease-related signalling was the top canonical pathway (P=7.4E-5; 2/16 proteins).
Table 4. LC-MSE analysis of frontal cortex from db/db and control mice.
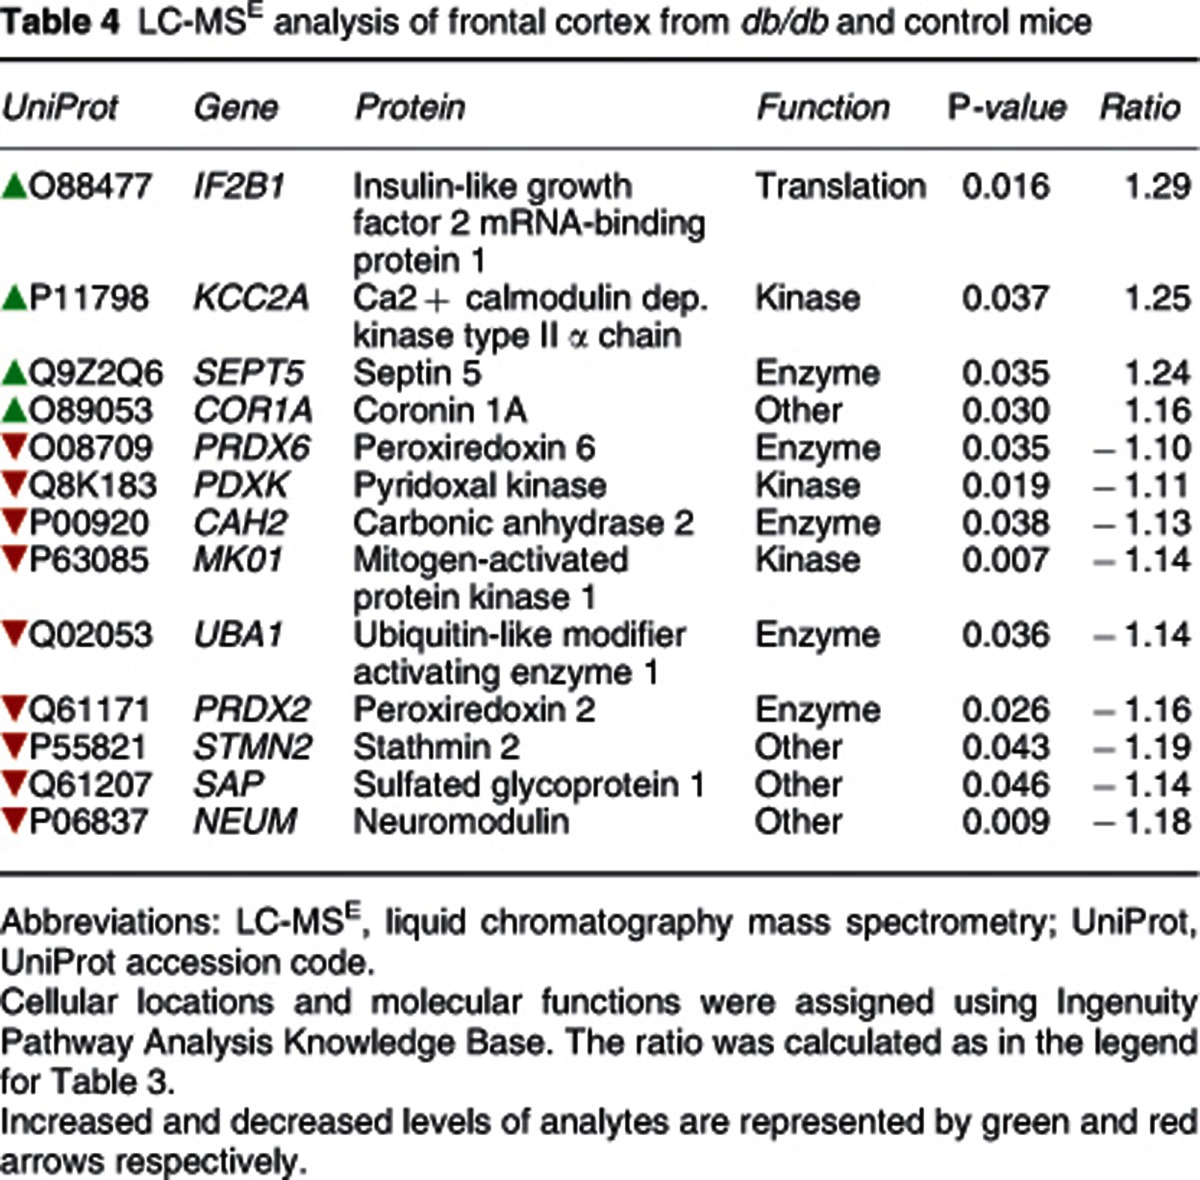
Figure 1.

In silico functional analysis of proteomic changes in the frontal cortex of db/db mice. UniProt accession codes were uploaded into the Ingenuity Pathway Analysis Knowledge Base to determine the most over-represented networks and canonoical pathways associated with the data. Straight lines=direct connections; dotted lines=indirect connections; green colour=increased; red colour=decreased.
Hippocampus analysis
Proteome analysis of the hippocampus from db/db and control mice led to identification of 441 proteins. Differential analysis showed that more proteins were altered in this tissue compared with the frontal cortex, with 56 proteins found to be present at significantly different levels between db/db and control mice (Table 5). The highest increases were observed for tubulin beta 5 chain and Thy 1 membrane glycoprotein. The largest decreases were found for groups of proteins involved in metabolic processes (malate dehydrogenase mitochondrial, cytochrome b c1 complex subunit 2, malate dehydrogenase cytoplasmic) or intracellular transport (alpha internexin, heat shock 70 kDa protein 1L, dihydropyrimidinase related protein 1, ras-related protein rab 39B). IPKB analysis of the altered proteins identified a network comprising 14 of the target proteins (Figure 2). Most of the altered proteins were involved in cellular signalling, cell structure and maintenance, neural functioning and energy metabolism. Three members of the 14-3-3 protein family, conserved regulatory molecules expressed in all eukaryotes, were among the group of altered proteins. Furthermore, several molecules linked to regulation of calcium signalling were also altered. The top disease associated with the altered hippocampal proteins was hematological disease (P=8.4E-5–1.7E-2) and the top canonical pathway was clathrin-mediated endocytosis signalling (P=3.0E-6; 7/181 proteins).
Table 5. LC-MSE analysis of hippocampus from db/db and control mice.
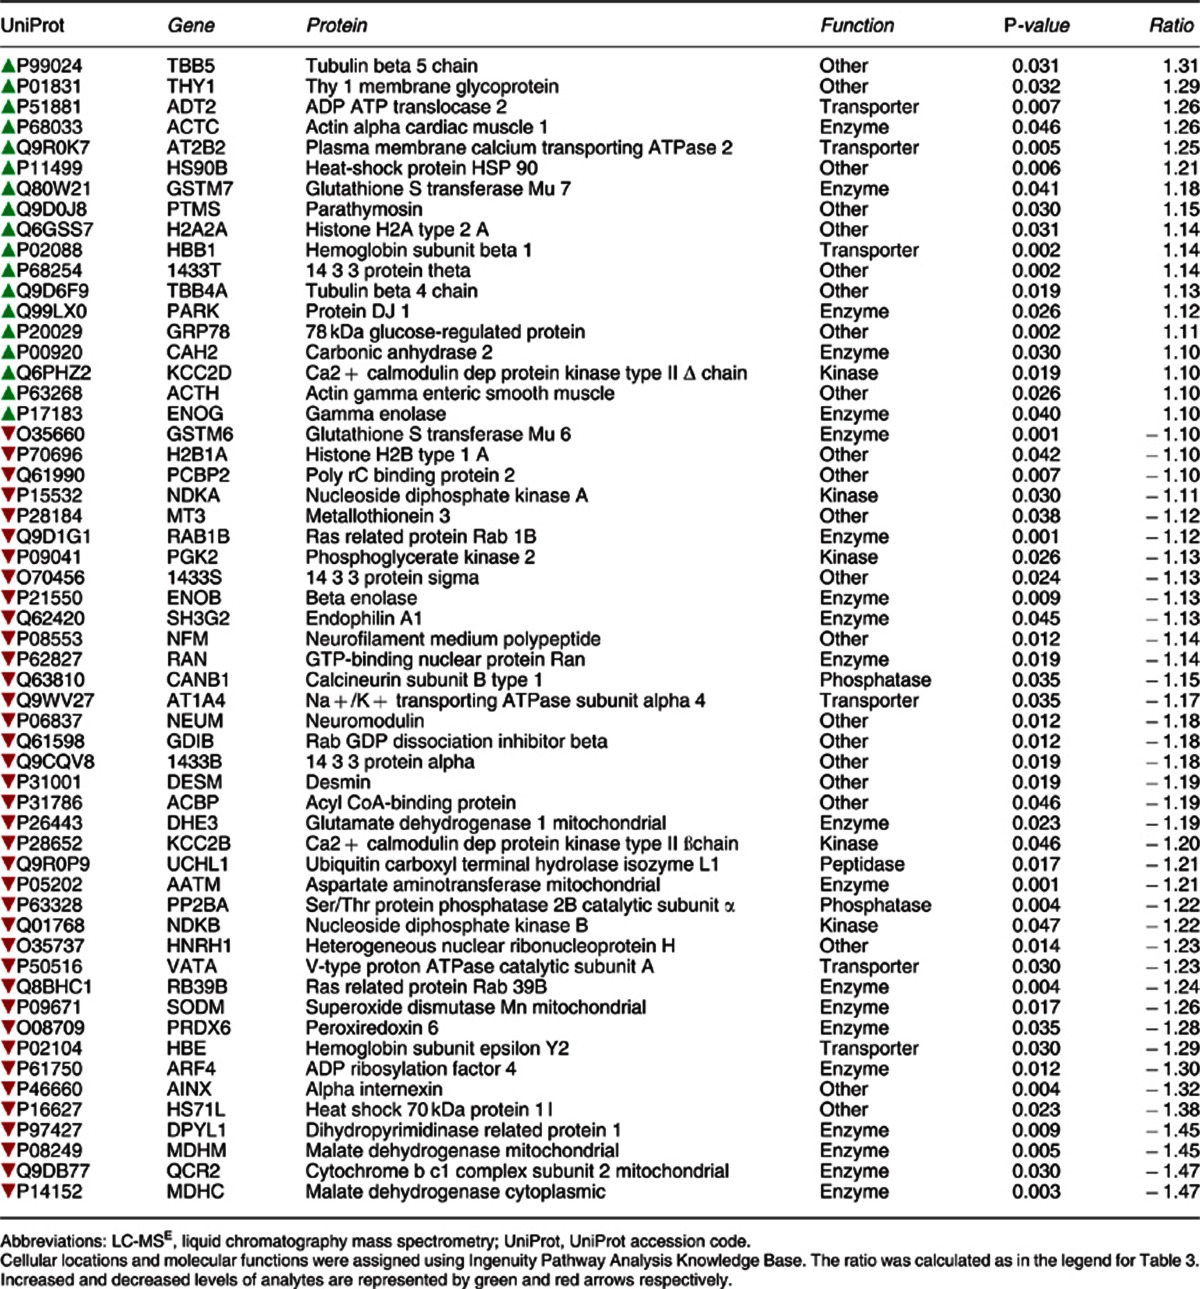
Figure 2.

In silico functional analysis of protein changes in the hippocampus of db/db mice. UniProt accession codes were uploaded into the Ingenuity Pathway Analysis Knowledge Base to determine the most over-represented networks and canonoical pathways associated with the data. Straight lines=direct connections; dotted lines=indirect connections; green colour=increased; red colour=decreased.
Discussion
This is the first proteomic profiling study investigating plasma and brain tissues from the db/db mouse model. The advantage of using the multiplex profiling approach is the potential to identify differences in hundreds of molecules simultaneously, which can lead to the identification of changes in functional pathways. Profiling of plasma from db/db mice showed the expected robust increase in leptin levels, along with significantly higher levels of insulin compared with the levels in control mice. In line with these findings, we also found decreased levels of other hormones such as peptide YY, glucagon and prolactin, which suggested that lack of leptin receptors in the db/db mice can lead to either altered biosynthesis or secretion of other major hormones.
The use of the multiplex immunoassay profiling analysis resulted in identification of several novel serum molecules, which have not been described previously in association with this model. The finding of lower peptide YY levels is consistent with the increased appetite and body weight of the db/db mice and with previous studies which have shown that obese humans secrete lower levels of this hormone.19 Lower levels of peptide YY have also been found in drug-free schizophrenia patients in a biomarker study of cerebrospinal fluid, suggesting another link between metabolic regulation and psychiatric disorders.20 The finding of decreased circulating prolactin levels in db/db mice has also not been reported previously. Prolactin is secreted by the anterior pituitary and this process can be inhibited by release of dopamine from the arcuate nuclease of the hypothalamus.21 This is interesting as one of the major theories of how schizophrenia develops involves increased dopaminergic activity in the brain.22 Therefore, further studies are warranted to determine whether hypothalamic–pituitary dopamine signalling is altered in this model.
In addition to the effects on hormonal pathways, we also identified alterations in immune and inflammation-related molecules in plasma from db/db mice. Several studies have shown that immune system perturbations occur in type 2 diabetes mellitus,23 as well as in psychiatric and neurodegenerative disorders, including schizophrenia,17 depression24 and Alzheimer's disease.25 However, the overlap of immune-related molecules across these conditions with the db/db mice model is not surprising given that these pathways are affected in a variety of diseases. In the case of the db/db mouse, the observed perturbations in immune system molecules could be due to the high circulating levels of leptin, as this hormone can also act as pro-inflammatory adipokine.26 Leptin has been tested as a possible treatment for autoimmune and/or inflammatory diseases in a recent study27 and preclinical studies have shown that the depression-like symptoms in the chronic stress and social defeat rat models was associated with lower serum leptin concentrations, and the behavioral effects could be reversed by systemic leptin administration.28
Comparison of circulating molecules changing in the db/db mouse model to those identified in our previous study of first onset schizophrenia patients shows that 12 proteins were altered in common and 6 of these showed the same directional changes (insulin, serum amyloid P, interleukin 18, serum glutamic-oxaloacetic transaminase, apolipoprotein A1 and epidermal growth factor).17 In addition, seven circulating proteins (insulin, serum glutamic-oxaloacetic transaminase, prolactin, cystatin C, stem cell factor, macrophage colony-stimulating factor and beta-2 microglobulin) were changed in common between the db/db mouse and the acute PCP rat model of schizophrenia, using the same molecular profiling platform.29 Taken together, these findings suggest that the db/db model shows an overlap of molecular profiles with schizophrenia and other psychiatric or neurodegenerative disorders.
The most novel findings of the current study involved the identification of changes in brain proteins as these have not been described previously in association with this model. Consistent with the effects on behavior seen in the db/db mice,13, 14 we identified multiple proteins that were altered in brain tissues extracted from db/db mice compared with control mice. The finding that more proteins were altered in the hippocampus of the db/db mouse is consistent with the reported effects on cognition and learning in this model. In line with this, we found changes in three members of the 14-3-3 protein family in db/db mouse hippocampi. These proteins are highly conserved and have an important role in neurodevelopment due to their involvement in cellular processes, such as cell signalling, growth and apoptosis.30 Also, perturbations in these proteins have been found in schizophrenia, autism, bipolar disorder and in subjects with impaired sensory motor gating and memory.30, 31 The latter finding is consistent with the impairments seen in paired-pulse inhibition in the db/db mice. Furthermore, our findings of altered expression of Ca2+-regulatory proteins, such as CAMK2B, CAMK2D and calcineurin subunit B type 1, are in line with studies that identified impaired cardiac function in db/db mice through suppression of Ca2+ permeability.32 This also supports the possibility that the defect found in the db/db mice is systemic, with effects seen in both the brain and periphery.
Fewer proteomic changes were found in the frontal cortex region of the db/db mice using the LC-MSE proteomic profiling approach. However, in silico analysis of the 13 significantly altered proteins resulted in identification of ‘neurological disorder' as the top associated disease and ‘Parkinson's signalling' as the top canonical pathway. Again, this indicated potential effects on dopaminergic pathways as seen most notably in Parkinson's disease and schizophrenia. In addition, one of the brain proteins found to be altered in both the db/db and the acute PCP rodent model described above,29 was protein DJ-1 (also known as PARK7). DJ-1 is an oxidative stress response protein that defends cells against reactive oxygen species. Furthermore, CAMK2A was found to be changing in the db/db mice as found in our previous study of the acute PCP model of schizophrenia.29 Previous studies have also found perturbed expression of these proteins in post-mortem frontal cortex tissues from schizophrenia patients33, 34 as well as in disorders associated with effects on learning and memory.35, 36, 37
One limitation of this study was the small numbers of animals used to generate the data. However, we have attempted to compensate for this through comparison of the findings with those in the literature on the same mouse model, the acute PCP model, drug-naive schizophrenia subjects and on protein pathways altered in schizophrenia post-mortem brain tissues. Nevertheless, these studies require repetition in independent cohorts of db/db mice, and future studies should attempt to further explore the specificity of the effects through comparison with other animal models and other human psychiatric and neurodegenerative diseases. Also, the db/db mouse has been mainly used in type 2 diabetes research, and it should be noted that the alterations in central nervous system could result from the change of leptin receptor signalling in the brain or though complications of diabetes itself.
In conclusion, this study resulted in the identification of novel central nervous system proteomic alterations that link the metabolic abnormalities found in the db/db mouse model to neurodegenerative and neuropsychiatric diseases. This has laid the ground work for further studies of the db/db mouse model in testing whether treatment with drugs such as antidepressants, antipsychotics or anti-diabetic compounds has a positive effect on the behaviors and brain proteome changes observed. Sharma et al.14 have already carried out a study which showed that treatment of db/db mice with rosiglitazone could affect depression measures, but this had no effect on readouts for psychosis-like behaviours. Taken together with previous investigations on the behavioural effects in this model, the current study supports the use of the db/db mouse as a potential preclinical model for schizophrenia and potentially other psychiatric or neurodegenerative disorders. Also, the combined use of this model with incorporation of high throughput assays for the plasma and brain molecular candidates identified here would potentially offer a useful novel tool for drug discovery, with a focus on the metabolic aspects of mental disorders and/or the psychopathology associated with diabetes.
Acknowledgments
The research leading to these results has received funding from the Stanley Medical Research Institute, the Dutch Fund for Economic Structure Reinforcement (FES), under grant agreement number 0908 (NeuroBasic PharmaPhenomics project), the American Heart Association Grant SDG 0735112N and the National Institutes of Health Grant R01 HL093567. The mass spectrometry work was MIAPE-compliant. SB is the guarantor of this work and, as such, had full access to all the data in the study and takes responsibility for the integrity of the data and the accuracy of the data analysis.
SB, HR and PCG are consultants for Myriad-RBM, although this does not alter adherence to Translational Psychiatry policies on sharing data and materials. The other authors declare no conflict of interest.
Footnotes
Supplementary Information accompanies the paper on the Translational Psychiatry website (http://www.nature.com/tp)
Supplementary Material
References
- Kaidanovich-Beilin O, Cha DS, McIntyre RS. Crosstalk between metabolic and neuropsychiatric disorders. F1000 Biol Rep. 2012;4:14. doi: 10.3410/B4-14. [DOI] [PMC free article] [PubMed] [Google Scholar]
- Meyer JM, Davis VG, Goff DC, McEvoy JP, Nasrallah HA, Davis SM, et al. Change in metabolic syndrome parameters with antipsychotic treatment in the CATIE Schizophrenia Trial: prospective data from phase 1. Schizophr Res. 2008;101:273–286. doi: 10.1016/j.schres.2007.12.487. [DOI] [PMC free article] [PubMed] [Google Scholar]
- Ryan MC, Collins P, Thakore JH. Impaired fasting glucose tolerance in first-episode, drug-naive patients with schizophrenia. Am J Psychiatry. 2008;160:284–289. doi: 10.1176/appi.ajp.160.2.284. [DOI] [PubMed] [Google Scholar]
- Guest PC, Wang L, Harris LW, Burling K, Levin Y, Ernst A, et al. Increased levels of circulating insulin-related peptides in first-onset, antipsychotic naive schizophrenia patients. Mol Psychiatry. 2010;15:118–119. doi: 10.1038/mp.2009.81. [DOI] [PubMed] [Google Scholar]
- Kobayashi K, Forte TM, Taniguchi S, Ishida BY, Oka K, Chan L. The db/db mouse, a model for diabetic dyslipidemia: molecular characterization and effects of Western diet feeding. Metabolism. 2000;49:22–31. doi: 10.1016/s0026-0495(00)90588-2. [DOI] [PubMed] [Google Scholar]
- Hummel KP, Dickie MM, Coleman DL. Diabetes, a new mutation in the mouse. Science. 1966;153:1127–1128. doi: 10.1126/science.153.3740.1127. [DOI] [PubMed] [Google Scholar]
- Coleman DL. A historical perspective on leptin. Nat Med. 2010;16:1097–1099. doi: 10.1038/nm1010-1097. [DOI] [PubMed] [Google Scholar]
- Dinel AL, Andre C, Aubert A, Ferreira G, Laye S, Castanon N. Cognitive and emotional alterations are related to hippocampal inflammation in a mouse model of metabolic syndrome. PLoS One. 2011;6:e24325. doi: 10.1371/journal.pone.0024325. [DOI] [PMC free article] [PubMed] [Google Scholar]
- Anderson RJ, Freedland KE, Clouse RE, Lustman PJ. The prevalence of comorbid depression in adults with diabetes: a meta-analysis. Diabetes Care. 2001;24:1069–1078. doi: 10.2337/diacare.24.6.1069. [DOI] [PubMed] [Google Scholar]
- Arvanitakis Z, Wilson RS, Bienias JL, Evans DA, Bennett DA. Diabetes mellitus and risk of Alzheimer disease and decline in cognitive function. Arch Neurol. 2004;61:661–666. doi: 10.1001/archneur.61.5.661. [DOI] [PubMed] [Google Scholar]
- Gotz J, Ittner LM, Lim YA. Common features between diabetes mellitus and Alzheimer's disease. Cell Mol Life Sci. 2009;66:1321–1325. doi: 10.1007/s00018-009-9070-1. [DOI] [PMC free article] [PubMed] [Google Scholar]
- Li XL, Aou S, Oomura Y, Hori N, Fukunaga K, Hori T. Impairment of long-term potentiation and spatial memory in leptin receptor-deficient rodents. Neuroscience. 2002;113:607–615. doi: 10.1016/s0306-4522(02)00162-8. [DOI] [PubMed] [Google Scholar]
- Sharma AN, Elased KM, Garrett TL, Lucot JB. Neurobehavioral deficits in db/db diabetic mice. Physiol Behav. 2010;101:381–388. doi: 10.1016/j.physbeh.2010.07.002. [DOI] [PMC free article] [PubMed] [Google Scholar]
- Sharma AN, Elased KM, Lucot JB. Rosiglitazone treatment reversed depression- but not psychosis-like behavior of db/db diabetic mice. J Psychopharmacol. 2012;26:724–732. doi: 10.1177/0269881111434620. [DOI] [PubMed] [Google Scholar]
- Trayhurn P. Thermoregulation in the diabetic-obese (db/db) mouse. The role of non-shivering thermogenesis in energy balance. Pflugers Arch. 1979;380:227–232. doi: 10.1007/BF00582901. [DOI] [PubMed] [Google Scholar]
- Taicher GZ, Tinsley FC, Reiderman A, Heiman ML. Quantitative magnetic resonance (QMR) method for bone and whole-body-composition analysis. Anal Bioanal Chem. 2003;377:990–1002. doi: 10.1007/s00216-003-2224-3. [DOI] [PubMed] [Google Scholar]
- Schwarz E, Guest PC, Rahmoune H, Harris LW, Wang L, Leweke FM, et al. Identification of a biological signature for schizophrenia in serum. Mol Psychiatry. 2012;17:494–502. doi: 10.1038/mp.2011.42. [DOI] [PubMed] [Google Scholar]
- Krishnamurthy D, Levin Y, Harris LW, Umrania Y, Bahn S, Guest PC. Analysis of the human pituitary proteome by data independent label-free liquid chromatography tandem mass spectrometry. Proteomics. 2011;11:495–500. doi: 10.1002/pmic.201000496. [DOI] [PubMed] [Google Scholar]
- le Roux CW, Bloom SR. Peptide YY, appetite and food intake. Proc Nutr Soc. 2005;64:213–216. doi: 10.1079/pns2005427. [DOI] [PubMed] [Google Scholar]
- Widerlov E, Lindstrom LH, Wahlestedt C, Ekman R. Neuropeptide Y and peptide YY as possible cerebrospinal fluid markers for major depression and schizophrenia, respectively. J Psychiatr Res. 1988;22:69–79. doi: 10.1016/0022-3956(88)90030-1. [DOI] [PubMed] [Google Scholar]
- Benker G, Jaspers C, Hausler G, Reinwein D. Control of prolactin secretion. Klin Wochenschr. 1990;68:1157–1167. doi: 10.1007/BF01815271. [DOI] [PubMed] [Google Scholar]
- Carlton PL, Manowitz P. Dopamine and schizophrenia: an analysis of the theory. Neurosci Biobehav Rev. 1984;8:137–151. doi: 10.1016/0149-7634(84)90029-0. [DOI] [PubMed] [Google Scholar]
- Pickup JC, Crook MA. Is type II diabetes mellitus a disease of the innate immune system. Diabetologia. 1998;41:1241–1248. doi: 10.1007/s001250051058. [DOI] [PubMed] [Google Scholar]
- Krishnadas R, Cavanagh J. Depression: an inflammatory illness. J Neurol Neurosurg Psychiatry. 2012;83:495–502. doi: 10.1136/jnnp-2011-301779. [DOI] [PubMed] [Google Scholar]
- Singh VK. Studies of neuroimmune markers in Alzheimer's disease. Mol Neurobiol. 1994;9:73–81. doi: 10.1007/BF02816106. [DOI] [PubMed] [Google Scholar]
- Stofkova A. Leptin and adiponectin: from energy and metabolic dysbalance to inflammation and autoimmunity. Endocr Regul. 2009;43:157–168. [PubMed] [Google Scholar]
- Fantuzzi G, Faggioni R. Leptin in the regulation of immunity, inflammation, and hematopoiesis. J Leukoc Biol. 2000;68:437–446. [PubMed] [Google Scholar]
- Lu XY, Kim CS, Frazer A, Zhang W. Leptin: a potential novel antidepressant. Proc Natl Acad Sci USA. 2006;103:1593–1598. doi: 10.1073/pnas.0508901103. [DOI] [PMC free article] [PubMed] [Google Scholar]
- Ernst A, Ma D, Garcia-Perez I, Tsang TM, Kluge W, Schwarz E, et al. Molecular validation of the acute phencyclidine rat model for schizophrenia: identification of translational changes in energy metabolism and neurotransmission. J Proteome Res. 2012;11:3704–3714. doi: 10.1021/pr300197d. [DOI] [PubMed] [Google Scholar]
- Jia Y, Yu X, Zhang B, Yuan Y, Xu Q, Shen Y. An association study between polymorphisms in three genes of 14-3-3 (tyrosine 3-monooxygenase/tryptophan 5-monooxygenase activation protein) family and paranoid schizophrenia in northern Chinese population. Eur Psychiatry. 2004;19:377–379. doi: 10.1016/j.eurpsy.2004.07.006. [DOI] [PubMed] [Google Scholar]
- Cheah PS, Ramshaw HS, Thomas PQ, Toyo-Oka K, Xu X, Martin S, et al. Neurodevelopmental and neuropsychiatric behaviour defects arise from 14-3-3zeta deficiency. Mol Psychiatry. 2012;17:451–466. doi: 10.1038/mp.2011.158. [DOI] [PubMed] [Google Scholar]
- Pereira L, Matthes J, Schuster I, Valdivia HH, Herzig S, Richard S, et al. Mechanisms of [Ca2+]i transient decrease in cardiomyopathy of db/db type 2 diabetic mice. Diabetes. 2006;55:608–615. doi: 10.2337/diabetes.55.03.06.db05-1284. [DOI] [PubMed] [Google Scholar]
- Kilarski LL, Pearson JP, Newsway V, Majounie E, Knipe MD, Misbahuddin A, et al. Systematic review and UK-based study of PARK2 (parkin), PINK1, PARK7 (DJ-1) and LRRK2 in early-onset Parkinson's disease. Mov Disord. 2012;27:1522–1529. doi: 10.1002/mds.25132. [DOI] [PubMed] [Google Scholar]
- Morishita T, Hidaka T, Sugahara K, Noguchi T. Leptin changes Ca2+/calmodulin-dependent response and up-regulates the gene expression of calcineurin in rat hypothalamus. Life Sci. 1998;63:PL311–PL315. doi: 10.1016/s0024-3205(98)00460-3. [DOI] [PubMed] [Google Scholar]
- Govoni S, Amadio M, Battaini F, Pascale A. Senescence of the brain: focus on cognitive kinases. Curr Pharm Des. 2010;16:660–671. doi: 10.2174/138161210790883732. [DOI] [PubMed] [Google Scholar]
- Mizuno K, Giese KP. Hippocampus-dependent memory formation: do memory type-specific mechanisms exist. J Pharmacol Sci. 2005;98:191–197. doi: 10.1254/jphs.crj05005x. [DOI] [PubMed] [Google Scholar]
- Novak G, Seeman P, Tallerico T. Increased expression of calcium/calmodulin-dependent protein kinase IIbeta in frontal cortex in schizophrenia and depression. Synapse. 2006;59:61–68. doi: 10.1002/syn.20211. [DOI] [PubMed] [Google Scholar]
Associated Data
This section collects any data citations, data availability statements, or supplementary materials included in this article.