

Abstract
The Phosphatidylinositide 3-kinase (PI3-K) pathway is deregulated in a range of cancers, and several targeted inhibitors are entering the clinic. This study aimed to investigate whether the PET tracer 3′-Deoxy-3′-[18F]fluorothymidine ([18F]-FLT) is suitable to mark the effect of the novel PI-3K inhibitor GDC-0941 which has entered phase II clinical trial. CBA nude mice bearing U87 glioma and HCT116 colorectal xenografts were imaged at baseline with [18F]-FLT and at acute (18h) and chronic (186h) timepoints after twice-daily administration of GDC-0941 (50mg/kg) or vehicle. Tumor uptake normalized to blood pool was calculated, and tissue was analyzed at sacrifice for PI3-K pathway inhibition and thymidine kinase (TK1) expression. Uptake of [18F]-FLT was also assessed in tumors inducibly overexpressing a dominant-negative form of the PI3-K p85 subunit Δp85α, as well as HCT116 liver metastases after GDC-0941 therapy. GDC-0941 treatment induced tumor stasis in U87 xenografts, whereas inhibition of HCT116 tumors was more variable. Tumor uptake of [18F]-FLT was significantly reduced following GDC-0941 dosing in responsive tumors at the acute timepoint, and correlated with pharmacodynamic markers of PI3-K signaling inhibition and significant reduction in TK1 expression in U87, but not HCT116, tumors. Reduction of PI3-K signaling via expression of Δp85α significantly reduced tumor growth and [18F]-FLT uptake, as did treatment of HCT116 liver metastases with GDC-0941. These results indicate that [18F]-FLT is a strong candidate for the non-invasive measurement of GDC-0941 action.
Keywords: Positron Emission Tomography, Fluorodeoxythymidine, Imaging Therapy Response
Introduction
The phosphatidyl inositide (PtdIns) signaling network of enzymes and lipid messengers is a key nexus for the control of almost all cellular processes, and is often deregulated in disease (1). The formation of PtdIns (3,4,5) P3 from PtdIns (4,5)P2 by Class IA Phosphatidylinositide 3-kinase (PI3-K) enzymes gives rise to signaling resulting in cell proliferation, motility, invasion and metastases; activation of this enzyme by mutation (or deregulation of upstream effectors such as HER2 or the negative regulator PTEN) is found in a wide range of cancers (2). Drug discovery efforts have aimed at inhibiting this enzyme, and GDC-0941 is a potent and selective inhibitor of class I PI3-kinases (3-4) that is currently undergoing clinical trials in a range of malignancies. A current problem for drug discovery pipelines is the lack of biomarkers for use in such trials, to allow effective biological doses to be determined and to allow better patient management by the early assessment of therapeutic response. Non-invasive imaging with positron emission tomography (PET) offers the possibility of assessing whole tumor response; assessment of thymidine incorporation via the salvage pathway with 3′deoxy-3′-[18F]fluorothymidine ([18F]-FLT) has been shown to predictive of response in a range of preclinical models and a variety of drugs (5).
In this study, we assess whether changes in uptake of [18F]-FLT are predictive of response to PI3-kinase inhibition by GDC-0941 or genetic methods in subcutaneous and orthotopic models of cancer with activation of PI3-K signaling (via deletion of PTEN or mutation of PIK3CA), as a guide to the use of such imaging agents in clinical trials. A subsidiary aim was to see whether imaging could be used to assess longitudinal drug response in an orthotopic model.
Materials and Methods
In vivo studies
Subcutaneous and orthotopic tumors: HCT116 (PIK3CA H1047R/K-ras G13D/PTEN wild-type) and U87 (PIK3CA wild-type/K-ras wild-type/PTEN negative) cells were implanted subcutaneously (sc) (0.1 ml of a 5×10⁷/ml stock in PBS) in female nude mice (CBA nu/nu, aged 8–12 wk). Cell lines were obtained from the American Type Culture Collection and were not authenticated. Tumor volumes were measured at least three times weekly with calipers, and the volume calculated as (tumor length × tumor width2)/2. For the orthotopic model, HCT116 cells (5×10⁶/50μl in serum free RPMI) were injected aseptically into the spleen of anaesthetized CBA nude mice through an incision made in the skin underneath the left ribcage into the inferior tip of the spleen using a 27G needle. The skin was closed using a surgical staple and mice were administered Buprenorphine (0.1mg/kg/sc). Dosing for therapies commenced in the evening after the baseline PET scan, when subcutaneous tumors were sized at approximately 200 mm3. GDC-0941 was prepared in 0.5% hydroxypropyl methyl cellulose and administered by oral gavage (0.1 ml/10 g). Dosing was adapted from published data (3). Mouse welfare was monitored at least daily. In all treatment groups, pimonidazole (60 mg kg−1 IP; Chemicon International Inc. CA. USA) was given 2h prior to sacrifice.
Inducible dominant-negative PI3-K p85 subunit (Δp85α) tumors: HT29 (PIK3CA P449T/K-ras wild-type/PTEN wild-type) cells (obtained from the American Type Culture Collection and not authenticated) expressing inducible Δp85α or parental controls were grown as xenografts by sc injection of 0.1ml of 5 × 10⁷/ml stock in serum-free medium into either side of the mid-dorsal region of the back of 6- to 8-wk-old female SCID/Bg mice as previously described (6). Mice were housed in individually vented caging systems on a 12-h light:12-h dark environment and maintained at uniform temperature and humidity. Tumor size was measured three times a week with calipers, and the volume calculated as above. When tumors reached ~300 mm3, mice were imaged (see below) and then gavaged with doxycycline (0.2ml p.o., 10mg/ml; daily). Imaging was repeated 72h later. On sacrifice, tumors were excised and bisected. One half was snap frozen in liquid nitrogen and used to prepare lysates and the other half was fixed in 10% formalin for immunohistochemistry. All procedures were carried out in accordance with the Scientific Procedures Act 1986 and UKCCCR Guidelines 2010 (7) by approved protocols following institutional guidelines (Home Office Project Licenses 40-3212 and 40-3306 held by Professors K.J.Williams and C.Dive).
PET imaging
Animals underwent dynamic baseline scanning when xenograft size had reached ~200-300 mm3 for subcutaneous tumors or at 20 days post-implant for intrasplenic HCT116 tumors Animals were anaesthetized with 1-2% Isoflurane, the tail vein was catheterized and they were placed in the animal bed (Minerve Small Animal Environment System Bioscan, France) and transferred to a preclinical PET scanner (Inveon, Siemens, Germany). Animals bearing the dual flank PI3-kinase knockout/control tumors were similarly prepared and scanned using a Quad-HIDAC system (Oxford Positron Systems, Weston-on-the-green, UK). At the start of the acquisition, mice were injected with either ~10MBq of [18F]-FLT (synthesized “in-house” using published protocols (8)) or [18F]-FDG (Erigal, Keele, UK) intravenously (IV) via the tail vein. List mode data were collected for 60 ([18F]-FDG ) or 105-120 minutes, in accordance with maximal acquisition times advised (7). Anesthesia was maintained during image acquisition via a nose cone with respiration and temperature monitored throughout using appropriate systems. After imaging, HCT116 or U87 bearing animals were recovered in a warmed chamber, randomized into treatment groups and re-scanned at 18h and 186h after vehicle or therapy. Animals bearing the dual flank PI3-kinase knockout/control tumors were recovered, administered doxycycline (see above) and imaged 3 days later. Immediately after the last scan tumors were excised, weighed and half fixed in 10% formalin, half snap-frozen in liquid nitrogen for western blot analysis.
Image reconstruction and data analysis
Inveon acquired data: before reconstruction, the list-mode data were histogrammed with a span of 3 and maximum ring differences of 79 into 3D sinograms with 21-33 time frames (5 × 60 seconds (s), 5 × 120s, 5×300s and 6 to 18 × 300s) for image reconstruction. Images were reconstructed using the 3D-OSEM/MAP algorithm (4 OSEM3D iterations and no MAP iterations, with a requested resolution of 1.5mm). Regions of interest (ROIs) were drawn manually over tumor and either heart contents ([18F]-FLT) or a section of liver ([18F]-FDG) using Inveon Research Workplace software (Siemens, Germany) and further normalization was performed using the injected dose (from the dose calibrator) and animal weight to give a standardized uptake value (SUV). SUVmax was calculated from the maximum voxel value within the ROI and SUVmean as the average over all voxels, normalized uptake values were calculated by dividing SUVmax or SUVmean from the tumor by that from the heart contents.
For Quad-HIDAC data: images were reconstructed for five-minute timeframes using OPL-EM (9). Absolute calibration of the images was achieved by reference to an 18F source imaged in the field of view in each scan. ROI analysis was undertaken manually using in-house developed software running under IDL6.0 (Research Systems Inc., Boulder, CO, USA). Further normalization was performed using the injected dose (from the dose calibrator) and animal weight to give a standardized uptake value (SUV); SUVmean was calculated as the overall average of all voxels which was applied to all reconstructed timeframes to give a time-activity curve.
Magnetic resonance imaging
Mice were anaesthetized (2% isoflurane) and connected to a heartbeat monitor for the duration of the experiment. Skin temperature measurements obtained directly before and after the 20 minute procedure indicated that the body temperature remained constant (36-38 °C). T1-weighted (TR/TE=700/8.6 ms) and T2-weighted (TR/TE=1130/15 ms) sequences based on RARE (4 echoes, 4 averages, acquisition matrix = 256 × 192, reconstructed at 256 × 256, with 15 × 1mm slices, (10)) were used to obtain abdominal images for each mouse using a Magnex 7-Tesla, horizontal-bore magnet (Agilent Technologies, Oxford, UK) interfaced to a Bruker Biospec Avance III console (Bruker Biospin Ltd, Coventry, UK ) with a transmit/receive 2.5cm surface coil.
Western blot analysis
Protocols were used as previously described (11). Primary antibodies used were: total-AKT phospho-AKT, GSK-3β, phospho-GSK-3β, phospho-ERK (Cell signaling Technology, Hitchin, UK), HIF-1α(BD-Transduction Laboratories, Oxford, UK), CA-IX(kindly provided by Dr. Jaromir Pastorek, Bratislava, Slovakia), β-actin (Sigma, Gillingham, UK), TK1 (ab15580, Abcam). Protein expression was quantified by densitometry relative to the loading-control protein β-actin, using ImageJ.
Matrix assisted laser desorption ionization (MALDI) Mass Spectrometry
Frozen tumors were sectioned in 12μm slices and thaw mounted on Indium Tin Oxide (ITO) slides, before a α-Cyano-4-hydroxycinnamic acid (CHCA) matrix 20mg/ml (50:50 Acetonitrile:water, 0.2% Trifluoroacetic acid (TFA)) was applied with a thin layer chromatography (TLC) sprayer at 1000nl/s, total application per section 120μl. Slides were analyzed on a Kratos AXIMA MALDI Time of Flight (TOF)-TOF CFR+ imaging mass spectrometer (Shimadzu, Manchester, UK) in reflectron mode with laser power set at 63 and a 400-800 mass range. Spot size was 100 μm, 100 laser shots were collected per spot with the laser rastering every 25 shots.
Results
GDC-0941 differentially inhibits tumor growth in U87-MG and HCT116 tumors in vivo
Tumor volume was monitored over the 8 days of therapy in treated and untreated animals. There was a significant reduction in tumor growth between treated and untreated U87 tumors (69.2±9.0mm3day−1 vs. -1.0±3.8mm3 day−1) (P<0.01) (Fig. 1A). HCT116 showed a variable response, though overall there was no difference in growth between treated and untreated HCT116 tumors (46.2±11.9mm3 day−1 vs. 37.3±8.4mm3 day−1)(Fig. 1B). No significant change in mouse bodyweight was observed with drug treatment.
Figure 1.

GDC-0941 inhibits the growth of U87, but not HCT116, tumors. A, Structure of GDC-0941. B, Average tumor volume of U87 xenografts treated with 50mg/kg GDC-0941(n=6) or vehicle control (n=5) for 8 days. C, Average tumor volume of HCT116 xenografts treated with 50mg/kg GDC-0941 (n=5) or vehicle control (n=4) for 8 days. Data represent average tumor volume ± SEM, *p<0.05.
GDC-0941 inhibits PI3-K signaling in sensitive tumors
Downregulation of phospho-AKT (pAKT) and phospho-GSK3β (pGSK3β) levels have been reported as pharmacodynamic (PD) biomarkers of GDC-0941 action (3), therefore these were assessed in U87 and HCT116 tumors treated with vehicle/GDC-0941. pAKT and pGSK-3β levels were downregulated in all treated U87 tumors (Fig. 2B) as evidenced by reduced pAKT/total AKT and pGSK3β /total pGSK3β ratios (0.28±0.03 vs. 0.12±0.03 and 0.66±0.11 vs. 0.14±0.08 respectively, p<0.01, Fig. 2C). This correlated with a reduction in tumor growth as expected in this model. However PD biomarker response was much more variable in HCT116 tumors and did not correlate with tumor growth inhibition. As we have previously observed in PTEN deleted tumors (15) GDC-0941 also downregulated the hypoxic mediators hypoxia inducible factor 1 (HIF-1) and carbonic anhydrase 9 (CA-IX) in sensitive U87 tumors (supplementary fig. 1), as well as upregulating the apoptotic signaling as evidenced by an increase of cleaved PARP (supplementary figure 2).
Figure 2.

GDC-0941 inhibits PI3-K signaling in drug sensitive U87 tumors. Western blot data for expression of pAKT, tAKT, pGSK-3β &tGSK-3β in U87 (A) and HCT116 (B) tumors, with densitometric analysis in C and D respectively (Average ± SEM, *p<0.01). Data are representative of 4 independent mice dosed with vehicle or 50 mg/kg GDC-0941 twice daily for 8 days and were normalized to β-actin.
Decrease in [18F]-FLT uptake correlates with response to GDC-0941 in U87 and HCT116 tumors in vivo
To assess whether the reduction in tumor growth in sensitive tumors could be monitored by imaging, uptake of [18F]-FLT was measured at baseline and after 1 and 8 days of therapy in both models. For U87 tumors, there was a significant reduction in [18F]-FLT uptake (NUVmax) at 18h post therapy (2.17±0.38 vs. 1.59±0.29, p<0.01), which was not seen in the control group (2.17±0.39 vs. 2.02±0.09) (Fig. 3A and B); TK1 expression levels relative to actin were also decreased (1.00±0.28 vs. 0.27±0.16, p<0.01)(Fig. 3E). For HCT116 tumors, there was no significant difference in NUVmax at baseline and 18h in the treated (2.36±0.78 vs. 2.38±0.49) or untreated (2.30±0.81 vs. 2.78±0.34) tumors (Fig. 3C and D); similarly TK1 expression levels relative to actin were unchanged (0.80±0.11 vs. 0.95±0.18) (Fig. 3F). Correlation of the change in NUVmax between baseline and 18h with tumor growth inhibition over the treatment period in all U87 and HCT116 tumors studied was significant (p<0.05)(Fig. 3G). There was no significant difference in NUVmax between treatment groups at baseline. In a separate experiment, we assessed [18F]-FDG uptake in response to therapy and found significant decreases in uptake for treated U87, but not HCT116, tumors (supplementary Fig. 3A-D); this HCT116 cohort was dominated by drug-responsive tumors however, with a significant reduction in growth (53.8±4.3 mm3day−1 vs. 19.2±3.9 mm3day−1) (supplementary Fig. 3F) that did not result in a significant decrease in [18F]-FDG uptake.
Figure 3.

Uptake of [18F]-FLT decreases significantly after ~18h of GDC-0941 treatment in U87, but not HCT116, tumors. A, Average maximum normalized uptake time activity curves for treated (closed symbol) and untreated (open symbol) U87 tumors, group sizes as indicated in Fig.1, *p<0.01. B, representative maximum intensity projections of data from 100-105 minutes after injection of [18F]-FLT for treated and untreated U87 xenografts, with tumor indicated by dotted circle, group sizes as indicated in Fig.1. C, Average maximum normalized uptake time activity curves for treated (closed symbol) and untreated (open symbol) HCT116 tumors. D, representative maximum intensity projections of data from 100-105 minutes after injection of [18F]-FLT showing treated and untreated HCT116 xenografts, with tumor indicated by dotted circle. E and F, Western blot showing a decrease of TK1 levels in treated (18h) vs. untreated (186h) U87, but not HCT116, tumors (Average ± SEM, *p<0.01). G, change in NUV at 18h correlates with tumor growth over 8 days (p<0.05).
Genetic abrogation of PI3-K signaling causes growth arrest and reduces uptake of [18F]-FLT
To further substantiate the link between PI3-K inhibition and the reduction of [18F]-FLT uptake, PI3K signaling was inhibited using a HT29 colorectal cancer cell model that inducibly expresses a dominant negative isoform of the p85α regulatory subunit of PI3-kinase (Δp85α); inducible inhibition of PI3-K by this method has been shown to reduce xenograft growth via cell cycle arrest (6) (Fig 4A). Here we show uptake of [18F]-FLT into tumor was significantly reduced after 72 hours induction of Δp85α tumors with doxycycline (SUVmax 4.15±0.42 vs. 2.24±0.30) compared to parental controls (4.56±0.36 vs. 4.01±0.44, p<0.05) (Fig 4B and C), correlating with a reduction in tumor growth.
Figure 4.

Uptake of [18F]-FLT decreases significantly after ~72h expression of Δp85α in HT29 xenografts. A, Mean tumor growth rate of parental and Δp85α-expressing tumors before (open) and after (closed) treatment with doxycycline. B, representative maximum intensity projections of data from 115-120 minutes after injection of [18F]-FLT for animals bearing dual flank parental and Δp85α-expressing tumors as indicated, with bladder uptake (B) indicated by arrow. C, Average maximum normalized uptake time activity curves for Δp85α (closed symbol) and parental (open symbol) HT29 tumors (Average ± SEM *p<0.05).
GDC-0941 inhibits the growth of HCT116 tumor metastases in an orthotopic model, resulting in an acute reduction in [18F]-FLT uptake
The responsiveness of the HCT116 cell line to GDC-0941 was also assessed in an orthotopic liver metastases model. The presence of liver metastases after intrasplenic inoculation of HCT116 cells was assessed by T2-weighted magnetic resonance imaging (MRI) 14 days after primary inoculation, and baseline uptake of [18F]-FLT was established at day 21. GDC-0941 was then given twice daily at 50mg/kg for 8 days with further [18F]-FLT scans at 18h and MRI at the end of therapy. Uptake of [18F]-FLT was significantly reduced at 18h (NUVmax of 2.76±0.16 vs. 1.99±0.13 p<0.05; Fig. 5A and B). Consistent with the predictive nature of [18F]-FLT in subcutaneous models, a reduction in the burden of HCT116 liver metastases in mice treated with GDC-0941 for 8 days was revealed by MRI (Fig. 5C) and upon assessment of liver to bodyweight ratios between treated and untreated animals (10.9 ± 1.1% control vs. 5.9 ± 0.5% for treated animals, p<0.01) (Fig. 5D).
Figure 5.

Reduction in tumor [18F]-FLT uptake in an orthotopic model of HCT116 colorectal liver metastases correlates with response to GDC-0941. A, Average maximum normalized uptake time activity curves for HCT116 liver metastases at baseline (closed diamonds) versus 18h of GDC-0941 treatment (closed squares)(n=3), *p<0.05. B, representative maximum intensity projections of data from 100-105 minutes after injection of [18F]-FLT showing GDC-0941 treated HCT116 liver metastases, with metastatic mass indicated by arrows. C, T2-weighted image showing liver metastases (arrowed) following vehicle or GDC-0941 treatment for 8 days. D, Liver-to-bodyweight ratio for mice bearing HCT116 liver metastasis after 8 days treatment with GDC-0941 (white) or vehicle (black), (Average ± SEM *p<0.01).
Difference in response to GDC-0941 between primary and metastatic HCT116 tumors is not due to drug delivery
Levels of GDC-0941 were measured in HCT116 tumors with MALDI mass spectrometry. Drug, detected as the (M+H)+ ion (514.64), was distributed homogenously through the liver, with less penetrating metastatic tumors (Fig.6A and B, tumors arrowed). The amount and distribution of GDC-0941 in liver metastases was comparable to that of xenograft tumors (Fig. 6C).
Figure 6.
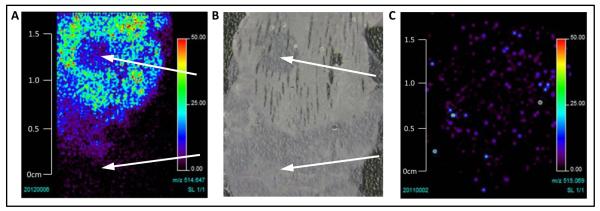
Delivery of GDC-0941 does not differ in HCT116 subcutaneous xenografts vs. liver metastases. A, Distribution of GDC-0941 in HCT116 metastases (indicated by arrows) and surrounding liver tissue, showing that delivery to tumor is not increased at this site. B, photograph of section analyzed in A showing extent of tumor mass (indicated by arrows), with most occurring at the edge of the liver. C, Distribution of GDC-0941 in HCT116 xenograft tumor showing homogenous distribution.
Discussion
Targeting the PI3-kinase pathway has become a major focus in current drug development programs in oncology due to the prevalence of mutations that activate signaling via this network in cancer. GDC-0941, a dual-class PI3-K inhibitor whose structure is designed to bind to the ATP pocket of the catalytic p110 subunit (4;12), is currently in phase I and II clinical trial, exerts anti-proliferative effects on a range of cell lines (3-4;13-14) and this has been shown to correlate with a reduction in the number of cells in S-phase as well as the induction of apoptosis (13). Initial phase I results indicate that inhibition of this target by GDC-0941 and a variety of other targeted agents may not have broad efficacy across a range of malignancies; as targeted therapeutics have demonstrated high efficacy rates in specific patient sub-populations (15) this suggests patient stratification before treatment is an important unmet clinical need. GDC-0941 has shown activity in cell lines harboring mutations in the PI3-kinase pathway components PTEN, PIK3CA and HER2 (3;16), and genetic response signatures consisting of mutations to PIK3CA, HER2, dual PIK3CA/HER2, PIK3CA/PTEN or HER2/PTEN have been shown to confer sensitivity to GDC-0941 in breast cancer cell lines (13). These have yet to be clinically validated however, and this process is likely to be confounded by the significant heterogeneity found in tumors (17). This is also likely to confound existing biomarkers of drug target inhibition for agents targeting this pathway which in any case may be less than robust (18), perhaps due to the complexity and redundancy of cancer signal transduction networks (19).
Molecular imaging offers a way of assessing the biologic status of whole tumors. [18F]-FLT has been developed as a generic marker of proliferation, and uptake has shown prognostic significance in some cancers (20-21). As uptake depends on both ENT1 transporter levels and the activity of the thymidine salvage pathway enzyme TK1, it may not reflect proliferation in cells that rely on de novo synthesis and so may not be pathognomic for DNA synthesis (22-23). Identifying response in tumors that have high [18F]-FLT uptake in clinical trials however may allow the determination of biologically effective doses, as well as helping patients to avoid lengthy cycles of ineffective treatment; as phase I results for GDC-0941 have shown at best stable disease (and there is evidence from trials of targeted agents in lung cancer (15) and GIST (24) that overall survival benefit of treatment may result from stable disease as opposed to tumor regression), global measures of changes in proliferative indices are likely to result in better patient management. Links between response and [18F]-FLT uptake have been demonstrated in a number of preclinical studies of classical and targeted chemotherapy (18;23;25-36). Clinically, early response to therapy determined with [18F]-FLT PET imaging has been shown to predict survival in some malignancies (37), however in others significant decreases in uptake have not correlated with overall survival (reviewed in (5)); thus [18F]-FLT may still have utility as a negative indicator i.e. survival is not likely in tumors that do not show such a response.
The current study demonstrates that GDC-0941 inhibits tumor growth in PTEN-negative U87 glioma subcutaneous xenografts as previously reported (3-4); and that this effect can be measured using [18F]-FLT PET acutely after therapy and before tumor growth inhibition becomes apparent. The dose used (50mg/kg/q2d) translates to two doses of ~ 245mg in humans (38), which is comparable with the maximum tolerated dose (MTD) of 450mg qd established in Phase I trials (39), with dose limiting toxicity (DLT) of grade 3 maculopapular rash. The timing of acute scans was chosen as inhibition of growth is likely to be rapid in xenograft models compared to human tumors; other studies have seen response as early as 6h after therapy (40). Thus dose and timepoint are likely to be reflective of the clinical situation. [18F]-FLT uptake at 186h was reduced to a similar degree for U87 tumors in both treated and control groups compared to baseline, but this was not significant (data not shown). Lessening of reduction in uptake due to GDC-0941 at day 8 may be the precursor to eventual drug resistance, and although previous studies show inhibition of growth for up to 19 days at the dose used here (3), there is clear upregulation of MAPK/ERK signaling at day 8 in sensitive cells which may provide a mechanism for this (supplementary figure 4), and is consistent with previous studies on the increased efficacy of dual PI3-K/MAPK inhibition (41). The reduction in the control group may be due to a Gompertzian decrease in proliferation due to increased size.
Acute reduction also correlated well with cell cycle arrest as measured by TK1 expression, and downregulation of pAKT by greater than the 30% suggested for tumor stasis in a PK/PD model (42). Target inhibition and efficacy is not seen in the PIK3CA mutant/moderate HER2 expressing HCT116 model, but neither is there reduction in the number of cycling cells as measured by TK1 expression or tracer uptake (both tumors chosen for the study have high uptake of [18F]-FLT and most likely rely on the salvage pathway to obtain thymidine for DNA synthesis). Although HCT116 cells are sensitive to drug in vitro, tumors grown in vivo have been reported to be more resistant to this drug (42) and although growth arrest after GDC-0941 tumors has been demonstrated at higher doses that may be difficult to achieve clinically (43), the lack of correlation between pathway and growth inhibition in the HCT116 subcutaneous model suggests that factors other than drug delivery, such as heterogeneity in the tumor microenvironment, may be at work. Interestingly, when [18F]-FDG uptake in response to therapy was studied in a further cohort, HCT116 tumors were more responsive to therapy (supplemental figure 3). This was not reflected in tracer uptake changes however, which may indicate that [18F]-FDG could be a less sensitive biomarker for PI3-K inhibition.
To validate the correlation between change in tracer uptake and drug response, we used a genetic model of PI3-K inhibition where inducible expression of a dominant negative regulatory subunit has been shown to result in growth inhibition rather than cell death in the PIK3CA mutant colorectal cancer HT29 model in vivo. This showed that at 72 hours, when tumors are growth arrested, there is a sharp decrease in the uptake of [18F]-FLT. Although this is as expected, the correlation of imaging endpoints to the activity of a single pathway component may not provide proof of pathognomicity, as for example isogenic HCT116 cells where PTEN was deleted showed a decrease rather than an increase in the uptake of [18F]-FLT (44). Changes in PI3-K signaling can result in cell death as well as growth arrest, and GDC-0941 caused apoptosis in U87 tumors as previously described (3) (supplementary figure 3); that this was not seen after downregulation of PI3-K signaling in the HT29 model further demonstrates the different responses to pathway alterations in different cellular milieu. We have shown that [18F]FLT uptake is reduced in a genetic model of apoptosis by an unknown mechanism (data not shown) so it is possible that the reduction in uptake may be due to these apoptotic, as well as anti-proliferative, effects.
Interestingly, HCT116 tumors were sensitive to the same dose of drug in an orthotopic metastases model. Although the liver is more highly perfused than tumor, liver metastases are predominantly hypovascular (45) and there was clearly less drug in liver metastases than the surrounding tissue, consistent with drug levels being similar in both environments. It is likely that the orthotopic tumor environment more closely mimics the clinical situation (46), suggesting that differences in response may be due to orthotopic microenvironmental signaling or selection pressures on HCT116 metastases. Consistent with hypovascularity, liver metastases have been shown to be highly hypoxic (47-48), and a link between reduction in PI3-K and hypoxic signaling by GDC-0941 has been demonstrated in thyroid cancer models (16). HIF-1, CA-IX and blood vessel density (supplementary figure 1 and data not shown) were also reduced in sensitive U87 tumors after 8 days of GDC-0941 therapy, so it is possible that downregulation of hypoxic response by GDC-0941 has more impact in the metastatic environment resulting in the reduction in growth (other studies have shown that drug anti-vascular effects do not affect the uptake of either [18F]-FDG or [18F]-FLT uptake however (49), suggesting such effects do not confound the use of these imaging biomarkers).
In conclusion, our study demonstrates that [18F]-FLT is a strong candidate for monitoring the efficacy of GDC-0941 in vivo.
Supplementary Material
Acknowledgements
We thank Katrina Copeland, Jonathan Bevan and Neil O’Hara for assisting with quality control of radioisotope production, Karen Davies for technical assistance during the MRI scanning and Peter Julyan for use of his PET analysis software. The authors would also like to thank Shimadzu for the loan of the Kratos Axima MALDI TOF-TOF imaging mass spectrometer.
Financial Support: Financial contributions to this study were made by GE healthcare, and also grants to KJ Williams (EU FP7 Metoxia Grant agreement no. 222741) and C Dive (Cancer Research UK C147/A12328).
Footnotes
Conflict of Interest: Ian Wilson and Duncan Hiscock are employees of GE healthcare.
References
- (1).Vanhaesebroeck B, Stephens L, Hawkins P. PI3K signalling: the path to discovery and understanding. Nat Rev Mol Cell Biol. 2012 Mar 13;:195–203. doi: 10.1038/nrm3290. [DOI] [PubMed] [Google Scholar]
- (2).Engelman JA. Targeting PI3K signalling in cancer: opportunities, challenges and limitations. Nat Rev Cancer. 2009 Aug 9;:550–62. doi: 10.1038/nrc2664. [DOI] [PubMed] [Google Scholar]
- (3).Raynaud FI, Eccles SA, Patel S, Alix S, Box G, Chuckowree I, et al. Biological properties of potent inhibitors of class I phosphatidylinositide 3-kinases: from PI-103 through PI-540, PI-620 to the oral agent GDC-0941. Mol Cancer Ther. 2009 Jul 8;:1725–38. doi: 10.1158/1535-7163.MCT-08-1200. [DOI] [PMC free article] [PubMed] [Google Scholar]
- (4).Folkes AJ, Ahmadi K, Alderton WK, Alix S, Baker SJ, Box G, et al. The identification of 2-(1H-indazol-4-yl)-6-(4-methanesulfonyl-piperazin-1-ylmethyl)-4-morpholin-4-yl-thieno[3,2-d]pyrimidine (GDC-0941) as a potent, selective, orally bioavailable inhibitor of class I PI3 kinase for the treatment of cancer. J Med Chem. 2008 Sep 25;51:5522–32. doi: 10.1021/jm800295d. [DOI] [PubMed] [Google Scholar]
- (5).Weber WA. Monitoring Tumor Response to Therapy with F-18-FLT PET. J Nucl Med. 2010 Jun 1;51:841–4. doi: 10.2967/jnumed.109.071217. [DOI] [PubMed] [Google Scholar]
- (6).Martin-Fernandez C, Bales J, Hodgkinson C, Welman A, Welham MJ, Dive C, et al. Blocking Phosphoinositide 3-Kinase Activity in Colorectal Cancer Cells Reduces Proliferation but Does Not Increase Apoptosis Alone or in Combination with Cytotoxic Drugs. Mol Cancer Res. 2009 Jun;7:955–65. doi: 10.1158/1541-7786.MCR-08-0445. [DOI] [PMC free article] [PubMed] [Google Scholar]
- (7).Workman P, Aboagye EO, Balkwill F, Balmain A, Bruder G, Chaplin DJ, et al. Guidelines for the welfare and use of animals in cancer research. Br J Cancer. 2010 May 25;102:1555–77. doi: 10.1038/sj.bjc.6605642. [DOI] [PMC free article] [PubMed] [Google Scholar]
- (8).Blocher A, Kuntzsch M, Wei R, Machulla HJ. Synthesis and labeling of 5 ′-O-(4,4 ′-dimethoxytrityl)-2,3 ′-anhydrothymidine for [F-18]FLT preparation. Journal of Radioanalytical and Nuclear Chemistry. 2002 Jan;251:55–8. [Google Scholar]
- (9).Reader AJ, Ally S, Bakatselos F, Manavaki R, Walledge RJ, Jeavons AP, et al. One-pass list-mode EM algorithm for high-resolution 3-D PET image reconstruction into large arrays. IEEE Trans Nucl Sci. 2002 Jun;49:693–9. [Google Scholar]
- (10).Hennig J, Nauerth A, Friedburg H. Rare Imaging - A Fast Imaging Method for Clinical Mr. Magn Reson Med. 1986 Dec 3;:823–33. doi: 10.1002/mrm.1910030602. [DOI] [PubMed] [Google Scholar]
- (11).Burrows N, Resch J, Cowen RL, von Wasielewski R, Hoang-Vu C, West CM, et al. Expression of hypoxia-inducible factor 1 alpha in thyroid carcinomas. Endocr Relate Cancer. 2010 Mar;17:61–72. doi: 10.1677/ERC-08-0251. [DOI] [PMC free article] [PubMed] [Google Scholar]
- (12).Berndt A, Miller S, Williams O, Le DD, Houseman BT, Pacold JI, et al. The p110 delta structure: mechanisms for selectivity and potency of new PI(3)K inhibitors. Nat Chem Biol. 2010 Feb;6:117–24. doi: 10.1038/nchembio.293. [DOI] [PMC free article] [PubMed] [Google Scholar]
- (13).O’Brien C, Wallin JJ, Sampath D, GuhaThakurta D, Savage H, Punnoose EA, et al. Predictive Biomarkers of Sensitivity to the Phosphatidylinositol 3 ′ Kinase Inhibitor GDC-0941 in Breast Cancer Preclinical Models. Clin Cancer Res. 2010 Jul 15;16:3670–83. doi: 10.1158/1078-0432.CCR-09-2828. [DOI] [PubMed] [Google Scholar]
- (14).Kong DX, Dan SG, Yamazaki K, Yamori T. Inhibition profiles of phosphatidylinositol 3-kinase inhibitors against PI3K superfamily and human cancer cell line panel JFCR39. Eur J Cancer. 2010 Apr;46:1111–21. doi: 10.1016/j.ejca.2010.01.005. [DOI] [PubMed] [Google Scholar]
- (15).Pao W, Chmielecki J. Rational, biologically based treatment of EGFR-mutant non-small-cell lung cancer. Nat Rev Cancer. 2010 Nov;10:760–74. doi: 10.1038/nrc2947. [DOI] [PMC free article] [PubMed] [Google Scholar]
- (16).Burrows N, Babur M, Resch J, Ridsdale S, Mejin M, Rowling EJ, et al. GDC-0941 Inhibits Metastatic Characteristics of Thyroid Carcinomas by Targeting both the Phosphoinositide-3 Kinase (PI3K) and Hypoxia-Inducible Factor-1 alpha (HIF-1 alpha) Pathways. J Clin Endocrinol Metabol. 2011 Dec;96:E1934–E1943. doi: 10.1210/jc.2011-1426. [DOI] [PubMed] [Google Scholar]
- (17).Gerlinger M, Rowan AJ, Horswell S, Larkin J, Endesfelder D, Gronroos E, et al. Intratumor Heterogeneity and Branched Evolution Revealed by Multiregion Sequencing. N Engl J Med. 2012 Mar 8;366:883–92. doi: 10.1056/NEJMoa1113205. [DOI] [PMC free article] [PubMed] [Google Scholar]
- (18).Fuereder T, Wanek T, Pflegerl P, Jaeger-Lansky A, Hoeflmayer D, Strommer S, et al. Gastric Cancer Growth Control by BEZ235 In Vivo Does Not Correlate with PI3K/mTOR Target Inhibition but with [(18)F]FLT Uptake. Clin Cancer Res. 2011 Aug 15;17:5322–32. doi: 10.1158/1078-0432.CCR-10-1659. [DOI] [PubMed] [Google Scholar]
- (19).Logue JS, Morrison DK. Complexity in the signaling network: insights from the use of targeted inhibitors in cancer therapy. Genes Dev. 2012 Apr 1;26:641–50. doi: 10.1101/gad.186965.112. [DOI] [PMC free article] [PubMed] [Google Scholar]
- (20).Herrmann K, Buck AK, Schuster T, Junger A, Wieder HA, Graf N, et al. Predictive Value of Initial F-18-FLT Uptake in Patients with Aggressive Non-Hodgkin Lymphoma Receiving R-CHOP Treatment. J Nucl Med. 2011 May;52:690–6. doi: 10.2967/jnumed.110.084566. [DOI] [PubMed] [Google Scholar]
- (21).Linecker A, Kermer C, Sulzbacher I, Angelberger P, Kletter K, Dudczak R, et al. Uptake of F-18-FLT and F-18-FDG in primary head and neck cancer correlates with survival. Nuklearmedizin. 2008;47:80–5. doi: 10.3413/nukmed-0092. [DOI] [PubMed] [Google Scholar]
- (22).Zhang CC, Yan ZM, Li WL, Kuszpit K, Painter CL, Zhang Q, et al. [F-18] FLT-PET Imaging Does Not Always “Light Up” Proliferating Tumor Cells. Clin Cancer Res. 2012 Mar 1;18:1303–12. doi: 10.1158/1078-0432.CCR-11-1433. [DOI] [PubMed] [Google Scholar]
- (23).Moroz MA, Kochetkov T, Cai SD, Wu JY, Shamis M, Nair J, et al. Imaging Colon Cancer Response Following Treatment with AZD1152: A Preclinical Analysis of [F-18]Fluoro-2-deoxyglucose and 3 ′-deoxy-3 ′-[F-18]Fluorothymidine Imaging. Clin Cancer Res. 2011 Mar 1;17:1099–110. doi: 10.1158/1078-0432.CCR-10-1430. [DOI] [PMC free article] [PubMed] [Google Scholar]
- (24).Bayraktar UD, Bayraktar S, Rocha-Lima CM. Molecular basis and management of gastrointestinal stromal tumors. World J Gastroenterol. 2010 Jun 14;16:2726–34. doi: 10.3748/wjg.v16.i22.2726. [DOI] [PMC free article] [PubMed] [Google Scholar]
- (25).Mudd SR, Holich KD, Voorbach MJ, Cole TB, Reuter DR, Tapang P, et al. Pharmacodynamic evaluation of irinotecan therapy by FDG and FLT PET/CT imaging in a colorectal cancer xenograft model. Mol Imaging Biol. 2012 Oct;14:617–24. doi: 10.1007/s11307-011-0529-8. [DOI] [PubMed] [Google Scholar]
- (26).Lee SJ, Kang HY, Kim SY, Chung JH, Oh SJ, Ryu JS, et al. Early assessment of tumor response to JAC106, an anti-tubulin agent, by 3 ′-deoxy-3 ′-[F-18]fluorothymidine in preclinical tumor models. Eur J Nucl Med Mol Imaging. 2011 Aug;38:1436–48. doi: 10.1007/s00259-011-1802-4. [DOI] [PubMed] [Google Scholar]
- (27).Brepoels L, Stroobants S, Verhoef G, De Groot T, Mortelmans L, De Wolf-Peeters C. (18)F-FDG and (18)F-FLT Uptake Early After Cyclophosphamide and mTOR Inhibition in an Experimental Lymphoma Model. J Nucl Med. 2009 Jul;50:1102–9. doi: 10.2967/jnumed.109.062208. [DOI] [PubMed] [Google Scholar]
- (28).Ullrich RT, Zander T, Neumaier B, Koker M, Shimamura T, Waerzeggers Y, et al. Early Detection of Erlotinib Treatment Response in NSCLC by 3 ′-Deoxy-3 ′-[F-18]-Fluoro-L-Thymidine ([F-18]FLT) Positron Emission Tomography (PET) Plos One. 2008 Dec 12;:3. doi: 10.1371/journal.pone.0003908. [DOI] [PMC free article] [PubMed] [Google Scholar]
- (29).Wei LH, Su H, Hildebrandt IJ, Phelps ME, Czernin J, Weber WA. Changes in tumor metabolism as readout for mammalian target of rapamycin kinase inhibition by rapamycin in glioblastoma. Clin Cancer Res. 2008 Jun 1;14:3416–26. doi: 10.1158/1078-0432.CCR-07-1824. [DOI] [PubMed] [Google Scholar]
- (30).Leyton J, Smith G, Lees M, Perumal M, Nguyen QD, Aigbirhio FI, et al. Noninvasive imaging of cell proliferation following mitogenic extracellular kinase inhibition by PD0325901. Mol Cancer Ther. 2008 Sep;7:3112–21. doi: 10.1158/1535-7163.MCT-08-0264. [DOI] [PubMed] [Google Scholar]
- (31).Solit DB, Santos E, Pratilas CA, Lobo J, Moroz M, Cai S, et al. 3′-deoxy-3′-[(18)F]fluorothymidine positron emission tomography is a sensitive method for imaging the response of BRAF-dependent tumors to MEK inhibition. Cancer Res. 2007 Dec 1;67:11463–9. doi: 10.1158/0008-5472.CAN-07-2976. [DOI] [PMC free article] [PubMed] [Google Scholar]
- (32).Cullinane C, Dorow DS, Jackson S, Solomon B, Bogatyreva E, Binns D, et al. Differential F-18-FDG and 3 ′-Deoxy-3 ′-F-18-Fluorothymidine PET Responses to Pharmacologic Inhibition of the c-MET Receptor in Preclinical Tumor Models. J Nucl Med. 2011 Aug 1;52:1261–7. doi: 10.2967/jnumed.110.086967. [DOI] [PubMed] [Google Scholar]
- (33).Perumal M, Pillai RG, Barthel H, Leyton J, Latigo JR, Forster M, et al. Redistribution of nucleoside transporters to the cell membrane provides a novel approach for imaging thymidylate synthase inhibition by positron emission tomography. Cancer Res. 2006 Sep 1;66:8558–64. doi: 10.1158/0008-5472.CAN-06-0898. [DOI] [PubMed] [Google Scholar]
- (34).Leyton J, Alao JP, Da Costa M, Stavropoulou AV, Latigo JR, Perumal M, et al. In vivo biological activity of the histone deacetylase inhibitor LA0824 is detectable with 3 ′-deoxy-3 ′-[F-18]fluorothymidine positron emission tomography. Cancer Res. 2006 Aug 1;66:76, 21–9. doi: 10.1158/0008-5472.CAN-05-3962. [DOI] [PubMed] [Google Scholar]
- (35).Waldherr C, Mellinghoff IK, Tran C, Halpern BS, Rozengurt N, Safaei A, et al. Monitoring antiproliferative responses to kinase inhibitor therapy in mice with 3 ′-deoxy-3 ′-F-18-fluorothymidine PET. J Nucl Med. 2005 Jan;46:114–20. [PubMed] [Google Scholar]
- (36).Barthel H, Cleij MC, Collingridge DR, Hutchinson OC, Osman S, He QM, et al. 3 ′-deoxy-3 ′-[F-18]fluorothymidine as a new marker for monitoring tumor response to antiproliferative therapy in vivo with positron emission tomography. Cancer Res. 2003 Jul 1;63:3791–8. [PubMed] [Google Scholar]
- (37).Schwarzenberg J, Czernin J, Cloughesy TF, Ellingson BM, Pope WB, Geist C, et al. 3 ′-Deoxy-3 ′-F-18-Fluorothymidine PET and MRI for Early Survival Predictions in Patients with Recurrent Malignant Glioma Treated with Bevacizumab. J Nucl Med. 2012 Jan 1;53:29–36. doi: 10.2967/jnumed.111.092387. [DOI] [PMC free article] [PubMed] [Google Scholar]
- (38).Reagan-Shaw S, Nihal M, Ahmad N. Dose translation from animal to human studies revisited. FASEBJ. 2008 Mar;22:659–61. doi: 10.1096/fj.07-9574LSF. [DOI] [PubMed] [Google Scholar]
- (39).Basu B, Baird R, Shah K, Banerjee S, Sarker D, Luscombe N, et al. A phase I study evaluating GDC-0941, an oral phosphoinositide-3 kinase (PI3K) inhibitor, in patients (pts) with advanced solid tumors or multiple myeloma. National Cancer Research Institute (NCRI) Cancer Conference 2011; 6-9 Nov 2011; Liverpool, UK: NCRI; Nov, 2011. Abstract B29. [Google Scholar]
- (40).Jensen MM, Erichsen KD, Bjorkling F, Madsen J, Jensen PB, Hojgaard L, et al. Early Detection of Response to Experimental Chemotherapeutic Top216 with [F-18]FLT and [F-18]FDG PET in Human Ovary Cancer Xenografts in Mice. Plos One. 2010 Sep 24;:5. doi: 10.1371/journal.pone.0012965. [DOI] [PMC free article] [PubMed] [Google Scholar]
- (41).Roberts PJ, Usary JE, Darr DB, Dillon PM, Pfefferle AD, Whittle MC, et al. Combined PI3K/mTOR and MEK Inhibition Provides Broad Antitumor Activity in Faithful Murine Cancer Models. Clin Cancer Res. 2012 Oct 1;18:5290–303. doi: 10.1158/1078-0432.CCR-12-0563. [DOI] [PMC free article] [PubMed] [Google Scholar]
- (42).Salphati L, Wong H, Belvin M, Bradford D, Edgar KA, Prior WW, et al. Pharmacokinetic-Pharmacodynamic Modeling of Tumor Growth Inhibition and Biomarker Modulation by the Novel Phosphatidylinositol 3-Kinase Inhibitor GDC-0941. Drug Metab Dispos. 2010 Sep;38:1436–42. doi: 10.1124/dmd.110.032912. [DOI] [PubMed] [Google Scholar]
- (43).Matthews DJ, Ventura R, Tai A, Holst C, O′Farrell M. PWT33597 promotes apoptosis in tumor cells through balanced dual inhibition of PI3K alpha and mTOR. Proceedings of the AACR-NCI-EORTC International Conference: Molecular Targets and Cancer Therapeutics; 2011 Nov 12-16; San Francisco, CA. Philadelphia (PA): AACR; Mol Cancer Ther 2011;10(11 Suppl):Abstract nr B160. [Google Scholar]
- (44).Nguyen QD, Perumal M, Waldman TA, Aboagye EO. Glucose Metabolism Measured by [F-18]Fluorodeoxyglucose Positron Emission Tomography Is Independent of PTEN/AKT Status in Human Colon Carcinoma Cells. Transl Oncol. 2011 Aug;4:231–8. doi: 10.1593/tlo.11118. [DOI] [PMC free article] [PubMed] [Google Scholar]
- (45).Kanematsu M, Kondo H, Goshima S, Kato H, Tsuge U, Hirose Y, et al. Imaging liver metastases: Review and update. Eur J Radiol. 2006 May;58:217–28. doi: 10.1016/j.ejrad.2005.11.041. [DOI] [PubMed] [Google Scholar]
- (46).Kerbel RS. Human tumor xenografts as predictive preclinical models for anticancer drug activity in humans - Better than commonly perceived - But they can be improved. Cancer Biol Ther. 2003 Jul;2:S134–S139. [PubMed] [Google Scholar]
- (47).Lee S, Wong P, Lee ST, Wong P, Muralidharan V, Herbertson R, et al. Non-invasive evaluation of hypoxia using 18F-FMISO PET in liver metastasis from colorectal carcinoma. J.Nucl.Med. 49(Supplement 1):318P. [Google Scholar]
- (48).van Laarhoven HWM, Bussink J, Lok J, Verhagen I, Punt CJA, Heerschap A, et al. Modulation of hypoxia in murine liver metastases of colon carcinoma by nicotinamide and carbogen. Radiat Res. 2005 Sep;164:245–9. doi: 10.1667/rr3435.1. [DOI] [PubMed] [Google Scholar]
- (49).Honer M, Ebenhan T, Allegrini PR, Ametamey SM, Becquet M, Cannet C, et al. Anti-Angiogenic/Vascular Effects of the mTOR Inhibitor Everolimus Are Not Detectable by FDG/FLT-PET. Transl Oncol. 2010;3:264–75. doi: 10.1593/tlo.10127. [DOI] [PMC free article] [PubMed] [Google Scholar]
Associated Data
This section collects any data citations, data availability statements, or supplementary materials included in this article.