

Abstract
Rationale and Purpose
Motivational interviewing (MI) is a counseling technique that has been used effectively to change a number of health-related behaviors. We sought to assess the impact on patients’ antiretroviral therapy (ART) adherence of a multicomponent, MI-based ART adherence intervention compared with that of an HIV informational control program.
Study Design
Two-arm, randomized, controlled trial.
Sample
One hundred forty adult HIV-infected patients attending a large, academic center infectious diseases clinic who were either failing or newly initiating an ART regimen.
Study Endpoints
(1) Mean adherence level (% of prescribed doses take in the prior month) at the week 12 visit, (2) change in mean adherence, (3) percentage of patients achieving >95% adherence in the third 4-week block, and (4) change in viral load.
Main Findings
The MI group’s mean adherence improved by 4.5% compared with a decrease in the control group’s adherence by 3.83% (P = 0.10). In the treatment group, 29% achieved >95% adherence compared with only 17% in the control group (P = 0.13). When we controlled for ethnicity, the intervention group had 2.75 times higher odds of achieving more than 95% adherence than did the controls (P = 0.045; 95% confidence interval: 1.023, 7.398). Although a number of mediating variables (beliefs about ART, coping style, social support, and goals set) had statistically significant changes in the expected direction in the MI group compared with controls, in the intent-to-treat analysis, the mean adherence at study exit for the intervention group was 76% (SD = 27%) and 71% (SD = 27%) for the control group (P = 0.62).
Conclusion
Although not definitive, this study provides some evidence that MI offers an effective approach to improving adherence. Future studies able to build MI into the intervention for longer than 3 months may have a greater impact.
Keywords: antiretroviral adherence, motivational interviewing, medication compliance
Most patients are unable to achieve and sustain the high levels of antiretroviral therapy (ART) adherence needed to maintain the substantial health benefits of combination ART.1-5 Few studies have identified effective interventions that improve ART adherence,2-23 a complex behavior with multiple determinants.21,24 Patient-centered, comprehensive adherence interventions are most likely to be effective.24-27 The individually tailored nature of motivational interviewing (MI), an effective theory-based, client-centered counseling approach,28-35 makes it a promising strategy for addressing the complex, multidimensional features of ART adherence.28,36-39,41
Using a conceptual model based on a comprehensive literature review, formative research, and social cognitive theory, we developed the PACT (Participating And Communicating Together) MI program to enhance ART adherence.36 Previously, we demonstrated that the intervention was feasible; a majority of patients found it acceptable and highly useful,36 and we met quality benchmarks for MI counseling.38 In the present study, we report the effect of the PACT intervention on patients’ objectively measured ART adherence.
METHODS
Overall Design
The study used a clinic-based 2-arm block, randomized, controlled design to compare adherence (at 12-week follow-up) of patients receiving an MI intervention with those receiving a dose-matched HIV informational control program (Fig. 1). Participants in both groups received 3 components: (1) a 20-minute audiotape and booklet immediately before seeing their medical provider, (2) 2 one-on-one sessions with a health educator at weeks 4 and 8 of follow-up, and (3) a mailing 2 weeks after each individual session. Control group materials were comparable to the intervention in length and format to control for the placebo effect of exposure25,42,43 but provided general HIV information only. Intervention assignment was concealed from providers and research assistants (RAs) collecting baseline, week 4, and week 12 data.
FIGURE 1.
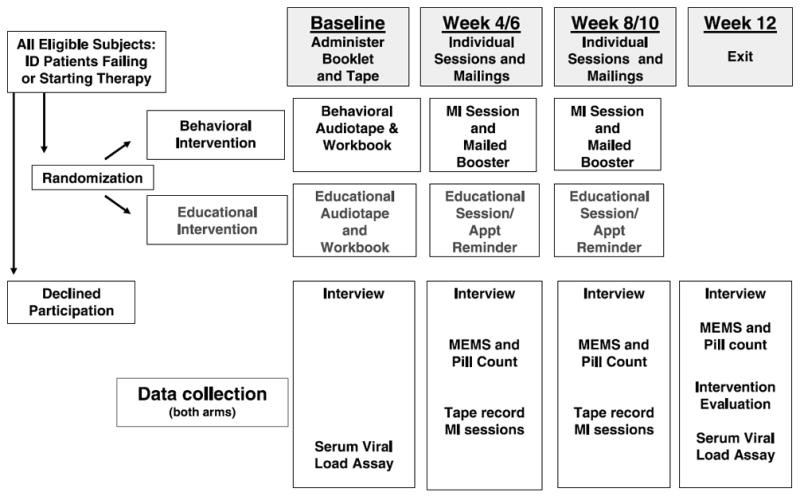
Study design.
MI Intervention
Three masters’ degree-level health educators received a series of standardized workshops on MI over 2 months (3 days for 24 hours), conducted by members of the Motivational Interviewing Network of Trainers. The MI intervention28,36 focuses on concerns that the patient identifies as salient; the counselor uses techniques such as reflective listening and issue reframing to raise patients’ awareness of their thoughts/feelings about adherence and to develop medication self-management skills. A standardized MI guide composed of 7 main steps was used (described in detail previously).36 Confidential booster letters reviewing issues raised in the MI session were sent 2 weeks after each session.
MI Quality Assurance and Fidelity to the Protocol
All MI sessions were audiotaped. The principal investigator (C.G., a member of the Motivational Interviewing Network of Trainers) reviewed the tapes and conducted feedback sessions at biweekly in-service trainings. At the end of each MI session, the health educators recorded the content of each of the 7 protocol steps on an MI data recording sheet (validated with 86% agreement with audiotapes on a 20% sample of sessions by an independent reviewer). Most sessions achieved MI quality benchmarks.38
Sample
We screened medical records of all scheduled patients at a large academic center’s Infectious Diseases Clinic providing primary HIV care to patients from throughout rural and urban North Carolina. Patients were eligible who (1) attended the clinic at our study site between May 2001 and May 2003 and who were (2) HIV-infected, (3) were older than 18 years old, (4) had previously consented to be contacted for potential participation in research studies (>90% of patients in this clinic have so consented), (5) either a new patient or had (a) a 0.5-log increase in viral load in the last 6 months, (b) an increase in viral load from undetectable to >200 copies/mL, (c) a failure to drop at least 0.5 log after 60 days on new drug regimen OR, (d) the medical record stated that the patient was being considered for initiation of ART. Patients meeting preliminary criteria were contacted by telephone and scheduled for a study visit an hour before their clinic appointment. Final eligibility was confirmed when patients were placed on antiretroviral medication.
Study Endpoints
The primary endpoint was “mean adherence level (% of prescribed doses take in the prior month) at the week 12 visit.” For the few patients who were taken off all ART medication by their physician at week 8 (n = 11), we used the adherence level obtained at the week 8 visit. We also compared groups regarding (1) the change in mean adherence from the first 4-week block (weeks 0–4) to the third 4–week block (weeks 8–12), (2) the percentage of patients achieving >95% adherence at the third 4-week block, (3) change in viral load from baseline to exit, and (4) the change in weekly mean adherence from baseline through the last 4-week block.
Data Collection and Study Procedures
Before their medical visit and intervention assignment, participants gave informed consent and completed a baseline interview. Then participants listened to the audiotape with follow-along booklet. Control and intervention audiotapes were visually identical. After the medical visit, participants informed the RA of medication changes made during the medical visit, completed a brief postvisit interview, had blood drawn, and placed an electronic cap (eDEMS-Electronic Drug Event Monitoring System) on one ARV (antiretroviral) (described below). At weeks 4, 8, and 12, all participants completed a follow-up survey and had their pills counted and their eDEMS downloaded. Patients received compensation for completing surveys but not for participating in the intervention. The University of North Carolina at Chapel Hill Internal Review Board approved all procedures.
Measurement of Adherence
Using a previously validated method,1 we assessed adherence (the number of doses taken divided by the number of doses prescribed over a 4-week period) by a composite adherence score (CAS) incorporating 3 measures: pill counts, self-reported adherence, and data from an eDEMs cap containing a microchip that recorded each instance of bottle opening. We used a standardized algorithm to determine which medication we would monitor with eDEMS: the cap was placed on a protease inhibitor (PI) if the patient were on a PI, an NNRTI if no PI were available, and an NRTI if neither PI nor NNRTI were available. The RA also counted the participant’s remaining ART pills. Self-reported adherence for the 3 days before the study visit was assessed by asking: “We know that it is hard for most people to take their medicine perfectly all the time. Thinking of yesterday/the day before yesterday/the day before that, how many times did you miss a dose of [Medicine X]?” Responses were confirmed by a secondary question.
As described elsewhere,1 because eDEMS records each bottle opening, it is most closely related to medication dosing and was used as the foundation of CAS. Patients were given detailed instructions about how to use the eDEMS cap but were encouraged to use pillboxes, if desired. Inaccuracies in eDEMS (due to pillbox use or otherwise) were identified by consensus of a group of 4 researchers (C.G., C.P., H.T., L.H.) on a case-by-case basis using the results of the standardized interviewer-administered form that assessed for (1) medication changes, (2) use of a pillbox or other instances when pills were taken without cap opening, (3) use of medications distributed by other people, (4) medication sharing, (5) lost or damaged bottles and caps, and (6) times of cap-opening without pill taking. In a hierarchical fashion, when eDEMS values were missing or inaccurate, CAS values were obtained from calibrated pill count adherence estimates instead of eDEMS. If the pill count information was also missing or deemed inaccurate (such as with pill dumping OR lack of accurate dispensing dates), CAS was obtained from calibrated self-reported adherence values.
Most CAS measures were based on eDEMS data alone (69%). Before use in the CAS computation, pill count and self-reported adherence values were calibrated to eDEMS values using separate repeated measures longitudinal models for each (see Appendix 1). Calibration was performed because when eDEMS, pill count, and self-report were available for the same 4-week block, pill count and self-report were regularly higher than eDEMS as has also been shown in prior studies.1
Viral Load
Baseline and exit viral load levels were assessed using the Roche COBAS AMPLICOR HIV-1 MONITOR v1.0 (before February 2003) v1.5 (after February 2003).
Covariates Measured
At each study visit, we used scales developed and utilized in previous studies21,44 to assess potential moderating and mediating factors (patient and regimen characteristics, features of the patient-provider relationship, and socio-environmental factors) (Table 1). We assessed demographic, clinical, and psychosocial factors (self-efficacy to take medication as prescribed21,44 and coping style45). We also assessed patients’ regimen fit with their lifestyles,21,44 access to ART,44,46 medication side effects, and difficulties understanding and remembering medications. We used previously validated scales to assess satisfaction with medical care,47 trust in the provider,48,21 and the perception that the provider facilitated patient involvement.49 Finally, we measured the stigma perceived to be associated with taking ART, perceived environmental stress,50 available social support,21,51 and whether patients had case managers.
TABLE 1.
Sociodemographic, Clinical, and Psychosocial Characteristics of the Study Sample by Intervention Group
| Variables | Treatment
|
|||
|---|---|---|---|---|
| Intervention
|
Control
|
|||
| n | Percent or Mean (SD) | n | Percent or Mean (SD) | |
| Age | 68 | 39.91 (8.77) | 66 | 40.46 (8.29) |
| Male gender (%) | 72 | 69.4% | 65 | 63.1% |
| Ethnicity (%) | 69 | 66 | ||
| African American | 76.8% | 54.6% | ||
| White | 14.5% | 30.3% | ||
| Other | 8.7% | 15.2% | ||
| Income (mean dollars/y) | 67 | $17,082 (18,730) | 64 | $20,359 (22,445) |
| Education (%) | 70 | 66 | ||
| ≤some high school | 30.00% | 15.15% | ||
| High school graduate/Graduate Equivalent Diploma (GED) | 31.43% | 37.88% | ||
| Some college | 22.86% | 27.27% | ||
| ≥College graduate | 15.71% | 19.70% | ||
| Has case manger (%) | 63 | 55.56% | 61 | 40% |
| Work status (%) | 70 | 66 | ||
| Work full/part time | 17.1% | 19.7% | ||
| On disability | 62.9% | 59.1% | ||
| Don’t work | 20.0% | 21.2% | ||
| Living with a partner (%) | 70 | 34.29% | 66 | 39.39% |
| Baseline viral load (log10) | 67 | 3.68 (1.13) | 63 | 3.92 (1.15) |
| Number of months on meds | 73 | 92 (60) | 65 | 94 (53) |
| Satisfaction with medical care (scale of 1–10) | 63 | 8.92 (1.58) | 58 | 9.00 (1.29) |
| Emotional Health Related Quality of Life (HRQOL) (mean) | 61 | 21.84 (9.35) | 59 | 20.88 (8.17) |
| No. of alcohol drinks in past 30 days | 67 | 5.71 (12.48) | 65 | 8.05 (17.33) |
| No. of days marijuana was used in past 30 days | 66 | 3.05 (7.84) | 65 | 3.18 (8.66) |
| No. of days cocaine was used in past 30 days | 67 | 0.12 (0.44) | 64 | 0.55 (2.02) |
| General health status | 61 | 59 | ||
| Poor | 11.5% | 8.5% | ||
| Fair | 23.0% | 28.8% | ||
| Good | 32.8% | 27.1% | ||
| Very good/excellent | 32.83% | 35.5% | ||
| High motivation to adhere (%) | 65 | 95.38% | 61 | 91.80% |
| General social support | 61 | 11.93 (3.13) | 59 | 10.68 (3.94) |
| Desire to participate in medical decision-making (scale of 1–7) | 67 | 3.55 (2.12) | 61 | 4.05 (2.13) |
| Beliefs about medications (%) | ||||
| Believe ART helps people live longer | 65 | 71% | 61 | 85% |
| Believe ART makes quality of life much better | 66 | 50% | 61 | 57% |
| Agree/Strongly Agree that taking ART is too much trouble for benefit | 65 | 25% | 60 | 17% |
| Believe ART is definitely worth taking | 64 | 78% | 61 | 77% |
| Believe will definitely get worse if don’t take ART | 65 | 65% | 60 | 73% |
| Amount of time ART regimen fits with lifestyle (%) | 49 | 46 | ||
| A little to none (%) | 68% | 73% | ||
| Access to HIV ART (%) | ||||
| Very easy to get ART prescription filled | 49 | 65% | 46 | 55% |
| Very easy to get more ART if lost them or ran out | 48 | 43% | 46 | 37% |
| The need to keep ART private gets in the way of taking almost none of the time | 49 | 76% | 46 | 78% |
| Barriers to Taking ART | ||||
| Has experienced side effects from ART | 49 | 55% | 46 | Yes: 54% |
| Very/Somewhat hard to remember to take ART | 49 | 26% | 46 | Very/somewhat hard: 15% |
| Understand how to take ART | 49 | 82% | 46 | Understand: 87% |
| Trust in provider (scale of 5–25) | 61 | 23.74 (2.12) | 58 | 23.48 (2.56) |
| Coping | 61 | 59 | ||
| Positive coping (scale of 6–30) | 24.00 (3.88) | 22.38 (4.34) | ||
| Avoidant coping (scale of 4–20) | 12.59 (4.12) | 12.48 (3.79) | ||
| Information-seeking coping (scale of 2–10) | 5.79 (2.37) | 5.73 (2.12) | ||
| Stress (scale of 5–25) | 61 | 12.38 (5.01) | 59 | 11.78 (3.83) |
Process Evaluation
To assess fidelity and adherence to the intervention, at exit, we asked participants in both arms of the trial to freely list the following: (1) things they liked about the sessions, (2) any goals that they had set, (3) any strategies that they had developed, and (4) things that had helped them achieve their goals. Two RAs independently coded the responses to these free-list questions using an iteratively derived manual of operationally defined codes (reliability >85% agreement).
Statistical Analyses
To characterize our sample, we graphed distributions of important variables and calculated summary statistics. We compared the demographic characteristics of those agreeing versus declining participation in the study.
Statistical analyses were performed using SAS 8.2 (Cary, NC). Time-varying CASs over time were computed using repeated measures gamma regression models.55 Testing of statistical differences of mean adherence levels at exit was based on gamma regression. For the subsample of those who had valid eDEMS readings (N = 81), the weekly mean adherence over time was also compared by repeated measures gamma regression model.
Chi-square test was used to assess the effect of experimental group assignment on the proportion of patients achieving >95% adherence and those achieving an undetectable viral load. The changes in mean adherence from weeks 0 to 4 to weeks 8 to 12 were evaluated by Wilcoxon rank sum test. We also conducted multivariate analyses of factors, including the intervention arm, associated with adherence. Because of our sample size, we did not include all variables from Table 1 in the multivariate analysis but rather selected a more parsimonious model from an a priori conceptual model based on prior studies of factors associated with ART adherence. Of all the factors in the original multivariate model (baseline eDEMS, age, gender, race, exit viral load, alcohol and drug use, a belief that “medicines were worth taking,” and ever having a psychiatric diagnosis), only ethnicity affected ART adherence and so was the only factor kept in the final model. We assessed changes in mediating factors from baseline to exit by χ2 test or Mantel-Haenszel χ2 test for categorical measurements and paired t test or Wilcoxon rank sum test for continuous measures.
RESULTS
Participation and Dropouts
Of the 1078 patients who we screened over 2 years, 397 met initial eligibility criteria; of these, we were able to contact 230 (Fig. 2). Of these, 155 agreed to participate; 77 were randomized to received MI and 78 to the educational control group. Seventy-four of the intervention group members and 66 of the control group members were placed on medication by their provider; 59 and 58 in each group, respectively, completed the study. Median length of follow-up was 13 weeks (mean 14 weeks). There were no statistically significant differences in the rate of dropout at any time point in the study by intervention assignment. Reasons for loss to follow-up included illness (1 MI, 1 control), death (1 control), incarceration (1 MI), homelessness and other social issues (1 control, 3 MI), loss of transportation (1 control), work commitments (1 MI), changed clinics (1 control), and unable to contact (7 MI, 3 control).
FIGURE 2.
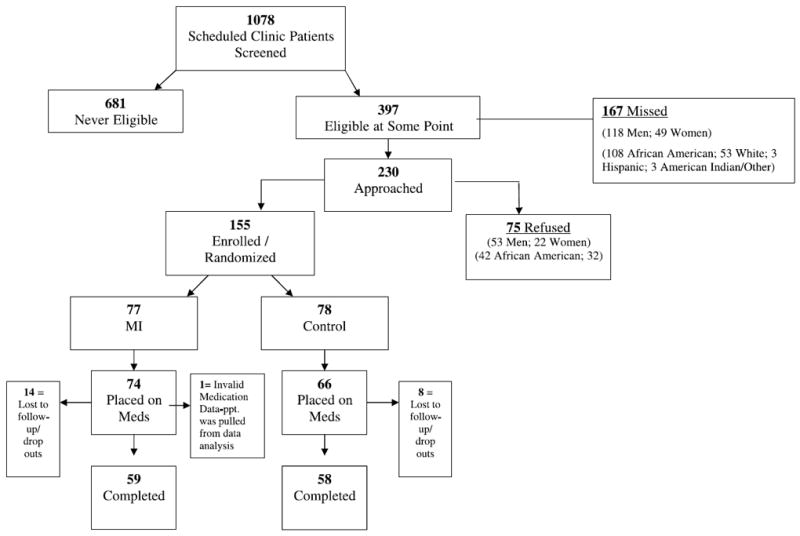
Recruitment and retention patterns of study participants.
Sample Characteristics at Baseline
Sample characteristics are reported in Table 1. Seventy-seven percent were on antiretroviral medication at the time of enrollment; the mean length of time on ART for the entire group was 93 months. Thirteen percent of those in the intervention group and 12% of those in the control group were initiating therapy. The mean adherence for patients beginning therapy for the first time was 75.3%, and for those failing therapy, it was 73.6% (P = 0.9019), with no evidence of an interaction effect on adherence between patients’ intervention arm and whether they had initiated therapy (P = 0.3845).
Differences in Mean Adherence Level at Exit and in Changes in Adherence Over Time
From week 4 to exit at week 12, the MI group’s mean adherence improved by 4.5% compared with a 3.83% decrease in the control group’s adherence (P = 0.10). Among those with valid eDEMS data available (N = 81), the plot of weekly adherence over time showed an increase in adherence in the intervention group and a decline in adherence in the control group (P = 0.0924) (Fig. 3). In the treatment group, 29% achieved >95% adherence compared with only 17% in the control group (P = 0.13). When we controlled for ethnicity, the intervention group had 2.75 times higher odds of achieving more than 95% adherence than did the controls [P = 0.045; 95% confidence interval (CI): 1.023, 7.398]. Of note, African Americans had 0.353 odds of achieving at least 95% adherence at week 12 compared with patients of other races [P = 0.0393; 95% CI: 0.131, 0.952]. We found no interaction between race and the effect of the intervention on adherence (P = 0.6169). In the intent-to-treat analysis, the mean adherence at study exit for the intervention group was 76% (SD = 27%) versus 71% (SD = 27%) for the control group (P = 0.62). (Adherence at week 12 was correlated with viral load, with Pearson correlation coefficient being −0.23 [P = 0.017].)
FIGURE 3.
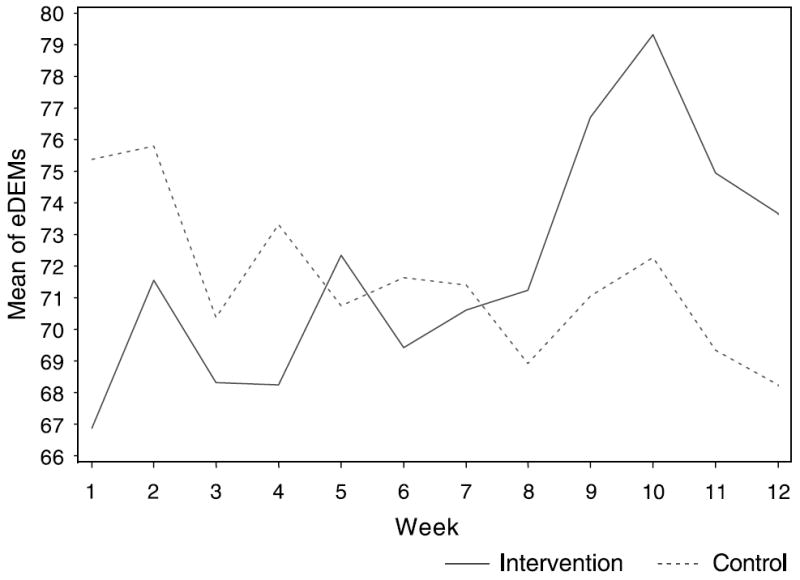
Mean of eDEMs from weeks 1 to 12 by treatment group.
Viral Load
There was no statistically significant difference in change in viral load (log10 scale) between the intervention [mean change from baseline to exit −0.685; SD 1.47; (95% CI: −1.094, −0.276)] and the control groups [mean change from baseline to exit −0.690; SD 1.06; (95% CI: −0.985, −0.395)]. Fifty-two percent of those in the intervention group and 44% in the control group achieved an undetectable viral load.
Psychosocial Mediating Variable Outcomes by Treatment Group and Difference in Process Measures by Treatment Group
At exit, 92% of those in the intervention group versus only 79% of controls felt that their ART medications were definitely worth taking (Table 2). Further, those in the intervention group had a greater increase in their beliefs that ART was definitely worth taking than did those in the control group (P = 0.04). Second, patients in the intervention group also had a more marked decrease (from baseline to exit) in their use of avoidant coping (−2.33) than did those in the control group (−1.0) (P = 0.0629). The proportion of patients who perceived easy access to getting prescriptions filled increased more in the MI group (from 44% to 79%) than the controls (from 36% to 55%; P = 0.013 for the difference between groups). On average, the MI group had a greater decrease in social support than did the control group (P = 0.02). The mean number of days marijuana was used decreased in the MI group by 0.61 days, whereas it increased by 0.51 days in controls (P = 0.17).
TABLE 2.
Pyschosocial Mediating Factors: Outcomes by Treatment Group
| Treatment
|
P | ||||
|---|---|---|---|---|---|
| Intervention
|
Control
|
||||
| n | Mean (SD) | n | Mean (SD) | ||
| Change in number of alcohol drinks in past 30 days* | 55 | 0.86 (9.39) | 57 | 4.24 (36.37) | 0.4611 |
| Change in number of days marijuana was used in past 30 days | 54 | −0.61 (3.86) | 57 | 0.51 (3.70) | 0.1688 |
| Change in number of days cocaine was used in past 30 days* | 55 | 0.13 (0.75) | 57 | −0.40 (1.92) | 0.3793 |
| Change in self-efficacy* | 30 | −0.27 (1.44) | 35 | −0.57 (1.65) | 0.2877 |
| High motivation to adhere (exit)† | 60 | 93.3% | 56 | 87.5% | 0.2839 |
| (Controlling for baseline)‡ | 0.3641 | ||||
| Change in general social support* | 49 | −0.5 (3.59) | 52 | 0.71 (3.28) | 0.0212 |
| Change in desire to participate in medical decision making* | 55 | 0.36 (1.80) | 54 | −0.20 (2.01) | 0.1975 |
| Change in beliefs about ART | |||||
| Believe ART helps person live longer (exit)† | 59 | 79.66% | 56 | 85.71% | 0.3920 |
| (Controlling for baseline)‡ | 0.7747 | ||||
| Believe ART makes quality of life much better (exit)† | 60 | 66.67% | 56 | 51.79% | 0.1028 |
| (Controlling for baseline)‡ | 0.0884 | ||||
| Believe Taking ART is too much trouble for benefit (exit)§ | 60 | 57 | 0.9303 | ||
| Strongly disagree | 55.00% | 54.39% | |||
| Disagree | 36.67% | 36.84% | |||
| Agree/Strongly Agree | 8.33% | 8.77% | |||
| (Controlling for baseline)∥ | 0.2227 | ||||
| Believe ART is definitely worth taking (exit)† | 60 | 91.67% | 57 | 78.95% | 0.0510 |
| (Controlling for baseline)‡ | 0.0421 | ||||
| Believe will definitely get worse if don’t take ART (exit)† | 60 | 75.00% | 57 | 80.70% | 0.4584 |
| (Controlling for baseline)‡ | 0.7824 | ||||
| Amount of time ART regimen fits with lifestyle (%) | 54 | 52 | 0.3827 | ||
| None of the time | 55.56% | 49.15% | |||
| Little of time | 22.22% | 26.92% | |||
| Some/most/all of the time | 22.22% | 26.92% | |||
| (Controlling baseline)∥ | 0.6917 | ||||
| Access to ART | |||||
| How easy or hard to get ART prescription filled (exit) | 53 | 53 | 0.0132 | ||
| Very/somewhat hard | 11.32% | 24.53% | |||
| Somewhat easy | 9.43% | 20.75% | |||
| Very easy | 79.25% | 54.72% | |||
| (Controlling baseline)∥ | 0.1252 | ||||
| How easy to get more ART if lost or ran out (exit)§ | 54 | 50 | 0.8333 | ||
| Very/somewhat hard | 20.37% | 16.00% | |||
| Somewhat easy | 24.07% | 36.00% | |||
| Very easy | 55.56% | 48.00% | |||
| (Controlling baseline)∥ | 0.7276 | ||||
| Extent that a need for privacy interferes with taking ART (exit)§ | 54 | 52 | 0.9370 | ||
| Almost none of time | 81.48% | 86.54% | |||
| Some of the time | 14.81% | 3.85% | |||
| Most/nearly all of the time | 54 | 3.70% | 9.62% | ||
| (Controlling for baseline stigma/privacy)∥ | 0.2613 | ||||
| Experienced side effects during study (exit)† | 54 | 53.70% | 52 | 38.46% | 0.1173 |
| (Controlling baseline)‡ | 0.9100 | ||||
| Barriers to taking ART | |||||
| How hard or easy it is to remember to take ART (exit)§ | 54 | 52 | 0.5074 | ||
| Very/somewhat hard | 7.41% | 5.77% | |||
| Fairly easy | 29.63% | 25.00% | |||
| Very easy | 62.69 | 69.23% | |||
| (Controlling baseline)∥ | 0.1757 | ||||
| Understands how to take ART during study (exit)† | 54 | 94.44% | 52 | 90.38% | 0.4289 |
| (Controlling baseline)‡ | 0.6431 | ||||
| Has a case manager (exit)† | 59 | 59.32% | 57 | 45.61% | 0.1394 |
| (Controlling baseline)‡ | 0.9572 | ||||
| Satisfaction with medical care* | 51 | 0.29 (1.66) | 51 | −0.06 (1.58) | 0.2812 |
| Trust in provider* | 49 | −0.20 (2.41) | 50 | −0.14 (3.08) | 0.6514 |
| Coping scale* | |||||
| Positive | 49 | −0.55 (3.34) | 52 | −1.18 (3.28) | 0.1462 |
| Avoidant | 49 | −2.33 (3.05) | 52 | −1.00 (2.80) | 0.0659 |
| Information seeking | 49 | −0.51 (1.82) | 52 | −0.92 (2.08) | 0.5142 |
| Perceived stress* | 49 | −1.96 (3.37) | 52 | −1.00 (3.73) | 0.3610 |
Wilcoxon rank sum.
Chi-square.
Stratified Mantel-Haenszel χ2.
Mantel-Haenszel row mean score.
Stratified Mantel-Haenszel row mean score.
For 7 of 9 measures (Table 3), a statistically significantly greater proportion of those in the MI group reported carrying out behaviors related to improving adherence (P < 0.05) such as setting a larger number of goals and strategies (particularly strategies related to medication taking).
TABLE 3.
Characteristics of the Behavior Change Process by Treatment Group
| Variables | Treatment
|
P | |||
|---|---|---|---|---|---|
| Intervention
|
Control
|
||||
| n | Mean (SD) | n | Mean (SD) | ||
| Number of goals set* | 49 | 1.73 (1.47) | 48 | 1.02 (1.14) | 0.0149 |
| % with >1 goal set | 73.47% | 56.25% | |||
| Number of strategies set* | 49 | 1.59 (1.38) | 48 | 0.90 (1.17) | 0.0085 |
| % with >1 strategies set | 69.39% | 47.92% | |||
| Number of strategies that helped* | 49 | 1.24 (1.16) | 48 | 0.88 (1.16) | 0.0601 |
| % with >1 strategy that helped | 69.39% | 47.92% | |||
|
| |||||
| n | Proportion | n | Proportion | P | |
|
| |||||
| Proportion who liked having someone to talk with/listen to them† | 49 | 65.31% | 48 | 41.67% | 0.0196 |
| Proportion who set any goals† | 49 | 73.47% | 48 | 56.25% | 0.0756 |
| Proportion who used a medication-related strategy† | 49 | 38.78% | 48 | 14.58% | 0.0072 |
| Proportion who set NO strategies† | 49 | 30.61% | 48 | 52.08% | 0.0317 |
| Proportion who felt that support helped† | 49 | 46.94% | 48 | 27.08% | 0.0430 |
| The proportion who felt that nothing helped† | 49 | 30.61% | 48 | 52.08% | 0.0317 |
Wilcoxon rank sum test.
χ2 test.
DISCUSSION
We sought to implement and test an MI-based intervention to improve adherence among a group of HIV-infected patients failing their current treatment regimen. The theory-based28-36 MI intervention we tested had been evaluated previously for feasibility and acceptability to our clinic population.36 The interventionists had extensive training in MI skills and technique. In a prior publication, we demonstrated our ability to provide high-quality MI,38 and in this study, we carried out a number of steps to ensure its quality and fidelity. The statistically significant differences in process measures between the 2 treatment regimens, such as the number of goals set and number of strategies used to achieve goals, support the premise that participants were engaged and active in the intervention. ART adherence improved on average in the intervention group and decreased in the control group. The decrease in control group adherence is consistent with other studies showing that medication adherence decays over time.59,60 In spite of the trends we saw, however, we did not definitively demonstrate the efficacy of the MI-based intervention at 12 weeks.
Consistent with our conceptual model,28,36 among those who received the intervention, we observed greater improvements for the control group in mediating variables related to the enhancement of both motivation (attitudes toward medications) and self-efficacy (coping style and perceived medication access). As with other studies of medication self-management programs, both coping, skills development, and enhancing access to resources facilitated self-management.61,62 Greater improvement in the MI group’s abilities to get their prescriptions filled likely occurred because of the counselor helping clients develop strategies for accessing their medications. These changes in attitudes, coping, and perceived access to care are probably related to intervention patients’ greater improvements in adherence during the study. On the other hand, we were surprised to find that patients in the intervention group decreased their levels of perceived social support. Possibly, support offered by the MI counselor reduced patients’ needs for additional support during the time they saw the counselor.
Despite the great need for adherence interventions, few studies have provided definitive evidence for the efficacy of specific interventions to improve and support ART adherence.2,14,22,23,52-54 In a recent review of 11 ART adherence interventions, Fogarty et al reported mixed results.2 One psychoeducational intervention by Tuldra et al resulted in a higher self-reported adherence level and lower viral load in the experimental group (94%) compared with controls (69%) in the “as treated” but not “intent-to-treat” analysis, but only after 6 months of treatment and follow-up.14 Others found a significant effect on self-reported adherence of a multidisciplinary team-delivered educational intervention at 6 but not 12 or 18 months for patients receiving an adherence education program.52,53 Weber et al, in a trial of a cognitive intervention among 60 HIV-infected patients with undetectable (<50 copies/mL) viral loads found that although no differences existed in mean electronically measured adherence levels, 70% of patients in the intervention group had >95% adherence compared with only 50% in the standard care group.54 Safren et al (n = 70) showed that patients receiving a paging reminder system tended to have greater improvements in adherence from baseline at 12 weeks than did controls; however, adherence in both groups was poor.58
Similarly, in our study, although those in the treatment group improved more over time, both groups had poor adherence. This finding may partly reflect our study population: most patients had already failed at least one regimen, and hence, they may have responded less readily to an intervention. This possibility underscores the importance of establishing effective adherence strategies early in therapy. Alternatively, the participants in this study may have faced challenges to adherence particularly difficult to overcome regardless of when an intervention is initiated. Our findings underscore the difficulty in developing interventions to change a complex behavior like ART medication taking. Furthermore, ART adherence is not only complex but lifelong. Some studies have shown the need to administer adherence interventions for a longer period of time (some >6 months) before an effect is seen,14 and it may be that our intervention was not administered long enough or frequently enough to demonstrate its full effect. The pattern of adherence that we found showed peaks for both groups at weeks 5 and 10 (with much greater peaks for the intervention group) and, by week 12, the difference between the 2 groups had diminished. It is interesting to note that the peaks in adherence followed exposure to the MI and were consonant with receipt of the booster letter by the intervention group. These observations are consistent with prior studies demonstrating decay of adherence over time without an intervention1,56,57,61 but suggest the need for continuous, ongoing interventions to maintain behavior change. Although ART adherence is a lifelong process, because it is costly and challenging to change, we chose to administer our intervention and evaluate its effects for only 12 weeks in this first trial of the PACT intervention. Our findings imply that future interventions need to be more intensive, longer lasting, and tested in larger study populations.
Our study has several limitations. First, 33% of patients we approached declined to participate. This level of nonparticipation has the potential to reduce the external validity of our study, although it was reassuring that those who declined to participate were similar to participants on demographic characteristics. It is difficult to predict in what other ways nonparticipants might have differed from participants. Nonparticipants most often cited time constraints and lack of transportation as reasons they declined participation. Such nonparticipants might also face greater barriers to adherence. Alternatively, patients decline participation because they do not perceive having a problem adhering and, therefore, respond less than do participants to an intervention. Second, some participants did not complete the study; however, 83% did complete it, and we found no statistically significant differences in dropouts by treatment group. Third, although we used a previously validated, objective assessment of adherence, measuring adherence remains a challenge. Although some measurement error may exist, using an objective adherence measure, we would expect this error to occur similarly in both groups, introducing only a bias toward the null. We did not demonstrate any statistically significant effect of the intervention on plasma viral load. Because many of our participants had previously failed therapy, this finding is likely explained by preexisting virologic resistance to ART. Finally, our sample size did not provide as much power as a larger study would have to detect small statistically significant differences between treatment groups.
Despite these limitations, although not definitive, this study provides some evidence that MI offers an effective approach to improving adherence. A study able to build MI into the intervention early for longer than 3 months and for a larger number of patients might show more of an effect where this one was unable to.
Acknowledgments
The authors thank Lily Gilmore, Monica Adamian, and Lara Shain for their technical and administrative assistance.
Dr Golin’s salary and this study were supported by NIMH grant no. K23 MH01862-01. We acknowledge the support of NIH #RR00046, #P30 AI050410, and #DK56350-01.
APPENDIX 1
*The calibration models can be expressed as:
where Yi is a w by 1 vector of eDEMS values, and w, ranging from 1 to 3, is the number of 4-week blocks available for the ith patient. Xi is a w by 3 matrix with the following columns: an intercept constant, time (4-week block), and Pill Count (PC) or self-reported adherence (INT) value. γi is the error term with a mean of 0 and covariance structure Σi. This covariance structure takes into account both intrapatient correlation and random variation across patients.
References
- 1.Liu HH, Golin CG, Miller L, et al. A comparison of multiple measures of adherence to HIV protease inhibitors. Ann Intern Med. 2001;134:968–977. doi: 10.7326/0003-4819-134-10-200105150-00011. [DOI] [PubMed] [Google Scholar]
- 2.Fogarty L, Roter D, Larson S, et al. Patient adherence to HIV medication regimens: a review of published and abstract reports. Patient Educ Couns. 2002;46(2):93–108. doi: 10.1016/s0738-3991(01)00219-1. [DOI] [PubMed] [Google Scholar]
- 3.Altice F, Friedland G. The era of adherence to HIV therapy. Ann Intern Med. 1998;129(6):503–505. doi: 10.7326/0003-4819-129-6-199809150-00015. [DOI] [PubMed] [Google Scholar]
- 4.Wainberg M, Friedland G. Public health implications of antiretroviral therapy and HIV resistance. JAMA. 1998;279(24):1977–1983. doi: 10.1001/jama.279.24.1977. [DOI] [PubMed] [Google Scholar]
- 5.Bangsberg DR, Hecht FM, Charlebois ED, et al. Adherence to protease inhibitors, HIV-1 viral load, and development of drug resistance in an indigent population. AIDS. 2000;14(4):357–366. doi: 10.1097/00002030-200003100-00008. [DOI] [PubMed] [Google Scholar]
- 6.Weidle PJ, Ganera CE, Irwin KL, et al. Adherence to antiretroviral medications in an inner-city population. JAIDS. 1999;22:498–502. doi: 10.1097/00126334-199912150-00011. [DOI] [PubMed] [Google Scholar]
- 7.Holzemer W, Henry S, Portillo CJ, et al. The Client Adherence Profiling-Intervention Tailoring (CAP-IT) intervention for enhancing adherence to HIV/AIDS medications: a pilot study. J Assoc Nurses AIDS Care. 2000;11(1):36–44. doi: 10.1016/s1055-3290(06)60420-2. [DOI] [PubMed] [Google Scholar]
- 8.Murphy D, Roberts K, Martin DJ, et al. Barriers to antiretroviral adherence among HIV-Infected adults. AIDS Patient Care. 2000;14(1):47–58. doi: 10.1089/108729100318127. [DOI] [PubMed] [Google Scholar]
- 9.Chesney M, Ickovics J, Chambers D, et al. Self-reported adherence to antiretroviral medications among participants in HIV clinical trials: the AACTG adherence Instruments. AIDS Care. 2000;12(3):255–266. doi: 10.1080/09540120050042891. [DOI] [PubMed] [Google Scholar]
- 10.Murri R, Ammassari A, Gallicano K, et al. Patient-reported nonadherence to HAART is related to protease inhibitor levels. JAIDS. 2000;24:123–128. doi: 10.1097/00126334-200006010-00006. [DOI] [PubMed] [Google Scholar]
- 11.Catz S, Kelly J, Bogart L, et al. Patterns, correlates, and barriers to medication adherence among persons prescribed new treatments for HIV disease. Health Psychol. 2000;19(2):124–133. [PubMed] [Google Scholar]
- 12.Holzemer WL, Corless IB, Nokes KM, et al. Predictors of self-reported adherence in persons living with HIV disease. AIDS Patient Care STDs. 1999;13(3):185–197. doi: 10.1089/apc.1999.13.185. [DOI] [PubMed] [Google Scholar]
- 13.Kalichman SC, Ramachandran B, Catz S. Adherence to combination antiretroviral therapies in HIV patients of low health literacy. J Gen Intern Med. 1999;14:267–273. doi: 10.1046/j.1525-1497.1999.00334.x. [DOI] [PMC free article] [PubMed] [Google Scholar]
- 14.Tuldra A, Fumaz C, Ferrer MJ, et al. Prospective randomized two-arm controlled study to determine the efficacy of a specific intervention to improve long-term adherence to HAART. JAIDS. 2000;25:221–228. doi: 10.1097/00126334-200011010-00003. [DOI] [PubMed] [Google Scholar]
- 15.Gifford A, Bormann J, Shively M, et al. Predictors of self-reported adherence and plasma HIV concentration in patients on multidrug antiretroviral regimens. JAIDS. 2000;23:386–395. doi: 10.1097/00126334-200004150-00005. [DOI] [PubMed] [Google Scholar]
- 16.Roberts KJ. Barriers to and facilitators of HIV-positive patients’ adherence to antiretroviral treatment regimens. AIDS Patient Care STDS. 2000;14:155–168. doi: 10.1089/108729100317948. [DOI] [PubMed] [Google Scholar]
- 17.Gordillo V, del Amo J, Soriano V, et al. Sociodemographic and psychological variables influencing adherence to antiretroviral therapy. AIDS. 1999;13:1763–1769. doi: 10.1097/00002030-199909100-00021. [DOI] [PubMed] [Google Scholar]
- 18.Proctor VE, Tesfa A, Tompkins DC. Barriers to adherence to highly active antiretroviral therapy as expressed by people living with HIV/AIDS. AIDS Patient Care STDS. 1999;13:535–544. doi: 10.1089/apc.1999.13.535. [DOI] [PubMed] [Google Scholar]
- 19.Meystre-Agustoni G, Dubois-Arber F, Cochand P, et al. Antiretroviral therapies from the patient’s perspective. AIDS Care. 12(6):17–721. doi: 10.1080/09540120020014255. [DOI] [PubMed] [Google Scholar]
- 20.Turner B, Newschaffer C, Zhang D, et al. Antiretroviral use and pharmacy-based measurement of adherence in postpartum HIV infected women. Med Care. 2000;38(9):911–925. doi: 10.1097/00005650-200009000-00005. [DOI] [PubMed] [Google Scholar]
- 21.Golin CE, Lui H, Hays R, et al. A prospective study of predictors of adherence to combination antiretroviral medication. J Gen Intern Med. 2002;17(9):1–10. doi: 10.1046/j.1525-1497.2002.11214.x. [DOI] [PMC free article] [PubMed] [Google Scholar]
- 22.Simoni JM, Frick PA, Pantalone DW, et al. Antiretroviral adherence interventions: a review of current literature and ongoing studies. Top HIV Med. 2003;11(6):185–198. [PubMed] [Google Scholar]
- 23.Haddad M, Inch C, Glazier RH, et al. Patient Support and Education for Promoting Adherence to Highly Active Antiretroviral Therapy for HIV/AIDS (Cochrane Review) Cochrane Database System Review. 2002 doi: 10.1002/14651858.CD001442. CD001442. [DOI] [PubMed] [Google Scholar]
- 24.Haynes RB, Taylor DW, Sackett DL. Compliance in Health Care. Baltimore: Johns Hopkins University Press; 1979. [Google Scholar]
- 25.Roter DL, Hall HA, Merisca R, et al. Effectiveness of interventions to improve patient compliance: A meta-analysis. Med Care. 1998;36:1138–1161. doi: 10.1097/00005650-199808000-00004. [DOI] [PubMed] [Google Scholar]
- 26.Golin CE, DiMatteo MR, Gelberg L. The role of patient participation in the doctor visit. Implications for adherence to diabetes care. Diabetes Care. 1996;19:1153–1164. doi: 10.2337/diacare.19.10.1153. [DOI] [PubMed] [Google Scholar]
- 27.Greenfield S, Kaplan SH, Ware JE, Jr, et al. Patients’ participation in medical care: effects on blood sugar control and quality of life in diabetes. J Gen Intern Med. 1988:448–457. doi: 10.1007/BF02595921. [DOI] [PubMed] [Google Scholar]
- 28.Miller WR, Rollnick S. Motivational Interviewing: Preparing People for Change. 2. New York: Guilford Press; 2002. [Google Scholar]
- 29.Emmons KM, Rollnick S. Motivational interviewing in health care settings. Opportunities and limitations. Am J Prev Med. 2001;20(1):68–74. doi: 10.1016/s0749-3797(00)00254-3. [DOI] [PubMed] [Google Scholar]
- 30.Harding R, Dockrell MJ, Dockrell J, et al. Motivational interviewing for HIV risk reduction among gay men in commercial and public sex settings. AIDS Care. 2001;13:493–501. doi: 10.1080/09540120120058021. [DOI] [PubMed] [Google Scholar]
- 31.Resnicow K, Jackson A, Wang T, et al. A motivational interviewing intervention to increase fruit and vegetable intake through Black churches: results of the Eat for Life trial. Am J Public Health. 2001;91(10):1686–1693. doi: 10.2105/ajph.91.10.1686. [DOI] [PMC free article] [PubMed] [Google Scholar]
- 32.Thevos AK, Quick RE, Yanduli V. Motivational interviewing enhances the adoption of water disinfection practices in Zambia. Health Promot Int. 2000;15(3):207–214. [Google Scholar]
- 33.Kemp R, Kirov G, Everitt B, et al. Randomised controlled trial of compliance therapy. 18-month follow-up. Br J Psychiatry. 1998;172:413–419. doi: 10.1192/bjp.172.5.413. [DOI] [PubMed] [Google Scholar]
- 34.Burke BL, Arkowitz H, Menchola M. The efficacy of motivational interviewing: a meta-analysis of controlled clinical trials. J Consult Clin Psychol. 2003;71(5):843–861. doi: 10.1037/0022-006X.71.5.843. [DOI] [PubMed] [Google Scholar]
- 35.Dunn C, Deroo L, Rivara FP. The use of brief interventions adapted from MI across behavioral domains: a systematic review. Addiction. 2001;96:1725–1742. doi: 10.1046/j.1360-0443.2001.961217253.x. [DOI] [PubMed] [Google Scholar]
- 36.Adamian MS, Golin CE, Shain LS, et al. Brief motivational interviewing to improve adherence to antiretroviral therapy: development and qualitative pilot assessment of an intervention. AIDS Patient Care STDS. 2004;18(4):229–238. doi: 10.1089/108729104323038900. [DOI] [PubMed] [Google Scholar]
- 37.DiIorio C, Resnicow K, McDonnell M, et al. Using motivational interviewing to promote adherence to antiretroviral medications: a pilot study. J Assoc Nurses AIDS Care. 2003;14(2):52–62. doi: 10.1177/1055329002250996. [DOI] [PubMed] [Google Scholar]
- 38.Thrasher A, Golin CE, Earp JA, et al. Motivational Interviewing to Improve Antiretroviral Adherence: The Role of Quality Assessment. Patient Educ Couns. 2005 Jul 13; doi: 10.1016/j.pec.2005.06.003. [DOI] [PubMed] [Google Scholar]
- 39.Britt E, Hudson SM, Blampied NM. Motivational interviewing in health settings: a review. Patient Educ Couns. 2004;53(2):147–155. doi: 10.1016/S0738-3991(03)00141-1. [DOI] [PubMed] [Google Scholar]
- 40.Deleted in proof.
- 41.Bandura A. self-efficiency: toward a unifying theory of behavioral change. Psychol Rev. 1977;84:191–215. doi: 10.1037//0033-295x.84.2.191. [DOI] [PubMed] [Google Scholar]
- 42.Anderson L. Health care communication and selected psychological adherence in diabetes management. Diabetes Care. 1990;13:66–67. [Google Scholar]
- 43.Macharia WM, Leon G, Rowe B, et al. An overview of interventions to improve compliance with appointment keeping for medical services. JAMA. 1992;267:1813–1817. [PubMed] [Google Scholar]
- 44.Wenger N, Gifford A, Liu H, et al. Patient characteristics and attitudes associated with antiretroviral (AR) adherence. 6th Conference on Retroviruses and Opportunistic Infections; 1999. [Google Scholar]
- 45.Fleishman JA, Sherbourne CD, Crystal S, et al. Coping, conflictual social interactions, social support and mood among HIV-infected persons. Am J Com Psych. 2000;28:421–453. doi: 10.1023/a:1005132430171. [DOI] [PubMed] [Google Scholar]
- 46.Cunningham WE, Markson LE, Andersen RM, et al. Prevalence and predictors of highly active antiretroviral therapy use in patients with HIV infection in the United States. HCSUS Consortium. JAIDS. 2000;25:115–123. doi: 10.1097/00042560-200010010-00005. [DOI] [PubMed] [Google Scholar]
- 47.Hays RD, Shaul JA, Williams VSL, et al. Psychometric properties of the CAHPSTM 1.0 Survey measures. Consumer Assessment of Health Plans Study. Med Care. 1999;37:MS22–MS31. doi: 10.1097/00005650-199903001-00003. [DOI] [PubMed] [Google Scholar]
- 48.Kao AC, Green DC, Davis NA, et al. Patients’ trust in their physicians: effects of choice, continuity, and payment method. J Gen Intern Med. 1998;13:681–686. doi: 10.1046/j.1525-1497.1998.00204.x. [DOI] [PMC free article] [PubMed] [Google Scholar]
- 49.Kaplan SH, Greenfield S, Gandek B, et al. Characteristics of physicians with participatory decision-making styles. Ann Intern Med. 1996;124(5):497–504. doi: 10.7326/0003-4819-124-5-199603010-00007. [DOI] [PubMed] [Google Scholar]
- 50.Cohen S, Kamarck T, Mermelstein R. A global measure of perceived stress. J Health Soc Behav. 1983;24:385–396. [PubMed] [Google Scholar]
- 51.Sherbourne CD, Stewart AL. The MOS social support survey. Soc Sci Med. 1991;32(6):705–714. doi: 10.1016/0277-9536(91)90150-b. [DOI] [PubMed] [Google Scholar]
- 52.Levy RW, Rayner CR, Fairley CK, et al. Melbourne Adherence Group. Multidisciplinary HIV adherence intervention: a randomized study. AIDS Patient Care STDS. 2004 Dec;18(12):728–735. doi: 10.1089/apc.2004.18.728. [DOI] [PubMed] [Google Scholar]
- 53.Goujard C, Bernard N, Sohier N, et al. Impact of a patient education program on adherence to HIV medication: a randomized clinical trial. J Acquir Immune Defic Syndr. 2003 Oct 1;34(2):191–194. doi: 10.1097/00126334-200310010-00009. [DOI] [PubMed] [Google Scholar]
- 54.Weber R, Christen L, Christen S, et al. Swiss HIV Cohort Study. Effect of individual cognitive behaviour intervention on adherence to antiretroviral therapy: prospective randomized trial. Antivir Ther. 2004 Feb;9(1):85–95. [PubMed] [Google Scholar]
- 55.McCullagh P, Nelder JA. Generalized Linear Models. 2. London: Chapman & Hall; 1989. [Google Scholar]
- 56.Green LW. How physicians can improve patients’ participation and maintenance in self-care. West J Med. 1987;147:346–349. [PMC free article] [PubMed] [Google Scholar]
- 57.Cramer JA, Scheyer RD, Mattson RH. Compliance declines between clinic visits. Arch Intern Med. 1990;150:1509–1510. [PubMed] [Google Scholar]
- 58.Safren SA, Hendriksen ES, Desousa N, et al. Use of an on-line pager system to increase adherence to antiretroviral medications. AIDS Care. 2003 Dec;15:787–793. doi: 10.1080/09540120310001618630. [DOI] [PubMed] [Google Scholar]
- 59.Green LW. How physicians can improve patients’ participation and maintenance in self-care. West J Med. 1987;147:346–349. [PMC free article] [PubMed] [Google Scholar]
- 60.Cramer JA, Scheyer RD, Mattson RH. Compliance declines between clinic visits. Arch Intern Med. 1990;150:1509–1510. [PubMed] [Google Scholar]
- 61.Fisher EB, Brownson CA, O’toole ML, et al. Ecological approaches to self-management: the case of diabetes. Am J Public Health. 2005;5:1523–1535. doi: 10.2105/AJPH.2005.066084. [DOI] [PMC free article] [PubMed] [Google Scholar]
- 62.Currie GP, Devereux GS, Lee DK, et al. Recent developments in asthma management. BMJ. 2005 Mar 12;330(7491):585–589. doi: 10.1136/bmj.330.7491.585. [DOI] [PMC free article] [PubMed] [Google Scholar]