

Abstract
We present a fully automatic computational vascular morphometry (CVM) approach for the clinical assessment of pulmonary vascular disease (PVD). The approach is based on the automatic extraction of the lung intraparenchymal vasculature using scale-space particles. Based on the detected features, we developed a set of image-based biomarkers for the assessment of the disease using the vessel radii estimation provided by the particle’s scale. The biomarkers are based on the interrelation between vessel cross-section area and blood volume. We validate our vascular extraction method using simulated data with different complexity and we present results in 2,500 CT scans with different degrees of chronic obstructive pulmonary disease (COPD) severity. Results indicate that our CVM pipeline may track vascular remodeling present in COPD and it can be used in further clinical studies to assess the involvement of PVD in patient populations.
Keywords: Scale-space, vessel segmentation, biomarkers, pulmonary vascular disease, COPD, CT
1. INTRODUCTION
It is estimated that 30 to 70% of subjects with advanced chronic obstructive pulmonary disease (COPD) have clinically significant pulmonary vascular disease (PVD). PVD is in part mediated by vascular remodeling including inflammation and endothelial dysfunction present even in smokers with normal lung function [1]. Although histopathology can be used to assess vascular remodeling in small sample sizes, volumetric computed tomography (CT) offers an unique opportunity to explore PVD based on vascular morphometry.
Under a computation vascular morphometry paradigm, the interplay between vessel cross-sectional area, blood volume and vessel lengthening are factors that can help to characterize PVD. Multiple approaches have been introduce for the extraction of pulmonary vasculature based on either features from the Hessian [2, 3, 4] or waterfront propagation [5]. Although these techniques show acceptable performance they require additional steps for the quantification of vessel diameter. Additionally, accurate tree extraction for smaller vessels and robustness to noise remain as important issues. Moreover, the evaluation of vascular extraction algorithms remain a difficult challenge due to the complexity of the tree and the lack of labeled volumes.
In this paper, we present a technique for automatically extracting vessel location and caliber based on scale-space particles. Scale-space particles leverage the well-known theory of linear scale-space to localize features described by the Hessian. Unlike previous approaches, our technique has the unique ability to directly sample the vessel centerline and provide vessel size by exploiting the relationship between scale and physical radius. This is achieved in a computationally efficient framework inherent in the particle system. We exhaustively evaluate our algorithm’s performance using simulated phantoms that exhibit complexity resembling real vasculature and thus demonstrate its effectiveness for CVM. Another major contribution of this work is also the introduction of a set of biomarkers for the assessment of PVD that are based only on information provided by scale-space particles.
2. METHODS
We start first by introducing the scale-space particle approach. We then derive the relationship between scale and vessel radii that can be used to obtain physical morphometric measures. Finally, we present the biomarkers that have been developed for the assessment of PVD.
2.1. Vessel detection by scale-space particles
Our vascular morphometry pipeline is based on scale-space particles [6]. Scale-space particles offer the possibility of efficiently exploring an image region for features, in our case vessels, that can be described by the Hessian. We detect vessels as intensity ridge lines, using the ridge line definition as a point where the gradient is orthogonal to the two Hessian eigenvectors associated with the smallest (most negative) eigenvalues λ3 < λ2. Within the context of our particle system, points are moved onto ridge lines by repeated Newton optimization, which is completed at every energy-minimizing iteration of the particle system. To ensure that vessels of all radii are detected, we initialize the particle system with a uniform dense sampling of particles across the four-dimensional domain (three spatial axes and one scale axis).
The particle system solution is computed iteratively to minimize the system energy, which is a sum of inter-particle energy and energy associated with a particle’s location within the image domain. The inter-particle energy is a quartic polynomial with a tunable potential well, chosen to quickly induce regular sampling. The potential well also serves the purpose of making particle population control (adding particles to fill gaps in the vessel sampling) part of the same over-all energy minimization that moves particles into a uniform sampling. Particles are removed when the strength of the ridge line feature (as quantified by the middle Hessian eigenvalue λ2) falls below a pre-specified threshold that depends on image contrast. Following the general guidelines of [6], particle system computation proceeds in three steps: densely and uniformly sampling the two-dimensional manifold swept out in scale-space by the ridge lines, moving points to the scale of maximal feature strength, and then redistributing points to create a uniform vessel sampling.
2.2. Vessel sizing
Vessel radius can be analytically related to the scale by finding the value of σ that maximizes the multi-scale strength function, R(σ) = σ2λ2(σ), at the vessel center. Assuming that the vessel cross-section can be modeled as a disk with constant intensities inside and outside and that the CT point spread function behaves as a Gaussian of standard deviation σ0, the signal intensity is defined by the convolution integral as
| (1) |
with . Let us denote ,
| (2) |
where . Since ,
| (3) |
where . At the center of the disk, the second order derivative in any direction will also be equal to λ2, so
| (4) |
since is antisymmetric and
| (5) |
The term can be easily computed with a change of variable and is equal to , so which has a maximum at . Since our model integrates an initial Gaussian convolution of σ0, we finally have the following relationship between the detected scale, σ, and the radius of the structure at the center of the cross-section given by
| (6) |
2.3 Biomarkers Computation
Each particle has a given cylindrical volume corresponding to the cross sectional area defined by its scale and the length of the sampling given by the location of the potential well. From this, the distribution profile of blood volume as a function of the vessel cross sectional area can be computed and the blood volume for vessels less than 5 mm2 (BV5) and larger than 10 mm2 (BV10) can be calculated by integration of the distribution profile. The limits 5 mm2 and 10 mm2 define the transition between distal and proximal vasculature as previously defined in the literature [7]. Those quantities normalized by the total intraparenchynal blood volume can serve as CT-based biomarkers of vascular remodeling.
3. RESULTS
Evaluation framework
We designed two experiments to assess how accurate we can capture and quantify the vascular tree morphometry. The first experiment aimed at testing the validity of eq. (6) using a circular cone phantom with a linear radius ramp from 0 pixels to 8 pixel units simulated,for different scanner models (Fig. 1a). The scanner point spread function (PSF) was simulated by means of a convolution with a Gaussian function with standard deviation σb and noise was simulated as additive Gaussian noise with standard deviation σn. The background was set to −800 HU and the cone density to 100 HU to capture the nominal range of background/vasculature density in the lung. The cone was sampled in a high resolution grid and down-sampled with a windowed sinc resampling kernel into a 51×51×340 grid.
Fig. 1.

Relative estimation error for radius estimation for a cone phantom of variable radius. (a) Slide for the cone phantom for σb = 0 and σn = 200 pixels. (b) Relative estimation error for different PSF. (d) Relative error for different noise levels and σb = 0.
The second experiment was based on the Vascusynth simulator [8]. Vascusynth was used to generate trees of multiple complexities by changing the number of terminal nodes from 5 to 1000 within a volume of 100×100×100 voxels of 0.6 mm. Lung parenchyma was simulated by means of a Gaussian process with mean −800 HU and standard deviation of 150HU spatially correlated with a Gaussian kernel with std 1.5 pixel. The vessel maximum density was set to 100 HU. Gaussian noise of std=20HU was added to the final image to account for the noise levels typically encounter in high-dose CT scans. The segmentation quality was assessed by comparing the results with the graph tree produced by Vascusynth. Particle points that were less than 0.6 mm to the closest ground truth point were true positive results, otherwise the points were marked as false positives. False negative points were computed by finding the ground truth points that did not have a particle point at a distance less than 0.6 mm.
For all the experiments, scale-space particles were run with the same experimentally selected parameters. The threshold on λ2 was −20, the number of iterations for each step were 80, 20 and 60 respectively. The energy blending parameters as defined in [6] were α = 1, β = 0.7 for step 1, α = 0, β = 0.5 for step 2 and α = 0.25 and β = 0.25 for step 3. These values achieved the desired repulsion/attraction behavior for each step. For all cases, the scale-space particles were initialized by seeding on a initial mask obtained by an upper threshold of the original image with value −500HU.
Radius estimation validation
Scale-space particles were run in the simulated cone volumes and the relative estimation error between the real radius at the location of the particle (given by its z-coordinate) and the estimated radius based on eq. (6) was computed for different scanning scenarios (Fig. 1). Fig. 1b shows that the error has two linear sections with a breaking point corresponding to the resolution of the CT scanner given by the width of the PSF. Even for the ideal imaging system, σb = 0, there is an inflection point at 1 pixel radius reflecting the Nyquist limit. Note that particles were not places at cone sections with low radius as σb increases suggesting the limited capturing range as the PSF is smoother and smoother. Fig. 1c shows the error for different noise levels. It is interesting to note the robustness of scale-particles to Gaussian noise both in radius estimation and capturing range.
Geometry extraction validation
Table 1 shows the accuracy, precision, sensitivity and specificity of scale-space particles for vascular tree segmentation as the geometry of the tree increases in complexity as depicted in Fig. 2. The results show that our method consistently has a specificity and precision higher than 95% for all complexity levels. Accuracy and sensitivity decreases as the number of terminal nodes is greater than 300 in part due to the increment of smaller vessels that are harder to extract (the mean tree radius decrease from 2.41mm for 5 terminal nodes to 0.6 mm for 1000 terminal nodes). Even though, for a highly complex tree with 1000 terminal nodes, our method’s accuracy still remains at 77%. It also worth noting that the computational cost of our method is in the order of minutes for a volume of 100×100×100 and the execution time has a logarithm relation with tree complexity.
Table 1.
Geometry extraction validation results using vascular trees of increasing complexity. We show results for 9 out of the 15 vascular trees that were generated. Mean and std were computed using all volumes.
| #Nodes | True Pos. % | False Pos. % | True Neg. % | False Neg. % | Accur. % | Prec. % | Sensit. % | Specif. % | Time (s.) † |
|---|---|---|---|---|---|---|---|---|---|
| 5 | 95.59 | 4.41 | 95.74 | 4.26 | 95.67 | 95.59 | 95.74 | 95.60 | 41 |
| 10 | 95.75 | 4.25 | 96.77 | 3.23 | 96.26 | 95.75 | 96.74 | 95.80 | 57 |
| 50 | 96.15 | 3.85 | 96.91 | 3.09 | 96.53 | 96.15 | 96.88 | 96.18 | 178 |
| 100 | 96.84 | 3.16 | 93.16 | 6.84 | 95.00 | 96.84 | 93.40 | 96.72 | 248 |
| 200 | 98.76 | 1.24 | 84.93 | 15.07 | 91.84 | 98.76 | 86.76 | 98.56 | 320 |
| 400 | 98.16 | 1.84 | 73.26 | 26.74 | 85.71 | 98.16 | 78.59 | 97.55 | 375 |
| 600 | 98.11 | 1.89 | 66.03 | 33.97 | 82.07 | 98.11 | 74.28 | 97.21 | 380 |
| 800 | 98.72 | 1.28 | 61.38 | 38.62 | 80.05 | 98.72 | 71.88 | 97.95 | 409 |
| 1000 | 97.89 | 2.11 | 57.73 | 42.27 | 77.81 | 97.89 | 69.84 | 96.48 | 449 |
|
| |||||||||
| mean(std) | 97.5(1.1) | 2.5(1.1) | 79.5(15.4) | 20.5(15.4) | 88.5(7.3) | 97.5(1.1) | 84.0(10.9) | 97.0(0.8) | 292(140) |
Intel Core 2 Duo 2.8 GHz.
Fig. 2.
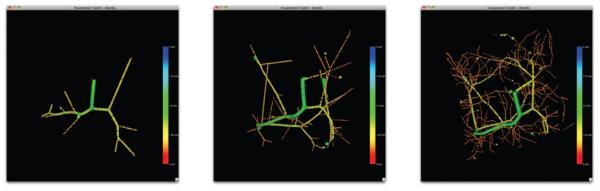
Particles extracted for vascular trees with increasing complexity: (a) 10, (b) 100 and (c) 1000 terminal nodes respectively.
Real cases
The proposed method has been used to extract the vasculature of 2,500 CT scans from the COPDGene cohort. The CT scans were acquired at inspiration with a dose level of 200 mAs and a smooth reconstruction kernel (B31f and Bone for Siemens and GE scans respectively). For each case, the distribution of blood volume with respect to the vessel cross sectional areas was computed using the estimated radius. Fig. 3 shows the result for two extreme cases corresponding to smokers with different emphysema severity. Fig. 4a-b shows the intraparenchymal blood volume distribution for those same cases. It is worth noting the shift in the blood volume profile for the selected cases suggesting that proximal vasculature dilates to compensate for the increase in resistance. This can be corroborated in Fig. 4c that shows the relation between BV10/TBV and BV5/TBV across the 2,500 cases analyzed.
Fig. 3.

Figures A and D are coronal images of a subject with minimal (A) and severe (D) emphysema. Figures B and E illustrate the scale-space particles based segmentation of the vasculature color coded by vessel caliber (blue larger, red smaller).
Fig. 4.
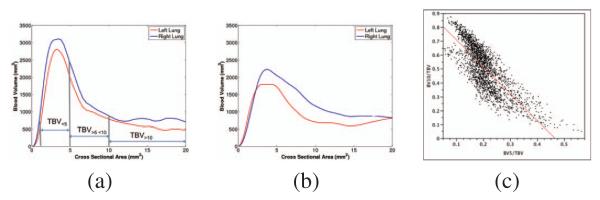
Examples of the distribution of intraparenchymal blood volume (TBV) as a function of vessel caliber for the cases shown in Fig. 3 corresponding to subject with minimal disease (a) and severe emphysema (b). It worth noting the decrease of blood volume for small blood vessels (CSA<5mm) due to vessel pruning and the remodeling of larger vessels (CSA>10mm). (c) Relation between BV10/TBV and BV5/TBV for the 2,500 analyzed cases showing the distribution of patients with high BV10/TBV in relation to smaller BV5/TBV indicative of PVD.
4. DISCUSSION AND CONCLUSIONS
We have presented an algorithm for the extraction and quantification of the pulmonary vasculature that can be used within a computational vascular morphometry framework for the study of pulmonary vascular disease. Scale-space particles appear to be a suitable strategy for this task as supported by our results. The radius estimation provided by the scale estimation holds for vessel sizes that are larger than the width of the PSF under Gaussian assumptions. The proposed method is also robust against Gaussian noise for the SNR range that can be typically found in clinical CT. The accuracy and precision of our method depend on the tree complexity and are bounded by the CT resolution. Further analysis includes the validation of this technique with real data and the relation of the proposed biomarkers with physiological markers of PVD and clinical outcomes.
Acknowledgments
This work has been supported by grants from the National Institutes of Health (K25 HL104085 to Dr. San José Estépar; K23 HL089353, to Dr. Wahsko; U01 HL089897 and U01 HL089856, to COPDGene). The authors would like to thank to all the COPDGene Investigators for their contributions and the data that was used in the paper.
REFERENCES
- [1].Peinado VI, et al. Endothelial dysfunction in pulmonary arteries of patients with mild COPD. The American journal of physiology. 1998 Jun;274(6 Pt 1):L908–13. doi: 10.1152/ajplung.1998.274.6.L908. [DOI] [PubMed] [Google Scholar]
- [2].Shikata H, et al. Automated segmentation of pulmonary vascular tree from 3d ct images. Proceedings of SPIE. 2004;5369:107. [Google Scholar]
- [3].Agam G, et al. Vessel tree reconstruction in thoracic ct scans with application to nodule detection. Medical Imaging, IEEE Transactions on. 2005;24(4):486–499. doi: 10.1109/tmi.2005.844167. [DOI] [PubMed] [Google Scholar]
- [4].van Dongen E, van Ginneken B. Automatic segmentation of pulmonary vasculature in thoracic CT scans with local thresholding and airway wall removal; Biomedical Imaging: From Nano to Macro, 2010 IEEE International Symposium on; 2010.pp. 668–671. [Google Scholar]
- [5].Gülsün M, Tek H. Robust vessel tree modeling. Medical Image Computing and Computer-Assisted Intervention-MICCAI. 2008;2008:602–611. doi: 10.1007/978-3-540-85988-8_72. [DOI] [PubMed] [Google Scholar]
- [6].Kindlmann GL, San José Estépar R, et al. Sampling and visualizing creases with scale-space particles. IEEE Trans. Visualization and Computer Graphics. 2009;15(6):1415–1424. doi: 10.1109/TVCG.2009.177. [DOI] [PMC free article] [PubMed] [Google Scholar]
- [7].Coche Emmanuel, et al. Peripheral pulmonary arteries: identification at multi-slice spiral CT with 3D reconstruction. European radiology. 2003 Apr.13(4):815–822. doi: 10.1007/s00330-002-1734-2. [DOI] [PubMed] [Google Scholar]
- [8].Hamarneh G, Jassi P. VascuSynth: simulating vascular trees for generating volumetric image data with ground-truth segmentation and tree analysis. Computerized medical imaging and graphics. 2010 Dec.34(8):605–616. doi: 10.1016/j.compmedimag.2010.06.002. [DOI] [PubMed] [Google Scholar]