Abstract
The biological functions of many enzymes are often coupled with significant conformational changes. The end states of these conformational changes can often be determined by X-ray crystallography. These X-ray structures are snapshots of the two extreme conformations in which the macromolecule exists, but the dynamic movements between the states are not easily visualized in a two-dimensional illustration. Here we have developed a new method to visualize macromolecular motions called a ViewMotions Rainbow diagram. These diagrams show the initial and final states overlaid along with approximately 30 intermediate structures calculated by linear interpolation of the backbone coordinates of the initial and final states. This group of structures is then spectrally colored from the initial structure in blue to the final structure in red. ViewMotions Rainbow diagrams provide the reader with a much easier way to understand the macromolecular motions using a single two-dimensional illustration. Since producing these diagrams requires a number of different software packages, we have setup the ViewMotions Web Server (http://viewmotions.bc.edu) to automatically generate these diagrams from two Protein Data Bank files or from the Database of Macromolecular Movements (http://molmovdb.org).
Keywords: Database of Macromolecular Movements, Sieve-fit, Structural alignment, Domain motions, Visualization
1. Introduction
Many enzymes undergo significant conformational changes during the course of their biological function. These conformational changes may be induced in a variety of ways including the binding of substrates, allosteric effectors, or by phosphorylation. The end states of these conformational changes can often be determined by X-ray crystallography or structural NMR. While these structures are snapshots of the two extreme conformations in which the macromolecule exists, the dynamic movements between the states are not easily visualized.
Krebs and Gerstein have developed the Internet accessible Database of Macromolecular Movements [1], which includes the Morph Server [2] that can be used to generate movies depicting the movement of a macromolecule from its initial to its final state. These movies are an excellent resource to visualize macromolecular motions; however, these molecular motions are much more difficult to visualize using a single diagram. A variety of methods to illustrate conformational changes have been employed. However, each of these two-dimensional representations lacks one important advantage of a movie depiction of the conformational change, which is to allow the reader to visualize the actual molecular motion. In order to solve this problem we have developed a new method to visualize the conformational changes of a protein in a two dimensional illustration. This new method uses a number of existing software packages to generate a series of intermediate structures, typically thirty, on the path between the initial and final conformations of the same protein. All of the structures are shown in a single image using a spectral color gradient to indicate the molecular motion. We have published a number of these ViewMotions Rainbow diagrams as an all-inclusive way to convey molecular motions [3–5]. However, the steps required to generate these diagrams are cumbersome, therefore we have developed a Web Server to allow the user to easily create ViewMotions Rainbow diagrams.
2. Computation methods
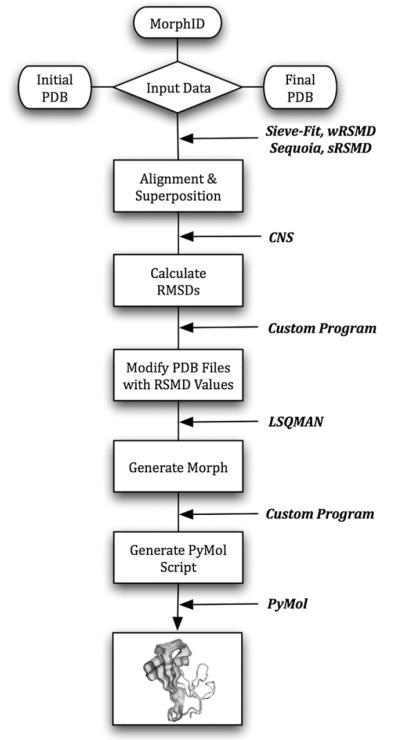
In order to generate a ViewMotions Rainbow diagram the coordinates of the initial and final positions of the macromolecule are required. These coordinates can be supplied either with two PDB files or a MorphID corresponding to a particular macromolecular movement from the Database of Macromolecular Movements [1]. A flow chart of the steps necessary to create a ViewMotions Rainbow diagram is illustrated in Fig. 1.
Fig. 1.
Flow chart for producing a ViewMotions Rainbow diagram. The input data is either two PDB files corresponding to the initial and final coordinates of the motion or a MorphID corresponding to a macromolecular motion described by the Database of Macromolecular Movements [1]. Each of the computational steps is indicated by a box and the software used to perform the calculation is indicated.
After data input, the two structures are then aligned and superimposed by one of four alignment algorithms: a standard least-squares procedure as described by Kabash [6] (sRMSD), the globally optimized alignment method of Needleman and Wunsch [7] as implemented in SEQUOIA program [8], the sieve-fit algorithm [9,10], and a Gaussian-weighted algorithm [11] (wRMSD). The sieve-fit algorithm [9,10] usually yields the best alignments, particularly for domain motions.
CNS [12] is next used to calculate the backbone and side chain RMSD values between the beginning and ending structures using the rmsd.inp procedure. The rmsd.inp procedure generates a list of RMSD values for the backbone and sidechains of each residue. The backbone RMSD values are used for the coloring of the View-Motions Rainbow diagram. In order to accomplish this a custom written C language program was written to replace the b-factor and occupancy values in the initial and final PDB files with the corresponding backbone and sidechain RMSD values, respectively, output from the rmsd.inp procedure of CNS. LSQMAN from the Uppsala Software Factory (http://xray.bmc.uu.se/usf/) is then used to generate the intermediate structures using its morph option. Usually 30 intermediate structures are generated between the initial and final structures by LSQMAN. However, if the maximal RSMD for the macromolecular movement is greater than 1.8 Å or 3.0 Å, 45 or 60 structures are generated, respectively. Finally, a custom shell script is used to generate a command file for PyMol (http://www.pymol.org) to generate a ViewMotions Rainbow diagram. PyMol and Chimera (http://www.cgl.ucsf.edu/chimera) session files are also generated, which can be downloaded by the user.
3. Results and discussion
3.1. Commonly used methods to view macromolecular motions
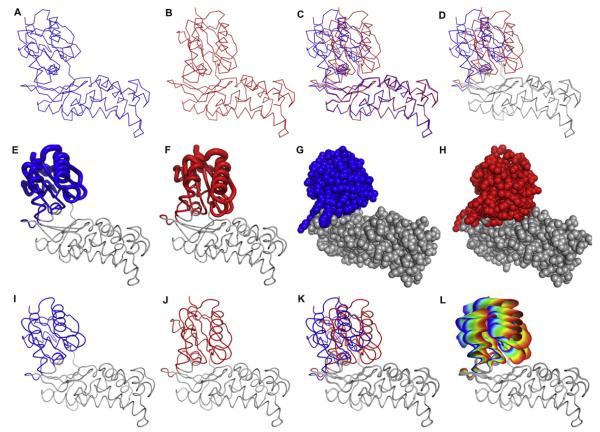
The catalytic cycle of most transferases involves a domain closure, which brings two substrates in close proximity for reaction and may also change the active site environment to one more favorable for reaction. The binding of glucose to hexokinase and glucokinase are two such examples. Shown in Fig. 2(A and B) are the open and closed forms of hexokinase as well as the two forms overlaid (Fig. 2(C)). From this static representation of the conformational change in hexokinase, it is difficult to envision the actual motion. A modification that is often used to help direct the viewer to the important portion of the molecule is to use a neutral color in regions where the conformational changes are the smallest (see Fig. 2(D)).
Fig. 2.
Representations of macromolecular motions. (A–D) A comparison of the open and closed forms of hexokinase. (A) The open form of Sulfolobus tokodaii hexokinase in the absence of ligands (PDB ID 2E2N) [13], (B) the closed form of S. tokodaii hexokinase in the presence of glucose and Mg2+•ADP (PDB ID 2E2Q) [13], (C) the open and closed forms overlaid, and (D) the closed and open forms overlaid with the region of the protein undergoing significant conformational change in color. (E–H) Alternate representations of the hexokinase conformational change upon binding glucose. (E) Tube diagram of the open form of hexokinase. (F) Tube diagram of the closed form of hexokinase. In (E) and (F) the diameter of the tube is linearly proportional to the RMSD between the backbone atoms in the open and closed forms. (G) CPK representation of hexokinase in the unliganded form and (H) in the presence of glucose and Mg2+•ADP. The parts of the protein are colored if the RMSD between the open and closed forms is larger than 1.3 Å. (I–L) Steps in the generation of the ViewMotions diagram of hexokinase. (I) The open form of Sulfolobus tokodaii hexokinase in the absence of ligands (PDB ID 2E2N), (J) the closed form of S. tokodaii hexokinase in the presence of glucose and Mg2+•ADP (PDB ID 2E2Q), (K) the open and closed forms of hexokinase aligned, and (L) the ViewMotions Rainbow diagram of hexokinase showing the open form at the blue end of the rainbow and the closed form at the red end of the rainbow. In addition to the open and closed structures, this diagram has thirty intermediate structures calculated between the two extreme forms. Those parts of the structure with a RSMD of greater than 1.3Å are shown in color.
To provide the reader with alternative methods to view molecular motions, a variety of different graphical representations have been employed. A tube representation can be used in which the width of the tube is linearly proportional to the displacement of the protein backbone atoms (Fig. 2(E and F)). A significant drawback to this representation is that the variable tube width must be applied to a single structure, in this case either the open or closed form. Neither of these individual representations clearly conveys the conformational change that the protein is undergoing. A CPK representation of each of the two states can also be used as illustrated with hexokinase in Fig. 2G (open form) and 2H (closed form). Although the domain motion is apparent, this representation has its drawbacks as small conformational changes, or conformational changes in several parts of the protein are not well represented.
Krebs and Gerstein recognized the complexities of trying to view molecular motions in proteins and therefore developed a Morph Server [2] and a database [1], as a means to create movies of molecular motions and the database to track the various types of molecular motions. Viewing a movie of a conformational change provides a much easier way to understand a molecular motion than any of the two-dimensional representations mentioned above.
In order to overcome the problem of viewing protein conformational changes in textbook and journal diagrams we have devised a new representation, which we call the ViewMotions Rainbow diagram. This new representation starts with the initial and final coordinates of the protein (see Fig. 2(I and J)) and thirty or more intermediate structures generated by linear interpolation of the protein backbone coordinates. Although, a linear interpolation of macromolecular motions does not truly represent the actual motion of the protein, the resulting structures are useful for illustrating the molecular motion. All of these structures are shown simultaneously and spectrally colored from the initial structure in blue to the final structure in red. In order to focus the viewer on the parts of the protein undergoing the conformational change, only those portions of the protein that show a RMSD of 1.3Å or greater are colored (see Fig. 2(L)).
The Database of Macromolecular Movements [1] classifies macromolecular motions into three main categories: (I) motions of fragments smaller than domains, (II) domain motions, and (III) larger movements than domain movements involving the motion of subunits. Furthermore, each of these categories is subdivided by the type of motion (see Table 1). The first two categories involve motions of a single polypeptide chain and are those best visualized using a ViewMotions Rainbow diagram.
Table 1.
Krebs and Gerstein [2] classification of the types of macromolecular motions
| Motion type | Description |
|---|---|
| I | Motions of fragments smaller than domains |
| A | Motion is predominantly shear |
| B | Motion is predominantly hinge |
| C | Motion can not be fully classified at present |
| D | Motion is not hinge or shear |
| II | Domain motions |
| A | Motion is predominantly shear |
| B | Motion is predominantly hinge |
| C | Motion can not be fully classified at present |
| D | Motion is not hinge or shear |
| III | Larger movements than domain movements involving the motion of subunits |
| A | Motion involves an allosteric transition |
| B | Motion does not involve an allosteric transition |
| C | Complex protein motions |
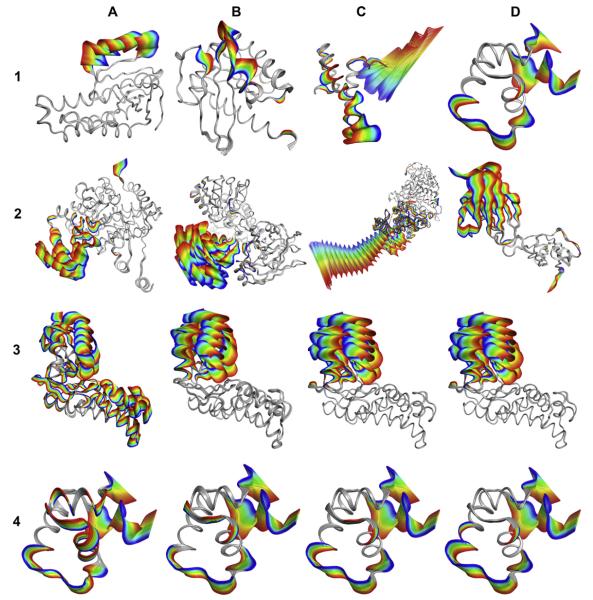
The utility of using ViewMotions Rainbow diagrams can be seen in Fig. 3.1 and 3.2 where the four types of macromolecular motions, defined by Gerstein and Krebs [1], are depicted for motions of fragments smaller than domains (Type I) and domain motions (Type II). For Type I motions, the rainbow of color is associated with specific segments of the protein, smaller than domains. The motion is sometimes restricted to one location on the protein as in Fig. 3.1(A) or in multiple parts as indicated in the other examples of Type I motions. Type II motions, within a single domain, are shown in Fig. 3.2(A–D), however, the termini of the chains may also show motions larger than the cut-off used for the diagram.
Fig. 3.
(1–2) Examples of protein conformational changes shown as ViewMotions Rainbow diagrams. The Database of Molecular Movements [1] defines three classes of molecular motions two of which are depicted here. (1) Type I corresponds to motions of fragments smaller than domains, and (2) Type II corresponds to domain motions. Each of these motion types is subdivided into four subtypes as specified in Table 1. See Table 2 for details of each of the molecules shown in this figure. (3–4) Comparison of different alignment algorithms using hexokinase (3) and lac repressor (4). (A) standard RMSD fit [6], (B) globally optimized alignment [7] as implemented in SEQUOIA [8], (C) Gaussian-Weighted [11], and (D) sieve-fit [9,10].
3.2. Comparison of alignment algorithms
The ViewMotions Rainbow diagram is dependent upon the alignment algorithm used to superimpose the two structures. We have tested four alignment algorithms: the standard RMSD (sRMSD) [6], the sieve-fit algorithm [9,10], the gaussian-weighted RMSD (wRMSD) [11], and the globally optimized alignment method of Needleman and Wunsch [7] as implemented in SEQUOIA [8]. The simplest of the alignments is the sRMSD, which is essentially a least-squares minimization of the corresponding interatomic distances as described by Kabsch [6]. The sieve-fit method is an iterative process in which a sRMSD fit is initially performed. The program then eliminates the Cα atoms that are the furthest apart after the initial alignment. This step is repeated until approximately 50% of the atoms are excluded from the alignment. The Gaussian-Weighted RMSD (wRMSD) [11] is similar to the sieve-fit algorithm, but includes a Gaussian-weighting term, where the atoms with very little movement are weighted more in the least squares fit than atoms that are further apart. Like the sieve-fit method this alignment relies on several iterations until convergence. Each iteration changes the distance of the atoms and thus changing weights and in turn the wRMSD fit. The final type of alignment method utilizes the SEQUOIA program [8], which uses a dynamic programming algorithm [7] to find the globally optimal alignment.
Shown in Fig. 3.3(A–D) and 3.4(A–D) are ViewMotions Rainbow diagrams for hexokinase and lac repressor, respectively, using the four alignment algorithms. In the case of the domain motion of hexokinase, the sieve-fit Fig. 3.3(C) and Gaussian-weighted Fig. 3.3(D) algorithms produced the best representation of the molecular motion. In the case of the lac repressor, which undergoes a motion that is not a hinge or shear, the four alignment algorithms give similar results.
3.3. The ViewMotions server
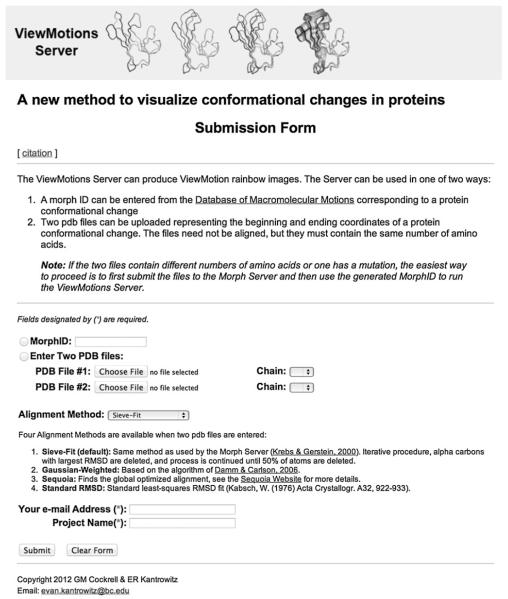
Because of the complexity of the steps outlined in Fig. 1, we decided to create a Web Server to create ViewMotions Rainbow diagrams, the ViewMotions Server (http://viewmotions.bc.edu). The ViewMotions Server (see Fig. 4) can be used in one of two modes to generate ViewMotions Rainbow diagrams. The first involves uploading two PDB files and identifying which chains are to be used in each file, while the second involves simply submitting a MorphID from the Database of Macromolecular Movements [1]. Uploading two PDB files directly has a number of limitations due to the software used. For example, CNS will generate an error if the two PDB files differ in the number of residues or sequence. Therefore, the ViewMotions Server will not generate an image comparing a wild-type enzyme to the same enzyme with a mutation(s). The Morph Server [2] uses a more robust approach for the alignment, superposition, and generation of the morph. Therefore, the Morph Server can handle cases in which the initial and final PDB files do not have the same number of residues, there is a break in the protein chain, or the initial and final PDB files are different by mutation(s). If the structures being compared have already been deposited into the PDB it will typically be easier to first run the files through the Morph Server then submit the MorphID to the ViewMotions Server, although this is not a requirement. All of the examples provided in Fig. 3.1 and 3.2 were produced by directly using the MorphIDs as indicated in Table 2.
Fig. 4.
The ViewMotions Server home page (http://viewmotions.bc.edu).
Table 2.
Summary of example motion types used to produce Fig. 3.1 and 3.2
| Motion type | Example | Morph ID | PDB ID |
||
|---|---|---|---|---|---|
| initial | final | ||||
| I A | Adenosylcobinamide Kinase | va1cbuB-1c9kB | 1CBU | → | 1C9K |
| I B | Ras | 989758-27939 | 4Q21 | → | 6Q21 |
| I C | Ribosomal protein S15 | 401923-2485 | 1AB3 | → | 1A32 |
| I D | Lac repressor | 35866-16653 | 1lCC | → | 1lQC |
| II A | Citrate synthase | cs | 4CTS | → | 1CTS |
| II B | HCV helicase | 109065-518 | 8OHM | → | 1CU1 |
| II C | Myosin | 437354-14115 | 1B7T | → | 1DFK |
| II D | Immunoglobulin | 403713-16146 | 1MCP | → | 1NCA |
The user selects one of the four structural alignment options previously discussed. After the alignment and superposition step, the RMSD deviations of the corresponding backbone and side chain atoms in the two structures are determined. The RMSD values for the backbone atoms are used for the color coding of the morphed structures in the final image generated by PyMol. When the ViewMotions Server has completed its calculations it sends an email to the user with the output information and a ray-traced ViewMotions Rainbow diagram. Since the orientation of this figure is often not optimal, the PyMol or Chimera session file used to generate the image can be downloaded by the user so that he/she can reorient the molecule and generate a ViewMotions Rainbow diagram from an alternate viewpoint.
3.4. Limitations
While ViewMotions Rainbow diagrams are very useful to illustrate macromolecular motions, there are limitations to this procedure. As previously stated, the input structures must be the same sequence and same number of residues to directly run through the ViewMotions web server. Therefore, this Web Server is for illustrating conformational changes of the same protein and not for comparing conformations of homologous proteins. These limitations can often be countered by using the Morph Server and then submitting the Morph ID to the ViewMotions Server.
Another limitation of these diagrams is that extremely large motions are more difficult to illustrate. While the ViewMotion Server will automatically generate more intermediate structures based on the maximum RMSD, the resulting image may not be able to convey other parts of the protein because the ribbon becomes too large. The advantage of the ViewMotions Server however, is that the user is able to download the Pymol or Chimera session file and can further manipulate the ViewMotions Rainbow Diagram with many built in tools such as transparency. The user is also able to make images of multiple orientations of the protein.
4. Conclusion
Viewing motions of macromolecules, based on experimental structural data, in movie format provides one of the best methods to understand molecular motions. However, in journals and textbooks it is often not possible to access molecular motion videos. Therefore, we have developed a new paradigm for showing molecular motions in a single image, the ViewMotions Rainbow. This diagram consists of the initial and final conformations of a macromolecule along with a number of intermediate structures linearly interpolated between the initial and final states colored from blue to red. These ViewMotions Rainbow diagrams provide a new graphical representation to help understand molecular motions. In order to produce these images easily, we have setup a Web Server (http://viewmotions.bc.edu) for the specific purpose of creating these images either from available Protein Data Bank files or using a MorphID from the Database of Molecular Movements [1].
Acknowledgement
This work was supported by the U. S. National Institutes of Health grant GM026237.
Abbreviations
- RMSD
root mean square deviation
- Database of Macro-molecular Movements (Morph Server)
- ViewMotions Server
Footnotes
Note added in proof As of version 2.0 the restriction that the two structures must have exactly the same number of amino acids has been eliminated. Deletions at the N-terminal or C-terminal can be processed. In addition, sequences with a small number of mutations can now be handled. There is also a new input method to directly use PDB IDs.
References
- [1].Gerstein M, Krebs W. A database of macromolecular motions. Nucleic Acids Research. 1998;26:4280–4290. doi: 10.1093/nar/26.18.4280. [DOI] [PMC free article] [PubMed] [Google Scholar]
- [2].Krebs WG, Gerstein M. The morph server: a standardized system for analyzing and visualizing macromolecular motions in a database framework. Nucleic Acids Research. 2000;28:1665–1675. doi: 10.1093/nar/28.8.1665. [DOI] [PMC free article] [PubMed] [Google Scholar]
- [3].Harris KM, Cockrell GM, Puleo DE, Kantrowitz ER. Crystallographic snapshots of the complete catalytic cycle of the unregulated aspartate transcarbamoylase from Bacillus subtilis. Journal of Molecular Biology. 2011;411:190–200. doi: 10.1016/j.jmb.2011.05.036. [DOI] [PMC free article] [PubMed] [Google Scholar]
- [4].Kantrowitz ER. Allostery and cooperativity in Escherichia coli aspartate transcarbamoylase. Archives of Biochemistry and Biophysics. 2012;519:81–90. doi: 10.1016/j.abb.2011.10.024. [DOI] [PMC free article] [PubMed] [Google Scholar]
- [5].Peterson AW, Cockrell GM, Kantrowitz ER. A second allosteric site in E. coli aspartate transcarbamoylase. Biochemistry. 2012;51:4776–4778. doi: 10.1021/bi3006219. [DOI] [PMC free article] [PubMed] [Google Scholar]
- [6].Kabsch W. A solution for the best rotation to relate two sets of vectors. Acta Crystallographica. 1976;A32:922–923. [Google Scholar]
- [7].Needleman SB, Wunsch CD. A general method applicable to the search for similarities in the amino acid sequence of two proteins. Journal of Molecular Biology. 1970;48:443–453. doi: 10.1016/0022-2836(70)90057-4. [DOI] [PubMed] [Google Scholar]
- [8].Bruns CM, Hubatsch I, Ridderstrom M, Mannervik B, Tainer JA. Human glutathione transferase A4-4 crystal structures and mutagenesis reveal the basis of high catalytic efficiency with toxic lipid peroxidation products. Journal of Molecular Biology. 1999;288:427–439. doi: 10.1006/jmbi.1999.2697. [DOI] [PubMed] [Google Scholar]
- [9].Lesk AM. Protein Architecture A Practical Approach. IRL Press; Oxford: 1991. [Google Scholar]
- [10].Gerstein M, Chothia CH. Analysis of protein loop closure: two types of hinges produce one motion in lactate dehydrogenase. Journal of Molecular Biology. 1991;220:133–149. doi: 10.1016/0022-2836(91)90387-l. [DOI] [PubMed] [Google Scholar]
- [11].Damm KL, Carkson HA. Gaussian-weighted RMSD superposition of proteins: a structural comparison for flexible proteins and predicted protein structures. Biophysical Journal. 2006;90:4558–4573. doi: 10.1529/biophysj.105.066654. [DOI] [PMC free article] [PubMed] [Google Scholar]
- [12].Brünger AT, Adams PD, Clore GM, DeLano WL, Gros P, Grosse-Kunstleve RW, et al. Crystallography and NMR system (CNS): a new software system for macromolecular structure determination. Acta Crystallographica. 1998;D54:905–921. doi: 10.1107/s0907444998003254. [DOI] [PubMed] [Google Scholar]
- [13].Nishimasu H, Fushinobu S, Shoun H, Wakagi T. Crystal structures of an ATP-dependent hexokinase with broad substrate specificity from the hyperthermophilic archaeon Sulfolobus tokodaii. The Journal of Biological Chemistry. 2007;282:9923–9931. doi: 10.1074/jbc.M610678200. [DOI] [PubMed] [Google Scholar]


