Abstract
The objective of this study was to develop reliable pediatric psychophysical methodologies in order to address the limits of frequency and electrode discrimination in children with cochlear implants. Discrimination was measured with a two-alternative, adaptive, forced choice design using a video game graphical user interface. Implanted children were compared to normal-hearing children in the same age ranges. Twenty-nine implanted children and 68 children with normal-hearing performed frequency discrimination studies at varying frequencies. Electrode discrimination was assessed in thirty-four implanted children at varying electrode locations and stimulation intensities. Older children had better frequency discrimination than younger children, both for implanted and hearing subjects. Implanted children had worse frequency discrimination overall and exhibited learning effects at older ages than hearing children. Frequency discrimination Weber fractions were smallest in low frequencies. Electrode discrimination improved with stimulus intensity level for older but not younger children at all electrode locations. These results support the premise that developmental changes in signal processing contribute to discrimination of simple acoustic stimuli. For implanted children, auditory discrimination improved at lower frequencies and with electrodes at higher intensity. These findings imply that spatial separation may not be the key determinant in creating discriminable electrical stimuli for this population.
1. Introduction
In deaf patients implanted with cochlear prosthetics, understanding how electrical stimuli are perceived is an important step towards maximizing the performance of the prosthesis. Basic psychophysical measurement techniques are designed in order to reduce sources of bias and define criteria for the comparison of behavioral responses. Relatively few studies have performed basic auditory psychophysics in children due to the inherently monotonous nature of the psychophysical tasks. The more successful experiments have used a video game approach to compensate for this monotony and allow such data collection in children. The goal of this research project was to develop and utilize a more interactive and captivating video game-based psychophysics software that allows for auditory psychophysics measurements using both acoustic and electrical stimulation in pediatric cochlear implant users. Normal-hearing children were also tested both to demonstrate the efficacy and reliability of our testing interface, and to provide a basis for comparison with cochlear implantees on measures of frequency discrimination.
In order for the implant to operate optimally, each electrode should stimulate a local population of afferent auditory nerve fibers such that its electrical output is discriminable from that of the surrounding electrodes. Discriminability of electrodes has been studied in adult human subjects. Results showed that discrimination improves with increases in the spatial separation of electrodes and that the difference limen is slightly more than one electrode for most patients (Busby and Clark, 1996). However, the relationship between electrode discrimination and pitch percept is multidimensional (Collins et al., 1997). In some subjects, changing programming parameters based on optimal electrode discriminability results in increased speech perception performance (Zwolan et al., 1997). Psychophysical measures of electrode discrimination were also found to improve as a function of stimulus intensity (Pfingst et al., 1999). These studies indicate high intersubject variability in discrimination performance, as well as variability along the length of the electrode array.
Few studies have attempted to quantify electrode discrimination abilities in children with cochlear implants. Data indicate that electrode discrimination abilities and speech perception performance are related (Busby et al., 1993; Throckmorton and Collins, 1999; Busby and Clark, 2000; Henry et al., 2000). Only one study examined the effects of electrode discrimination in children younger than 8 years of age (Dawson et al., 2000). In this study, the authors use an adaptation of conditioned play audiometry to measure electrode discrimination in children as young as 4 years of age. This testing method suffers from the effects of subjects’ internal response criterion and bias.
The classic two-alternative forced choice (2AFC) paradigm has been successfully used in acoustic psychophysical experiments in children and has the advantage of minimizing subject bias and criterion (Irwin et al., 1986; Allen et al., 1989; Elliott et al., 1989; Cranford et al., 1997; Thompson et al., 1999). These studies have used a video game type interface to hold the child’s attention for the duration of the task. Such psychophysical experiments have been used to study maturational changes (Irwin et al., 1986; Allen et al., 1989; Elliott et al., 1989; Thompson et al., 1999) as well as the influence of a history of otitis media on frequency discrimination (Cranford et al., 1997). Psychophysical measures of frequency resolution have been shown to correlate to both cognitive and sensory skill development in critical age groups (Thompson et al., 1999; Hartley et al., 2000). Furthermore, video game platforms have recently been shown to be effective in collecting psychoacoustic data in children with cochlear implants as young as 4 years old (Laneau et al., 2005). Here we test multiple pediatric age cohorts using a unique video game platform in order to ascertain the limits of discrimination for both acoustic and electric stimuli and dissociate these results from maturational changes.
2. Methods
2.1. Video game design
A video game graphical user interface was designed to facilitate psychophysical testing in pediatric subjects. This video game graphical user interface was designed using Director MX (Macromedia, Inc., San Francisco, California). For this unique application, ActiveX controls were developed with the capability to interface with either sound generating computer hardware for the production of acoustic stimuli or the implant manufacturers’ software, which in turn control the implants through the programming hardware to produce electrode stimuli.
Each trial consisted of a two-alternative forced choice (2AFC) paradigm in which the subject was presented with four successive stimuli. The first and last stimuli were identical flankers. The second and third stimuli consisted of one stimulus identical to the flankers and one test stimulus. Thus the stimulus pattern for any given trial was either AABA or ABAA, with a random distribution of the two patterns. 25 trials comprised one run. After two correct responses the magnitude of the differencewas reduced. After a single incorrect response, the magnitude of the difference was increased. This twodown one-up protocol converges on 70.7% along the psychometric function (Levitt, 1971). The minimum discriminable difference or difference limen was defined as the mean of the final 4 reversals of the run. The standard deviation of the last four reversals was used as a criterion for test reliability. Runs were rejected if either four reversals were not achieved or the standard deviation of the reversals was greater than twice the mean of standard deviations for all subjects 10.0 years old and older.
Seven animated scenes were available for testing purposes, each with four similar characters on the screen “speaking” the stimulus. Each scene had a unique visual reward for a correct identification of the test stimulus and a visual admonition for an incorrect response. The tester could vary the scene for the user so as to maintain attentiveness during and between runs. Fig. 1 displays details on one scene, and Fig. 2 shows the variety of scenes available.
Fig. 1.
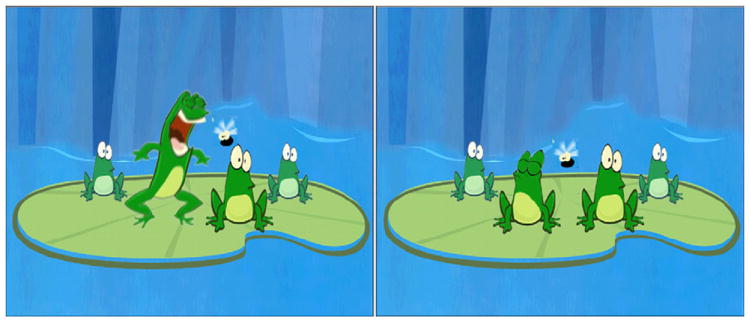
Scene from video game interface. In this scene, stimuli accompanied the mouth opening of each frog in succession, from left to right. The user selected the second frog. On the left panel, the stimulus of the second frog was different from those of the other three (ABAA) and the child was given positive feedback. On the right panel, the stimulus of the third frog was different (AABA) and the child was given negative feedback.
Fig. 2.
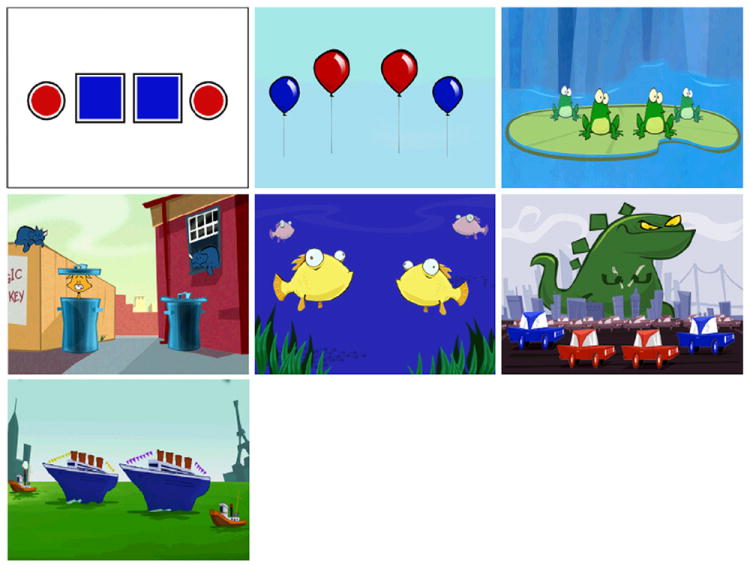
Scene variety available. Each scene contains 4 characters (shapes, balloons, frogs, cats, fish, cars and boats) that move when a stimulus is presented. The central two characters can be selected as a valid response.
Subjects were divided into four age groups for analysis based on cognitive and perceptual differences suggested by frequency resolution literature in hearing children (Thompson et al., 1999; Hartley et al., 2000). Group 1 consisted of children 6 years of age and younger. Group 2 consisted of children 6–10 years of age. Group 3 consisted of children 10–14 years of age. Group 4 consisted of children older than 14 years of age.
2.2. Acoustic stimuli
A laptop computer (SONY Vaio PCG-FX150K) generated the acoustic stimuli using ActiveX controls. Stimuli were presented at full-on computer output through portable amplified speakers (Radio Shack model 40-1432) at a fixed volume setting, positioned within 1 m of the subject in a room with an ambient noise level below50 dBA. The resulting intensity of the signal averaged 74.5 dB SPL (standard deviation 4.8 dB) from 500 to 7000 Hz, confirmed with a sound level meter (Radio Shack model 33-2055). When confirming the system output with a Hewlett Packard 3561A Dynamic Signal Analyzer, we found that the system output frequency was 0.5% higher than requested. That is, if we requested a 1000 Hz signal, the computer would generate a 1005 Hz signal. As the discrepancy was constant across all frequencies tested, it was not corrected. Any harmonics of the tonal stimuli were at least 40 dB lower than the primary. Implanted subjects used their standard implant settings for all acoustic testing.
2.3. Electrical stimuli
Electrical stimuli could be generated for the Clarion CII/HiRes90K and Nucleus 24 platforms. Electric stimuli were 500 ms biphasic pulse trains in a monopolar configuration on single electrodes with all other electrodes silent. Pulse trains were separated by 800 ms pauses. Pulse duration and stimulation rate were 75 μs/phase and 813 Hz for Clarion, and 25 μs/phase and 1000 Hz for Nucleus. A schematic is shown in Fig. 3.
Fig. 3.
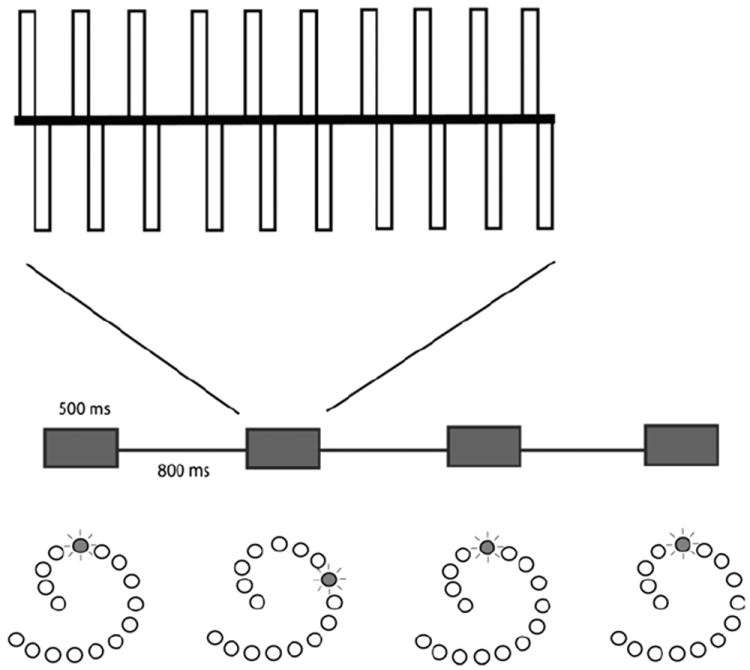
Electric stimulus schematic. The timeline of the stimuli from a single trial is shown in the middle of the figure. Four 500 ms pulse trains are shown, separated by 800 ms between stimuli. The second stimulus is shown with an expanded timescale above, demonstrating the pulse train with constant amplitude. Below the timeline are schemata of the implant’s electrode array demonstrating the single electrode that is stimulated in each case.
In order to maintain an approximation of constant relative intensity between electrodes, stimulus intensity for each electrode was held during each run to a constant fraction of each electrode’s psychophysical dynamic range (Zeng and Shannon, 1992). Dynamic range was determined from a behavioral measure of threshold (T) and maximum comfort (M) level used routinely in the clinical setting and described previously in detail (Franck et al., 2002). In summary, T-levels are determined by means of behavioral observation audiology, conditioned play audiometry, or voluntary response techniques. M-levels are determined by raising the level of stimulation until the child expresses that the stimulation is at the upper limit of comfort. If the child expresses that the stimulus is uncomfortable, stimulus level is decreased. Inactivated or unused electrodes along the patient’s electrode array were excluded from testing.
For electrode discrimination, software safeguards were designed to ensure that the electrode parameter files match the subject being tested, to verify that experimenters’ commands are valid, and to avoid excessive stimulation. As a final safeguard, patients were instructed prior to testing to pull off the external coil should the stimulus be too intense.
All subject recruitment and testing was approved by the Institutional Review Board of the Children’s Hospital of Philadelphia (CHOP).
2.4. Experiment 1: frequency discrimination
2.4.1. Subjects
Deaf subjects with cochlear implants who were followed at CHOP were considered eligible for the study. In all, 29 implanted subjects were tested. Ages ranged from 3.16 to 16.33 years (mean = 8.44 years). Duration of implantation ranged from four months to 7.75 years. Implant type varied across subjects, as did speech coding strategies. Nineteen subjects used a Clarion 1.2, CII or HiRes90K implant, nine subjects used a Nucleus 22 or 24 and one subject used a Med-El Combi 40+.
A control group of 68 normal-hearing subjects participated, with ages ranging from 2.7 to 16.5 years (mean = 7.77 years). Normal-hearing subjects consisted primarily of siblings of deaf children with cochlear implants who are followed at CHOP. Other normal-hearing subjects were recruited separately. Normal hearing was documented by parental report of a hearing screen and a normal tympanogram. Eligibility for the study excluded children with visual or cognitive deficits that would preclude the ability to perform the psychophysical tasks.
2.4.2. Frequency discrimination task
Frequency discrimination was tested in all subjects at a base frequency of 1000 Hz, tested over three runs. CI subjects were additionally tested at base frequencies of 500 and 3000 Hz. Each run began with a frequency difference of 50 Hz. The difference was halved following two correct responses, and doubled following an incorrect response. Runs were rejected if either four reversals were not achieved or the log standard deviation of the reversals was greater than twice the mean of standard deviations for all subjects 10.0 years old and older.
All frequency difference limen (DF) results were presented as mean ± SEM. Comparisons between groups were conducted using two-tailed unpaired t-tests, one-way ANOVA or Kruskal–Wallis tests. Test–retest reliability was assayed using the Pearson product moment correlation coefficient to measure the effect of trial number on performance (DF). The 0.05 level of probability was used as the criterion of statistical significance.
2.5. Experiment 2: electrode discrimination
2.5.1. Subjects
All patients followed at the Children’s Hospital of Philadelphia (CHOP) and implanted with a Clarion CII, Clarion HiRes90K, or Nucleus 24 series cochlear implant who did not have visual or cognitive deficits that would preclude the ability to perform the psychophysical tasks were considered eligible for the study. Thirty-four subjects volunteered for the study. The age of the subjects at the time of testing ranged from 4.0 to 17.7 yr (mean 9.6 year; SD 4.4 years.). Subjects were tested between 5 and 100 months after implantation (mean 26, standard deviation 21 months). Eleven subjects had an Advanced Bionics Clarion implant and 23 had Nucleus 24 implants.
2.5.2. Electrode discrimination task
Three parameters were tested in electrode discrimination tasks. First, stimulus intensity was set to either 50% or 80% of the dynamic range. Second, the position of the fixed electrode was varied between an apical and a basal position along the electrode array. For the subjects with a 22-electrode Nucleus implant, the basal electrode was set as electrode #5, while apical was set at #17. For subjects with a 16-electrode Clarion implant, the basal electrode was set as electrode #12, while apical was set at #5. These electrodes were chosen as to test similar intracochlear electrode positions. Finally, the direction of the test electrode with respect to the fixed electrode was varied between the basal or apical direction. Thus, subjects were asked to perform a minimum of eight runs of 25 trials. Run order was kept consistent between subjects such that effect of repeated trials could be dissociated from effect of any of the variables of interest.
The maximum inter-electrode distance was constrained by the length of the array. Thus if the maximum inter-electrode distance was reached, with subsequent wrong answers this distance would remain unchanged. Because of this constraint, data could be skewed towards smaller values in the conditions of an apical fixed electrode with apically varying test electrode or a basal fixed electrode with basally varying test electrode. In the event of inactivated or unused electrodes along the patient’s electrode array, the closest active adjacent electrode was used.
Each run began with an inter-electrode distance of three electrodes between the test and fixed stimuli. The difference was reduced by one electrode following two correct responses, and increased by one electrode following an incorrect response. The inter-electrode distance difference limen (DL) was converted using design specifications from the implant manufacturers into distance in millimeters along the electrode array. As in Experiment 1, runs were rejected if either four reversals were not achieved or the standard deviation of the reversals was greater than twice the mean of standard deviations for all subjects 10.0 years old and older.
As above, all results were presented as mean ± SEM. Comparisons between groups were conducted using two-tailed unpaired t-tests, one-way ANOVA or Kruskal–Wallis tests. Test–retest effects were assayed using the Pearson product moment correlation coefficient to measure the effect of trial number on performance (DL). The 0.05 level of probability was used as the criterion of statistical significance.
3. Results
3.1. Frequency discrimination
Cochlear implant (CI) subjects completed 132 out of 138 attempted runs (96%). Of these completed runs, 126 (91% of attempted) met the inclusion criterion for attentiveness based on the number and standard deviation of reversals (log of standard deviation = 0.71). Normal-hearing (NH) subjects completed 186 of 198 attempted runs (94%). Of these completed runs, 177 (89% of total attempted) met the inclusion criterion (log of standard deviation = 0.74). Percentage of included runs for both groups was assessed in each of four age categories. Results for NH and CI are shown in Tables 1 and 2, respectively. The results show that for NH subjects, the percent of included runs increased with age. No other biographical data (implant type, duration of implantation, gender, speech coding strategy) were correlated with performance.
Table 1.
Number of frequency discrimination trials completed and included in data analysis for children with normal hearing.
| Group | Total trials | Completed | Included | Included (%) |
|---|---|---|---|---|
| 1 (ages ≤ 6) | 82 | 70 | 63 | 77 |
| 2 (ages > 6, ≤10) | 48 | 48 | 46 | 96 |
| 3 (ages > 10, ≤14) | 51 | 51 | 51 | 100 |
| 4 (ages > 14) | 17 | 17 | 17 | 100 |
| All | 198 | 186 | 177 | 89 |
Table 2.
Number of frequency discrimination trials completed and included in data analysis for children with cochlear implants.
| Group | Total trials | Completed | Included | Included (%) |
|---|---|---|---|---|
| 1 (ages ≤ 6) | 22 | 20 | 17 | 77 |
| 2 (ages > 6, ≤10) | 57 | 56 | 56 | 98 |
| 3 (ages > 10, ≤14) | 42 | 40 | 39 | 93 |
| 4 (ages > 14) | 17 | 16 | 14 | 82 |
| All | 138 | 132 | 126 | 91 |
To assess the effect of training, we examined the change in the DF as a function of testing session for otherwise identical conditions over the course of four trials. The slope of the DF curve measured at 1000 Hz from the first trial to the fourth assays the effect of training. More negative slopes indicate greater improvement with run number. For example, cochlear implant subject 14 completed 4 runs at 1000 Hz. DFs were as follows (in Hz): 59.5, 84.1, 35.4, 21.0. Thus slope of the change in DF over the course of 4 runs for this subject was −16.4 Hz/trial. This slope is calculated for each subject. We divided subjects into the same age categories listed in Tables 1 and 2 and examined the means of the slope for each age group. Differences in the training effect between CI and NH groups were statistically insignificant in all age groups according to Kruskal–Wallis tests. In group 1, both NH and CI subjects show great improvement and a high degree of variability over the course of multiple trials at 1000 Hz (mean slope = −445 Hz/trial, −379 Hz/trial respectively). In group 2, CI subjects improve over the course of multiple trials (mean slope = −166 Hz/trial), while NH subjects have reached a performance plateau (mean slope = 8 Hz/trial). In group 3 NH children show a slight improvement with trial (slope = −2.7) that is statistically significant (95% CI = −0.17 to −5.32, p < 0.025) while CI children have no significant improvement trend. By group 4, both CI and NH children have reached a plateau where training has little effect on frequency discrimination. These results are displayed in Fig. 4. Because of this effect of training for groups 1–3, DF results for all further analyses were based on the last trial of any given set of stimulus conditions.
Fig. 4.
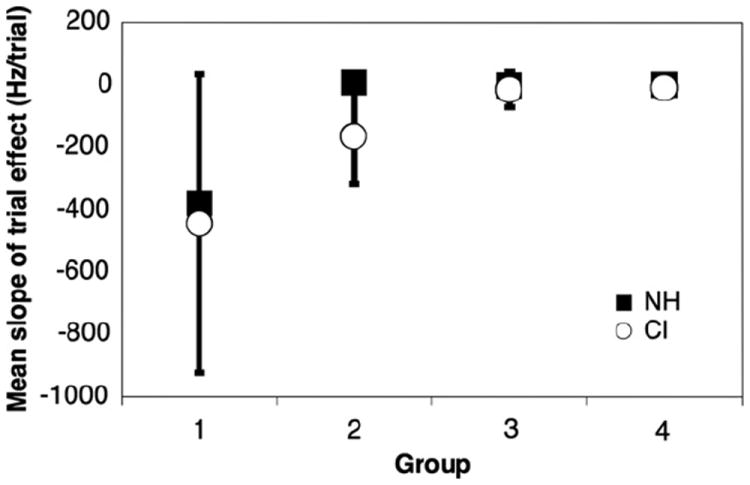
Effect of frequency discrimination task training. The figure plots the slope of DF over the course of multiple runs at 1000 Hz in age categories for both CI and NH subjects. Each point is the mean of slope for all subjects in that age category. Negative slopes indicate improvement on consecutive trials in the youngest listeners. Error bars represent the standard error of mean slope.
To assess the effect of age on DF, we analyzed the last run of any test session within the four age categories, for NH and CI subjects at 1000 Hz. As shown in Fig. 5, DF decreased as age increased in both NH and CI subjects. For implanted subjects, comparisons based on age approach but do not reach significance (One-way ANOVA with Tukey post-test). In the NH group, performance improved significantly only between group 1 and all other age groups (p < 0.01). This suggests that the development of frequency discrimination occurs at younger ages in NH subjects compared to deaf implanted children. In direct comparison of NH to CI frequency discrimination (Two-tailed unpaired t-test) discrimination in NH subjects is better than that of CI subjects (p =.0007). When separated by age, oneway ANOVA reveals statistically significant differences only in age groups 2 (p = .003) and group 3 (p = .0004) wherein NH subjects in these age groups have statistically lower DFs compared to their CI counterparts.
Fig. 5.
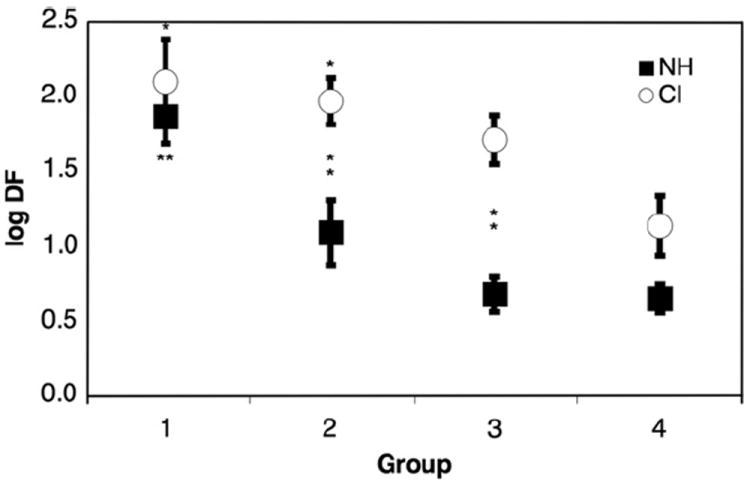
Effect of age on frequency discrimination. The figure plots the log DF at 1000 Hz for both CI and NH subjects as a function of age category. Each point is the mean of DF for all subjects in that age category. Error bars represent the standard error of mean. “*” Indicates significance p < 0.05 in comparison to oldest age cohort. “**” Indicates significance p < 0.01 in comparison to oldest age cohort. Vertical “*” indicate significant differences between NH and CI age subgroups.
With respect to the frequency dependence of discrimination, we used the last run of any test session to compare the DF measured at 500, 1000 and 3000 Hz for implanted children above and under 10 years of age (groups 1 and 2 vs. groups 3 and 4). Differences between the groups 1 and 2 and groups 3 and 4 respectively were statistically insignificant. Fig. 6 plots the log frequency DF as a function of reference frequency for these two groups and includes data from the normal-hearing children at 1000 Hz as well as normative data extrapolated from Weber fractions (DF/base frequency) measured at 40 dB SPL in adults (Wier et al., 1977; Yost, 1994). As with normal-hearing adults, the size of the DF for children with cochlear implants increases as reference frequency increases. Using the video game, hearing children over 10 years perform within 1 standard deviation of normative adult discrimination at 1000 Hz. Table 3 displays DF ± SEM, the Weber fraction ± SEM and the number of subjects for each subgroup.
Fig. 6.
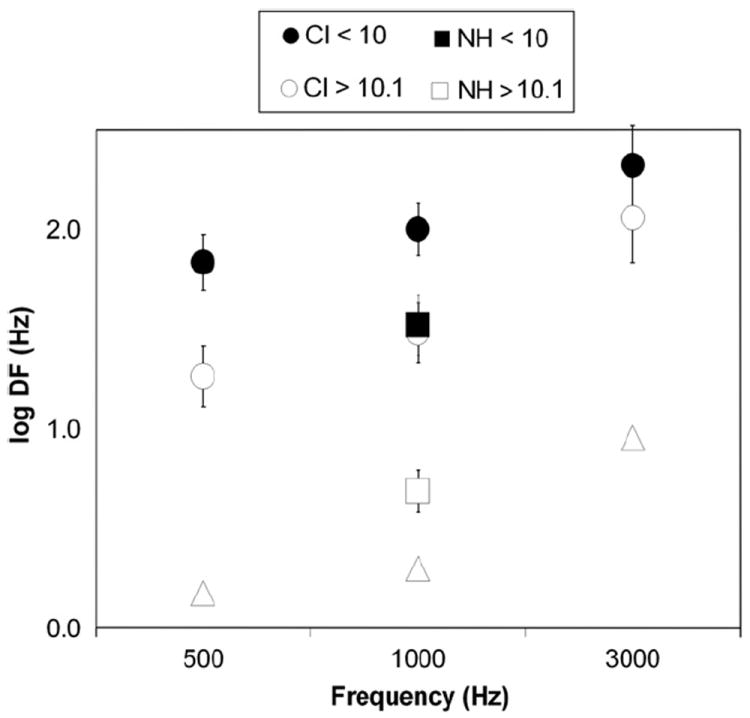
Effect of frequency on difference limen plotted logarithmically. This figure plots the log of DF for CI users in this experiment and normal-hearing adults (Wier et al., 1977) at 500, 1000, and 3000 Hz. DF at 1000 Hz is also presented for NH children in this experiment. Frequency DF, despite being an order of magnitude larger in pediatric implantees than in hearing adults, still increases monotonically with respect to base frequency. Error bars represent standard error of the mean.
Table 3.
Frequency difference limens (DF) and Weber fractions for CI subjects at 500, 1000 and 3000 Hz base frequency. Results for NH subjects are presented for comparison at 1000 Hz. SEM refers to the standard error. N refers to the number of subjects with a valid trial included in each group. For any given frequency only the last valid trial was used. Weber fractions and extrapolated DF’s for adults were obtained from Wier et al. (1977).
| Group | Frequency (Hz)
|
|||
|---|---|---|---|---|
| 500 | 1000 | 3000 | ||
| CI < 10 | DF (Hz) ± SEM | 130 ± 68 | 156 ± 36 | 392 ± 113 |
| Weber (DF/F) ± SEM | 0.26 ± 0.14 | 0.16 ± 0.04 | 0.13 ± 0.04 | |
| N | 11 | 13 | 11 | |
| CI > 10.1 | DF (Hz) ± SEM | 29 ± 9 | 55 ± 26 | 220 ± 69 |
| Weber (DF/F) ± SEM | 0.06 ± 0.02 | 0.06 ± 0.03 | 0.07 ± 0.02 | |
| N | 9 | 10 | 9 | |
| NH < 10 | DF (Hz) ± SEM | 218 ± 85 | ||
| Weber (DF/F) ± SEM | 0.22 ± 0.08 | |||
| N | 36 | |||
| NH > 10.1 | DF (Hz) ± SEM | 9.1 ± 2.6 | ||
| Weber (DF/F) ± SEM | 0.009 ± 0.002 | |||
| N | 21 | |||
| Adult | DF (Hz) ± SEM | 1.5 | 2 | 9 |
| Weber (DF/F) ± SEM | 0.003 | 0.002 | 0.003 | |
| *extrapolated from Weir 1977 | ||||
3.2. Electrode discrimination
CI subjects completed 263 out of 284 attempted runs (93%). Of these completed runs, 213 (75% of attempted) met the inclusion criterion for attentiveness based on the standard deviation of reversals (standard deviation = 1.74 electrodes). Percentage of included runs was assessed in each of four age categories. The inclusion details are shown in Table 4.
Table 4.
Number of electrode discrimination trials completed and included in data analysis for children with cochlear implants.
| Group | Total trials | Completed | Included | Included (%) |
|---|---|---|---|---|
| 1 (ages ≤ 6) | 68 | 62 | 50 | 74 |
| 2 (ages > 6, ≤10) | 95 | 85 | 65 | 68 |
| 3 (ages > 10, ≤14) | 50 | 47 | 40 | 80 |
| 4 (ages > 14) | 71 | 69 | 58 | 82 |
| All | 284 | 263 | 213 | 75 |
To assess the effect of training on electrode discrimination during the testing session, we examined the change in DL as a function of run number irrespective of test conditions. As with the acoustic frequency discrimination task, the slope of the curve of DL from the first run to the last assays the effect of training. The effect of trial is illustrated in Fig. 7. The Pearson product moment correlation coefficients for the effect of trial number on mean performance are not significant for any group. When subjects who completed less than 50% of attempted runs are excluded from this analysis, there are no significant differences in training effect between any age groups by Kruskal–Wallis test. Interestingly, Group 1 (under 6 years old) performance declined slightly over the course of multiple trials (mean slope = 0.248, 95% CI = 0.02–0.48). Due to this slight effect and in order to be consistent with the analysis of the acoustic data, when multiple identical trials were completed only the last result was included in the analysis.
Fig. 7.
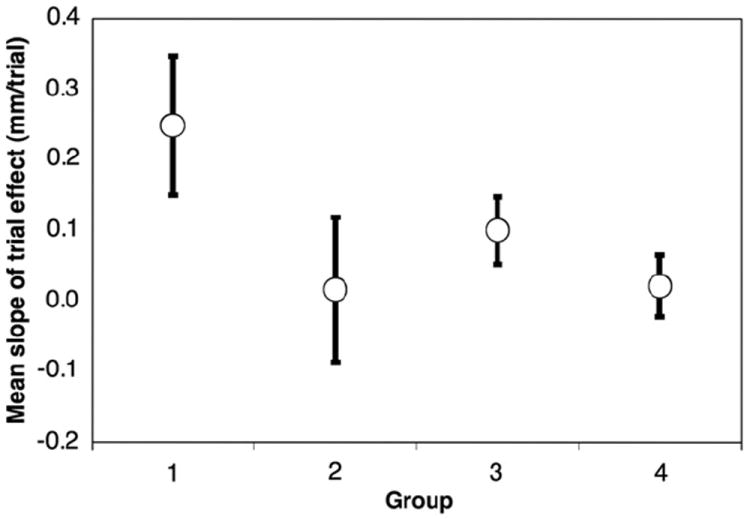
Slope of the trial effect as a function of age group for electrode discrimination. Error bars represent standard error of the mean. No comparisons between age groups were significant. None of the Pearson product moment correlation coefficients derived from these regressions were significant. Group 1 mean slope is significantly different from 0, showing some decline in performance with multiple trials.
Fig. 8 shows electrode discrimination as a function of age. Significant differences were seen in all comparisons except for between the youngest two age groups and the oldest two age groups (Kruskal–Wallis, p < 0.001). In the older age categories, children discriminated inter-electrode distances roughly one electrode apart. Groups 1 and 2 were combined, as were groups 3 and 4, for further analysis.
Fig. 8.
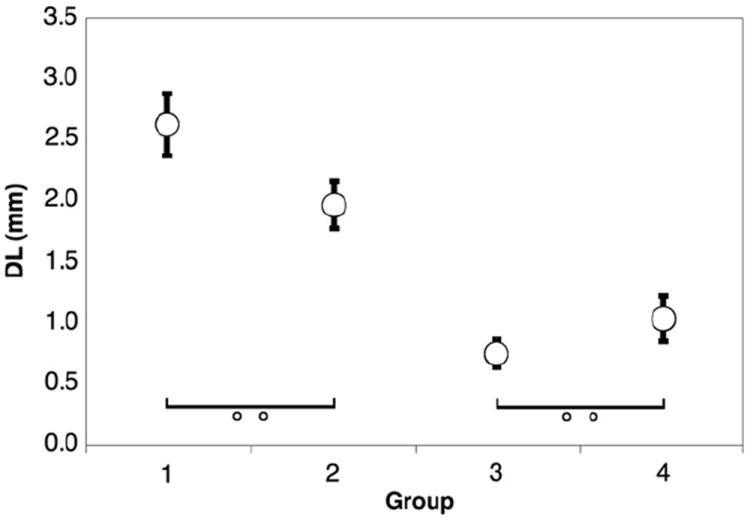
Electrode discrimination as a function of age group. Error bars represent standard error of the mean. All comparisons are significant to p < .05 excluding those marked with “o o”.
Electrode discrimination data were divided between base and apex, and between high and low intensity conditions for the two combined age category groups. Fig. 9 displays all these conditions together. The effect of direction (towards apex or towards base) was eliminated by discarding unpaired results. In the older age categories (groups 3 and 4), there is a significant effect of intensity such that DL decreases in the high intensity condition at both the base (p = 0.012) and apex (p = 0.023). In Fig. 10 the electrode discrimination data were divided with respect to direction (towards apex or towards base) and intensity. All trials where the result might be confounded by the constraint of the electrode array length or position were eliminated. In the over 10 age group, there is a significant effect of direction in the high intensity condition such that DL is lower when varying the test electrode in the basal direction (p = .002). Figs. 11 and 12 collapse across variables to show effects of location (combining high and low intensity) and intensity (combining basal and apical location), respectively. Fig. 11 demonstrates no significant effect of location in any age group. Fig. 12 demonstrates that for children over 10, DL decreased as intensity increased (p = .003).
Fig. 9.
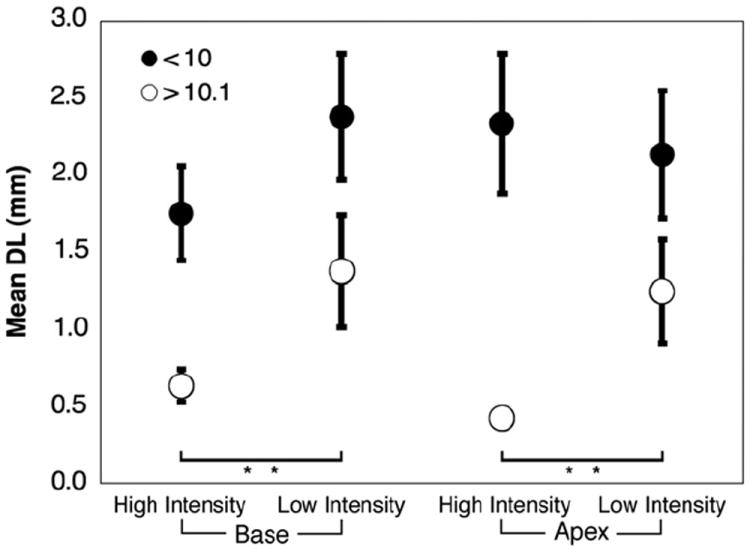
Electrode discrimination as a function of location and intensity. Error bars represent standard error of the mean. “**” Indicates significance p < 0.01. Children over 10 years old perform significantly better with high intensity stimuli at both apical and basal ends of the array.
Fig. 10.
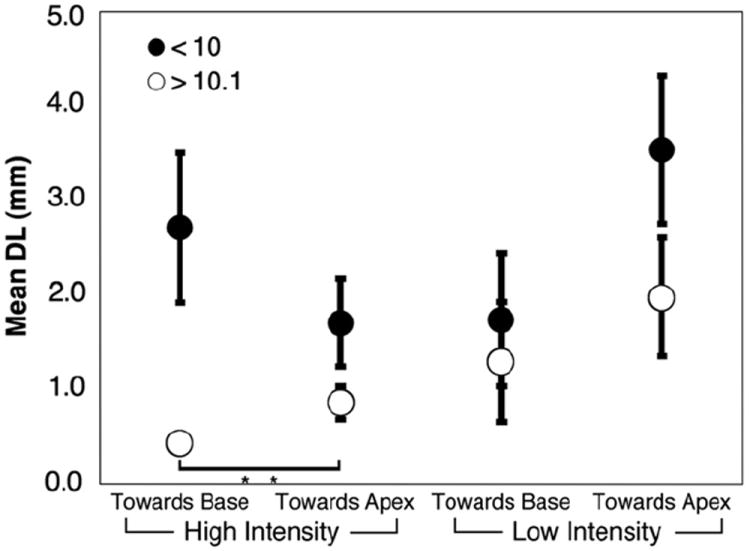
Electrode discrimination as a function of direction after correction for limitations of the array. Error bars represent standard error of the mean. Open circles are children ages 10 and older, closed circles are children under 10. “**” Indicates significance p < 0.01. Children over 10 discriminate better between high intensity stimuli on electrodes varied towards the base of the array.
Fig. 11.
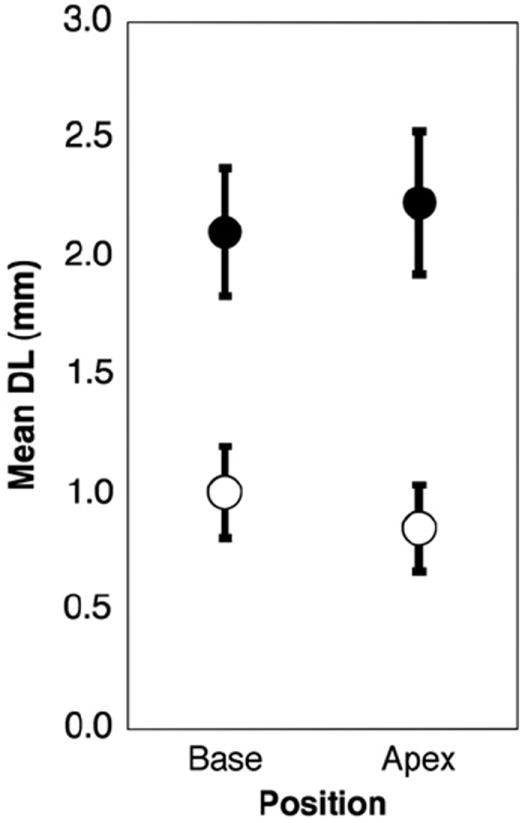
Electrode discrimination as a function of location. Error bars represent standard error of the mean. Open circles are children ages 10 and older, closed circles are children under 10. No significant effect of starting electrode location is seen.
Fig. 12.
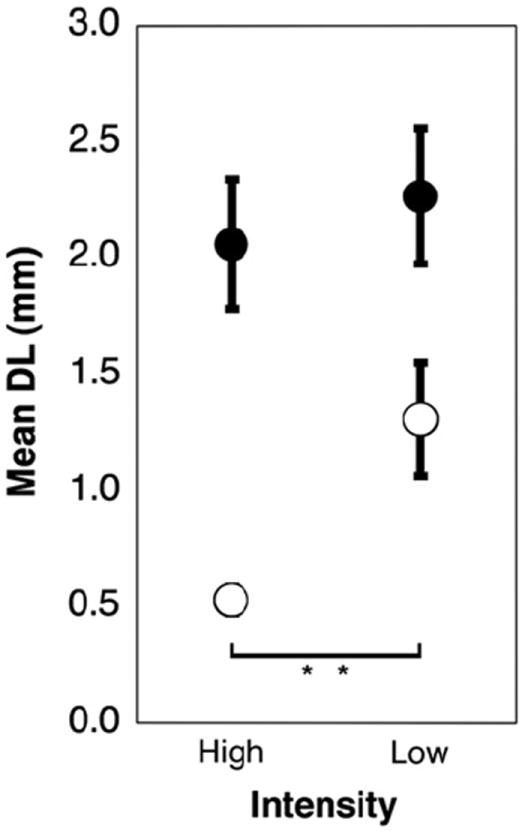
Electrode discrimination as a function of intensity. Error bars represent standard error of the mean. Open circles are children ages 10 and older, closed circles are children under 10. “**” Indicates significance p < 0.01. Children over 10 are significantly better at electrode discrimination when stimulated at the upper end of their dynamic ranges.
4. Discussion
One of the goals of this studywas to validate the 2AFC procedure in young children. We observed that using an engaging video game platform, children as young as three are willing to complete enough presentation trials to collect useful data. The advantage of the 2AFC procedure with the video game interface over other methods is that validity can be assessed quantitatively using the standard deviation of the reversals. Our inclusion criterion was that the standard deviation of the reversals needed to be within twice the mean of the standard deviation of the reversals for older children who clearly understood the task. Seventy-seven percent of our youngest child subjects were within these constraints.
One potential source of measurement error for frequency discrimination is the possibility that children were reacting to amplitude rather than frequency cues. Acoustic frequency discrimination testing was not performed in a sound booth and great lengths were not sought to equate the loudness of the stimuli perceived at the child’s eardrum. The reasons for this were entirely practical. Both normal-hearing and deaf implanted children with a variety of microphone styles may perceive amplitude cues with even the best-calibrated speaker and booth system. Reverberation of the acoustic stimulus generates a standing wave that may also affect stimulus amplitude in an unpredictable fashion. For electrode discrimination, we were able to better control stimulation amplitude through intensities based on a child’s dynamic range, but these measures are imprecise. Roving amplitude, often used in adult psychophysics, was avoided so as not to inadvertently provide an additional criterion for discrimination. Still, for subjects performing both frequency and electrode discrimination, data must be interpreted knowing that amplitude cues may have had a confounding effect.
Test–retest analysis across hearing and deaf subject categories demonstrated developmental effects. For both groups in the acoustic task, the youngest subjects tended to improve in their ability to cue into the frequency difference as trials progressed and had a far higher degree of intersubject variability. For these youngest children a slight decline in performance was seen over the course of multiple electrode discrimination trials. By age 10, however, subjects in all categories ceased to change in their discrimination abilities as trials progressed. These data are consistent with frequency discrimination data from hearing children that show higher thresholds and greater intersubject variability in younger children that may be attributed both to inattentiveness and the cognitively demanding nature of the task (Moore et al., 2007). This inattention improves with cross-modality testing or when the testing takes place in a familiar setting. Furthermore, school-children from ages 8 to10 improve significantly on whole word discrimination and phonemic awareness tasks after undergoing repeated training sessions with a video game interface using simpler stimuli (Moore et al., 2005). These data from hearing children reinforce the centrality of cortical processing and plasticity for tasks of auditory discrimination in this age group.
Normal-hearing children had decreased training effects at a younger age, however, than deaf implanted subjects. This finding may indicate that the degradation of the peripheral auditory stimulus further exacerbates the cognitive challenge or inattentiveness inherent in auditory discrimination tasks for young children.
Deaf children have larger DFs than normal-hearing children. This result was not unexpected given the resolution of a signal processed by a relatively few number of electrodes compared to thousands of sensory cells. The magnitude of the DF difference across age categories is similar (logarithmically). Comparing frequency discrimination across different reference frequencies shows a pattern in children that is similar to previously published data in normal-hearing adults (Yost, 1994). Frequency DF, when plotted logarithmically, increases monotonically with respect to the reference frequency.
With regard to the ability to discriminate between electrodes along their implant arrays, children show a great deal of behavioral variation on our psychophysical task. Children over ten show improvement in discrimination with stimuli at the upper end of their dynamic range irrespective of electrode position. This result concurs with findings in adult cochlear implantees (Pfingst et al., 1999). Intensity has been shown to increase the overlap in auditory nerve fibers stimulated by adjacent electrodes in the pediatric population (Eisen and Franck, 2005). For older children, high intensity stimuli were also more discriminable if the electrode was varied in the basal direction, irrespective of starting location. These findings contradict the idea that discriminability of electrodes relies primarily on spatial separation of electrodes. Unlike previous studies (Wei et al., 2004), our study finds no correlation between performance and electrode location.
We have demonstrated that improvement on auditory discrimination tasks can be elicited with repeated testing over the course of one hour using a video game interface for implanted children as young as four, thus overcoming the inattentiveness barrier inherent in testing children. Auditory research from hearing children indicates that these training effects may translate to greater gains in real-world situations such as speech (Moore et al., 2009). Furthermore, Dawson et al. (2000) found that electrode discrimination as determined by play audiometry is the strongest predictor of speech perception in pediatric cochlear implantees. As such, our 2AFC video game testing paradigm could provide a quantitative and repeatable predictor of speech performance in young children. This platform is inherently flexible and could be altered to test more complex stimuli or use alternate staircase procedures. Such testing could be done either in-office or remotely and provide a valuable adjunct to current audiometric testing. Further testing to ascertain the age-matched correlation between these psychoacoustic measures and clinical tests of speech perception and auditory nerve activity may be warranted.
Abbreviations
- 2AFC
two-alternative forced choice
- T
threshold level
- M
maximum comfort level
- CHOP
Children’s Hospital of Philadelphia
- DF
frequency difference limen (Hz)
- DL
electrode difference limen (mm)
- CI
cochlear implant subjects
- NH
normal-hearing subjects
Footnotes
Sources of support: Deafness Research Foundation, Emil Capita Foundation.
References
- Allen P, Wightman F, Kistler D, Dolan T. Frequency resolution in children. J Speech Hear Res. 1989;32:317–322. doi: 10.1044/jshr.3202.317. [DOI] [PubMed] [Google Scholar]
- Busby PA, Clark GM. Electrode discrimination by early-deafened cochlear implant patients. Audiology. 1996;35:8–22. doi: 10.3109/00206099609071926. [DOI] [PubMed] [Google Scholar]
- Busby PA, Clark GM. Electrode discrimination by early-deafened subjects using the Cochlear limited multiple-electrode cochlear implant. Ear Hear. 2000;21:291–304. doi: 10.1097/00003446-200008000-00004. [DOI] [PubMed] [Google Scholar]
- Busby PA, Tong YC, Clark GM. Electrode position, repetition rate, and speech perception by early- and late-deafened cochlear implant patients. J Acoust Soc Am. 1993;93:1058–1067. doi: 10.1121/1.405554. [DOI] [PubMed] [Google Scholar]
- Collins LM, Zwolan TA, Wakefield GH. Comparison of electrode discrimination, pitch ranking, and pitch scaling data in postlingually deafened adult cochlear implant subjects. J Acoust Soc Am. 1997;101:440–455. doi: 10.1121/1.417989. [DOI] [PubMed] [Google Scholar]
- Cranford JL, Thompson N, Hoyer E, Faires W. Brief tone discrimination by children with histories of early otitis media. J Am Acad Audiol. 1997;8:137–141. [PubMed] [Google Scholar]
- Dawson PW, McKay CM, Busby PA, Grayden DB, Clark GM. Electrode discrimination and speech perception in young children using cochlear implants. Ear Hear. 2000;21:597–607. doi: 10.1097/00003446-200012000-00007. [DOI] [PubMed] [Google Scholar]
- Eisen MD, Franck KH. Electrode interaction in pediatric cochlear implant subjects. J Assoc Res Otolaryngol. 2005;6(2):160–170. doi: 10.1007/s10162-005-5057-2. [DOI] [PMC free article] [PubMed] [Google Scholar]
- Elliott LL, Hammer MA, Scholl ME, Wasowicz JM. Age differences in discrimination of simulated single-formant frequency transitions. Percept Psychophys. 1989;46:181–186. doi: 10.3758/bf03204981. [DOI] [PubMed] [Google Scholar]
- Franck KH, Shah UK, Marsh RR, Potsic WP. Effects of Clarion electrode design on mapping levels in children. Ann Otol Rhinol Laryngol. 2002;111:1128–1132. doi: 10.1177/000348940211101212. [DOI] [PubMed] [Google Scholar]
- Hartley DE, Wright BA, Hogan SC, Moore DR. Age-related improvements in auditory backward masking and simultaneous masking in 6- to 10-year old children. J Speech Lang Hear Res. 2000;43(6):1402–1415. doi: 10.1044/jslhr.4306.1402. [DOI] [PubMed] [Google Scholar]
- Henry BA, McKay CM, McDermott HJ, Clark GM. The relationship between speech perception and electrode discrimination in cochlear implantees. J Acoust Soc Am. 2000;108(3):1269–1280. doi: 10.1121/1.1287711. [DOI] [PubMed] [Google Scholar]
- Irwin RJ, Stillman JA, Schade A. The width of the auditory filter in children. J Exp Child Psychol. 1986;41:429–442. doi: 10.1016/0022-0965(86)90003-2. [DOI] [PubMed] [Google Scholar]
- Laneau J, Boets B, Moonen M, van Wieringen A, Wouters J. A flexible auditory research platform using acoustic or electric stimuli for adults and young children. J Neurosci Methods. 2005;142:131–136. doi: 10.1016/j.jneumeth.2004.08.015. [DOI] [PubMed] [Google Scholar]
- Levitt H. Transformed up-down methods in psychoacoustics. J Acoust Soc Am. 1971;49:467–477. [PubMed] [Google Scholar]
- Moore DR, Rosenberg JF, Coleman JS. Discrimination training of phonemic contrasts enhances phonological processing in mainstream school children. Brain Lang. 2005;94(1):72–85. doi: 10.1016/j.bandl.2004.11.009. [DOI] [PubMed] [Google Scholar]
- Moore DR, Ferguson MA, Halliday LF, Riley A. Frequency discrimination in children: perception, learning and attention. Hear Res. 2007;238(1–2):147–154. doi: 10.1016/j.heares.2007.11.013. [DOI] [PubMed] [Google Scholar]
- Moore DR, Halliday LF, Amitay S. Use of auditory learning to manage listening problems in children. Philos T Roy Soc B. 2009;364(1515):409–420. doi: 10.1098/rstb.2008.0187. [DOI] [PMC free article] [PubMed] [Google Scholar]
- Pfingst BE, Holloway LA, Zwolan TA, Collins LM. Effects of stimulus level on electrode-place discrimination in human subjects with cochlear implants. Hear Res. 1999;134:105–115. doi: 10.1016/s0378-5955(99)00079-9. [DOI] [PubMed] [Google Scholar]
- Thompson NC, Cranford JL, Hoyer E. Brief-tone frequency discrimination by children. J Speech Lang Hear Res. 1999;42:1061–1068. doi: 10.1044/jslhr.4205.1061. [DOI] [PubMed] [Google Scholar]
- Throckmorton CS, Collins LM. Investigation of the effects of temporal and spatial interactions on speech-recognition skills in cochlear-implant subjects. J Acoust Soc Am. 1999;105:861–873. doi: 10.1121/1.426275. [DOI] [PubMed] [Google Scholar]
- Wei CG, Cao KL, Chen XW, Jin X, Zheng ZY, Zeng FG. Tone recognition and electrode discrimination in prelingually deafened cochlearimplant listeners. Zhonghua Er Bi Yan Hou Ke Za Zhi. 2004;39(2):73–76. in Chinese. [PubMed] [Google Scholar]
- Wier CC, Jesteadt W, Green DM. Frequency discrimination as a function of frequency and sensation level. J Acoust Soc Am. 1977;61:178–184. doi: 10.1121/1.381251. [DOI] [PubMed] [Google Scholar]
- Yost WA. Fundamentals of Hearing: an Introduction. Academic Press; San Diego: 1994. [Google Scholar]
- Zeng FG, Shannon RV. Loudness balance between electric and acoustic stimulation. Hear Res. 1992;60(2):231–235. doi: 10.1016/0378-5955(92)90024-h. [DOI] [PubMed] [Google Scholar]
- Zwolan TA, Collins LM, Wakefield GH. Electrode discrimination and speech recognition in postlingually deafened adult cochlear implant subjects. J Acoust Soc Am. 1997;102:3673–3685. doi: 10.1121/1.420401. [DOI] [PubMed] [Google Scholar]


