

Abstract
Background.
Middle-aged and older adults with diabetes are heterogeneous and may be characterized as belonging to one of three clinical groups: a relatively healthy group, a group having characteristics likely to make diabetes self-management difficult, and a group with poor health status for whom current management targets have uncertain benefit.
Methods.
We analyzed waves 2004–2008 of the Health and Retirement Study and the supplemental Health and Retirement Study 2003 Diabetes Study. The sample included adults with diabetes 51 years and older (n = 3,507, representing 13.6 million in 2004). We investigated the mortality outcomes for the three clinical groups, using survival analysis and Cox proportional hazard models.
Results.
The 5-year survival probabilities were Relatively Healthy Group, 90.8%; Self-Management Difficulty Group, 79.4%; and Uncertain Benefit Group, 52.5%. For all age groups and clinical groups, except those 76 years and older in the Uncertain Benefit Group, survival exceeded 50%.
Conclusions.
This study reveals the substantial survival of middle-aged and older adults with diabetes, regardless of health status. These findings have implications for the clinical management of and future research about diabetes patients with multiple comorbidities.
Keywords: Diabetes, Mortality, Comorbidity, Cognitive impairment, Disability
The aim of type 2 diabetes management is to prevent diabetes complications or the worsening of existing complications. To achieve this, patients must follow a multipronged self-management regimen, generally involving several (or many) medications and difficult behavioral changes. The efficacy of these interventions depends on the ability of patients to self-manage their diabetes and on patients’ surviving long enough to experience treatment benefit.
However, older type 2 diabetes patients are a heterogeneous group (1,2). Most are relatively healthy and capable of self-management; others have health-related or psychosocial challenges that can impair their ability to follow a complicated regimen, and some with poor health status may have decreased expected survival (3). Older adults, particularly those over 75 years old and those with multiple comorbidities or functional disability, have been underrepresented in the studies that have provided the evidence for current diabetes management (4). So, it is not clear to what extent current guidelines and targets are applicable to their disease circumstances.
Previously, using a combination of clinical and functional criteria, we characterized middle-aged and older adults with diabetes as belonging to one of three clinical groups: a relatively healthy group, a group having characteristics likely to make diabetes self-management difficult, and a group with poor health status for whom current diabetes management targets may not yield benefit (5). Using population-based survey data, we investigated the prevalence of these clinical groups by age, and we examined the sociodemographic and diabetes characteristics of the groups. We found that adults in the older age groups were more likely to have difficulty in self-managing their diabetes and to have poor health status. Yet, we also found that middle-aged adults constituted the largest absolute number of diabetes patients likely to have difficulty in self-management; this age group also contributed sizeable numbers to the poor health status-uncertain benefit clinical group.
Complex and poor health status, with a burden of comorbidities, functional impairment, and often cognitive impairment, confuses notions of appropriate diabetes management (6–10). Indeed, what constitutes quality of care for diabetes patients with complex health status has yet to be determined. Such patients would be expected to have limited survival. Although researchers have investigated the mortality outcomes of older adults with diabetes, no large studies have focused on the mortality of diabetes patients in relation to multifaceted clinical complexity, including their existing diabetes complications, geriatric conditions, and functional impairment (11,12).
The goal of this study was to investigate the mortality of the clinical groups that we had previously described and to examine age, other sociodemographic characteristics, and certain diabetes characteristics as predictors of mortality. We hypothesized that adults with difficulty in self-management and adults with poor health status would have substantial all-cause mortality, beyond that associated with age.
METHODS
Study Design
We performed secondary analysis of population-based longitudinal health interview survey data.
Data
The data used in this study are from the 2004, 2006, and 2008 waves of the Health and Retirement Study (HRS) and from the supplemental HRS 2003 Diabetes Study (13,14). The HRS is a nationally representative longitudinal health interview survey of a cohort of adults age 51 years and older in the United States. It is sponsored by the National Institute on Aging and performed by the Institute for Social Research at the University of Michigan. Its 2003 Diabetes Study surveyed respondents with diabetes about their diabetes treatment and self-management; included was a self-administered finger-stick kit to collect blood spot samples to measure respondents’ hemoglobin A1c (HbA1c) levels (15).
The HRS was approved by the Health Sciences Institutional Review Board at the University of Michigan. The data used for this analysis are publicly available and contain no unique identifiers, thus assuring respondent anonymity.
Study Population
Of the 18,937 HRS respondents interviewed in 2004 whose age was 51 years and older, we identified 3,507 respondents who reported being told by a doctor that they had diabetes or high blood sugar. These respondents, who included adults living in the community and those residing in long-stay nursing facilities, represent 13.6 million adults 51 years and older with diabetes in the United States in that year. When the respondent was unable to be interviewed (eg, due to medical and/or cognitive problems), a proxy respondent (n = 371), most often the spouse (n = 227), was enlisted to answer questions for that respondent according to study protocol.
Of the 3,507 respondents 51 years and older who reported having diabetes in 2004, 1,690 participated in the HRS 2003 Diabetes Study, and, of those, 1,136 had HbA1c values available from this study (15). The 2003 Diabetes Study surveyed only community-dwelling respondents and did not include those living in long-stay nursing facilities. Also of note, the HRS is refreshed every 6 years (eg, 1998, 2004), adding a new cohort of adults 51–56 years old. Therefore, the age range of respondents in the Diabetes Study in 2003—1 year prior to the addition of a new cohort—was 56 years and older.
Description of Health Status in Diabetes
We previously defined three health status groups, drawing upon clinical insight and the medical literature (5). These clinical groups are mutually exclusive and together include all respondents.
- Relatively Healthy Group. Characterized by:
- Two or fewer comorbid chronic diseases,
- No vision impairment,
- No cognitive impairment,
- Dependency in no more than one instrumental activity of daily living (IADL),
- Dependency in no more than one activity of daily living (ADL), AND
- Not living in a long-stay nursing facility.
- Self-Management Difficulty Group. Characterized by:
- Three or more comorbid chronic diseases,
- Severe vision impairment,
- Mild cognitive impairment, OR
- Dependency in two or more IADLs.
- Uncertain Benefit Group (previously designated Limited Benefit Group). Characterized by:
- Dementia,
- Dependency in two or more ADLs, OR
- Living in a long-stay nursing facility.
Variables and Their Measurement
Comorbid Chronic Diseases.—
The HRS provides self-report information on a number of chronic diseases (in addition to diabetes): hypertension, heart disease, chronic lung disease, cancer, musculoskeletal conditions, stroke, and psychiatric problems. Respondents reported whether or not a physician had diagnosed them with each disease. Questions about the diseases included those indicating disease activity or severity (eg, requiring medication). Because we also examined disability, we attempted to avoid activity/severity indicators that were inherently functional in nature. In our analyses, we limited chronic diseases to their active/severe forms (16,17). We summed the seven diseases to derive a count of comorbid diseases.
Vision Impairment.—
We defined vision impairment as blindness or poor eyesight despite use of corrective lenses.
Cognitive Impairment.—
The HRS assesses for cognitive impairment in one of two ways (16,18,19). For self-respondents, the presence of cognitive impairment is determined using a performance-based measure, a modified version of the Telephone Interview for Cognitive Status, a validated cognitive screening instrument patterned on the Mini-Mental State Examination and specifically designed for population-based studies. We defined dementia as a score of 0–6 on the 27-point cognitive scale; we defined mild cognitive impairment (cognitive impairment, no dementia) as a score of 7–11.
For respondents unable to complete the interview, we made use of an 11-point scale comprised of the proxy’s assessment of the respondent’s memory (excellent – 0, very good – 1, good – 2, fair – 3, and poor – 4); the proxy’s assessment of the respondent’s IADL difficulties (ranging from 0 to 5); and the interviewer’s assessment of the respondent’s cognitive impairment (no impairment – 0, may have impairment – 1, and has impairment – 2). The scale was divided into the three cognitive categories: normal, 0–2; mild cognitive impairment, 3–5; and dementia, 6–11. (The respondent and proxy cognitive scales are modifications of the scales used in the analyses of our previously published study [20]).
Disability.—
ADLs included bathing, dressing, eating, toileting, and transferring; IADLs included meal preparation, shopping, money management, telephone use, and taking medications. We determined the number of respondents reporting ADL and IADL dependencies in two steps: first, those who reported having difficulty with the task or inability to perform the task because of health or memory problems (difficulty), and, second, those who reported both having difficulty with and receiving assistance for the task (dependency).
Living Status.—
We defined residence in a long-stay nursing facility as including only respondents living in nursing facilities long term for custodial care, not those residing short term in subacute, rehabilitation, or skilled nursing facilities.
Sociodemographic Characteristics.—
Sociodemographic variables included age, gender, race (Caucasian, African American, and Hispanic), living arrangement (married, unmarried living with other[s], and unmarried living alone), educational attainment, and net worth (13). We divided respondents into three age groups: 51–64 years old (middle-aged, currently included in denominators for clinical performance targets); 65–75 years old (Medicare population, also currently included in denominators for these targets); and 76 years and older (Medicare population, not currently included in denominators for clinical performance targets).
Indicators for Diabetes Complications.—
For the subsample of respondents who participated in the HRS 2003 Diabetes Study, we examined two indicators, or risks, for poor diabetes outcomes: use of insulin and level of HbA1c (15).
Mortality.—
The HRS conducts exit interviews with designated proxy respondents for those HRS respondents who have died. These HRS mortality data are cross-referenced with the National Center for Health Statistics National Death Index.
Statistical Analysis
The HRS employs a multistage probability sample of households that is nationally representative. To adjust for the complex sample design of the HRS and the differential probability of selection and for nonresponse, all analyses were weighted and adjusted using the statistical package STATA (Release 10.1.; Stata Corp, College Station, TX); for the multivariate survival analyses, SUDAAN 10 was used. The 2004 wave of the HRS and the HRS 2003 Diabetes Study have different sets of respondent weights, each set specific to each sample. Thus, we were able to take advantage of the nationally representative data set to produce national population estimates and parameters for our full 2004 wave sample (n = 3,507) analyses and for our 2003 subsample (n = 1,690) analyses.
We used standard descriptive methods (frequencies, means, and standard deviations) to estimate the prevalence of respondents meeting criteria for the clinical groups and to make comparisons among groups (weighted Chi square test). We performed survival analysis (Kaplan Meier survival curves) based on the respondents’ health status at baseline. The time of interest extended from the month of the 2004 wave interview for each respondent (eg, February, 2004) to December, 2008, with a mean follow-up for the study sample of 49.0 months. To further investigate mortality, we performed step-wise Cox proportional hazard models for the full 2004 wave sample and for the 2003 subsample. In these models, we incorporated respondents’ updated health status (membership in one of the three clinical groups), using data from the 2006 and 2008 waves. Here also the time of interest was from the month of each respondent’s 2004 wave interview to December, 2008. Models were adjusted for clinical group, age, gender, race, living arrangement, education, and net worth. As a last step, we introduced age group-clinical group interaction terms into the hazard models, to enable examination of the relationship between age and health status in contributing to mortality. We used the combination of the age group 51–64 years old and the Relatively Healthy clinical group as the reference; we then analyzed the hazard ratios for the eight interaction terms (eight combinations of the age groups and the clinical groups).
RESULTS
Table 1 shows the respondents’ sociodemographic characteristics for the 2004 wave, first, for the entire sample of respondents reporting diabetes (column 1) and, next, for each clinical group (columns 2–4). These proportions are weighted to be representative of adults aged 51 years and older with diabetes in the United States in 2004. (Differences in the estimates and prevalences in Table 1 from those in our previously published study are primarily due to our use of the revised cognitive scales.) Of the 13.6 million adults 51 years and older with diabetes, our analyses estimated that 7.7 million were relatively healthy, 4.3 million had clinical characteristics likely to make self-management difficult, and 1.6 million had characteristics consistent with uncertain benefit from current management interventions. As noted in our previous study, although older adults were overrepresented in the Self-Management Difficulty Group, middle-age adults contributed the largest numbers to this clinical group (approximately 1.7 million people nationally). Similarly, although adults 76 years and older contributed the largest number (700,000) and largest percentage (44.1%) to the Uncertain Benefit Group, adults 51–64 years old and adults 65–75 years old combined to contribute 900,000 individuals to this group. In contrast, although adults 76 years and older were underrepresented in the Relatively Healthy Group, this clinical group included a sizeable percentage (13.6%) and number (1 million) of these older adults.
Table 1.
Characteristics of the Study Population, Overall and by Clinical Groups
| Weighted Percentage* | ||||
| Total | Relatively Healthy | Self-Management Difficulty | Uncertain Benefit | |
| n = 3,507 representing 13.6 million | n = 1,836 representing 7.7 million | n = 1,164 representing 4.3 million | n = 507 representing 1.6 million | |
| Age (years) | ||||
| 51–64 | 47.4 (6.4 million) | 55.7 (4.3 million) | 40.8 (1.7 million) | 24.9 (400,000) |
| 65–75 | 30.5 (4.1 million) | 30.7 (2.4 million) | 29.8 (1.3 million) | 31.0 (500,000) |
| ≥76 | 22.2 (3.0 million) | 13.6 (1.0 million) | 29.3 (1.2 million) | 44.1 (700,000) |
| p Value | <.001 | |||
| Gender | ||||
| Female | 51.3 | 46.5 | 57.3 | 58.6 |
| p Value | <.001 | |||
| Race | ||||
| White | 75.1 | 81.4 | 67.9 | 64.3 |
| African American | 15.3 | 12.1 | 18.3 | 22.3 |
| Hispanic | 9.6 | 6.5 | 13.8 | 13.4 |
| p Value | <.001 | |||
| Living arrangement | ||||
| Married | 59.6 | 66.8 | 51.0 | 48.0 |
| Unmarried living with other(s) | 17.1 | 12.8 | 22.8 | 22.8 |
| Unmarried living alone | 23.3 | 20.4 | 26.2 | 29.2 |
| p Value | <.001 | |||
| Education (years) | ||||
| <12 | 30.4 | 16.7 | 45.0 | 57.2 |
| 12 | 33.2 | 35.5 | 32.0 | 25.5 |
| >12 | 36.4 | 47.9 | 23.0 | 17.3 |
| p Value | <.001 | |||
| Net worth (dollars) | ||||
| ≤40,000 | 34.5 | 24.7 | 43.3 | 58.0 |
| 40,001–155,000 | 29.0 | 30.5 | 27.6 | 25.9 |
| 155,001–420,000 | 22.6 | 27.2 | 18.9 | 10.4 |
| >420,000 | 13.9 | 17.7 | 10.3 | 5.7 |
| p Value | <.001 | |||
Note: Population estimates for the age groups are rounded to the nearest 100,000. The columns present the percentages of the total population (column 1) and the respective clinical groups (columns 2, 3, and 4) for each variable. Proportions are related to the columns and not the rows; the columns for each variable (not the rows) add to 100%. For example, of those respondents in the Relatively Healthy Group, 55.7% are 51–64 years old, 30.7% are 65–75 years old, and 13.6% are 76 years and older. p Value from the χ2 test for the association between the indicated variable and belonging to the Clinical Groups.
Weighted percentages (and population estimates) were derived using Health and Retirement Study respondent population weights to adjust for differential probability of selection into the sample and differential nonresponse.
Figure 1 illustrates the unadjusted survival curves for the three clinical groups. The survival probabilities for the groups at 5 years were: Relatively Healthy Group, 90.8%; Self-Management Difficulty Group, 79.4%; and Uncertain Benefit Group, 52.5%.
Figure 1.
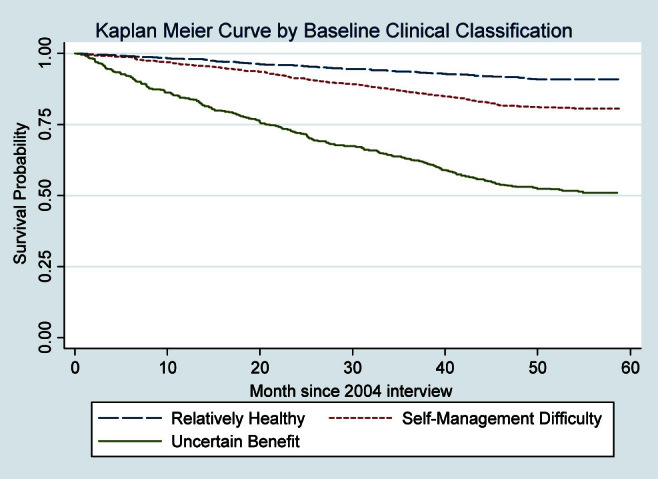
Kaplan Meier survival curves for diabetes clinical groups. Weighted percentages were derived using Health and Retirement Study respondent population weights to adjust for differential probability of selection into the sample and differential nonresponse.
Table 2 provides the distribution (bivariate) of respondents’ characteristics by their mortality status at 5 years. Adults 76 years and older had 35.0% mortality, compared with 11.7% for the 51- to 64-year old age group and 14.7% for the 65- to 75-year old age group. Respondents who were unmarried, those with less education, and those with lower net worth also had increased mortality. There were no associations of gender or race with mortality. For the subsample of respondents who participated in the 2003 Diabetes Study, use of insulin (in 2003) predicted increased mortality (28.9% vs 17.3%). There was no association between HbA1c values in 2003 and subsequent mortality.
Table 2.
Distribution of Respondent Characteristics by 5-Y Mortality
| Weighted Percentage* | |
| Total Sample (n = 3,507) | Alive N = 2,866 |
| Clinical group | |
| Relatively healthy | 90.8 |
| Self-management difficulty | 79.4 |
| Uncertain benefit | 52.5 |
| p Value | <.001 |
| Age (years) | |
| 51–64 | 89.3 |
| 65–75 | 85.3 |
| ≥76 | 65.0 |
| p Value | <.001 |
| Gender | |
| Male | 81.8 |
| Female | 83.5 |
| p Value | .4 |
| Race | |
| White | 82.0 |
| African American | 83.4 |
| Hispanic | 86.9 |
| p Value | .08 |
| Living arrangement | |
| Married | 86.7 |
| Unmarried living with other(s) | 78.3 |
| Unmarried living alone | 75.5 |
| p Value | <.001 |
| Education (years) | |
| <12 | 77.8 |
| 12 | 82.7 |
| >12 | 86.8 |
| p Value | <.001 |
| Net Worth (dollars) | |
| ≤40,000 | 77.7 |
| 40,001–155,000 | 84.3 |
| 155,001–420,000 | 84.4 |
| >420,000 | 88.9 |
| p Value | <.001 |
| Use of insulin | |
| Yes | 71.1 |
| No | 82.7 |
| p Value | <.001 |
| HbA1c (N = 1,136; mean ±SE) | 7.4 ± 0.07† |
| p Value | 0.6 |
Note: Proportions are related to the rows and not the columns; the rows for each variable (not the columns) add to 100%. p Value from the χ2 test for the association between the indicated variable and 5-y mortality.
Weighted percentages were derived using Health and Retirement Study respondent population weights to adjust for differential probability of selection into the sample and differential nonresponse.
For comparison, the HbA1c (mean ± SE) for 314 subsample respondents who died was 7.3 ± 0.1.
Figure 2 depicts mortality at 5 years for the respondents stratified by both age and clinical groups. Adults 51–64 years old and those 65–75 years old had similar mortality when in the Relatively Healthy Group (approximately 8%) and in the Self-Management Difficulty Group (approximately 16%). However, mortality for adults 65–75 years old in the Uncertain Benefit Group (41.8%) was twice that for adults 51–64 years old in the same group (18.0%). In contrast to the two younger groups, mortality was substantially increased for adults 76 years and older for each of the clinical groups, reaching 68.1% for the Uncertain Benefit Group.
Figure 2.
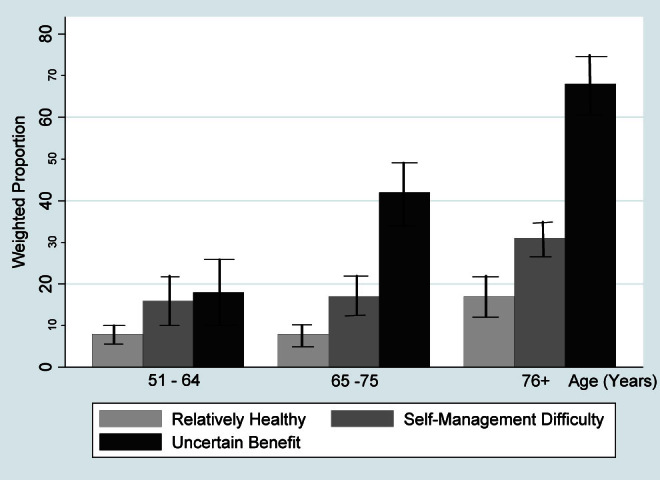
Mortality at 5 y by age and clinical groups. Weighted percentages were derived using Health and Retirement Study respondent population weights to adjust for differential probability of selection into the sample and differential nonresponse.
We next examined the association between the clinical groups and mortality (Table 3). Using the Relatively Healthy Group as the reference, the unadjusted hazard ratio for mortality for the Self-Management Difficulty Group was 2.4 (95% confidence interval 1.9–3.1) and for the Uncertain Benefit Group was 7.1 (95% confidence interval 5.6–9.0). These hazard ratios remained statistically significant in our model adjusting for sociodemographic characteristics (age, gender, race, living arrangement, education, and net worth): Model 1 (column 1): 2.0 for the Self-Management Difficulty Group and 5.5 for the Uncertain Benefit Group. We found similar hazard ratios for the clinical groups in the model examining the subsample of respondents who participated in the 2003 Diabetes Study (Model 3 [column 3]). Here, use of insulin was also a predictor of mortality (hazard ratio 1.6).
Table 3.
Hazard Ratios of Adjusted Time to Death (2004–2008)
| Hazard Ratio* (95% Confidence Interval) | |||
| Total Sample (2004 wave), N = 3,507 | Total Sample (2004 wave), N = 3,507 | Subsample (2003 Diabetes Study), N = 1,690 | |
| Clinical group | |||
| Self-management difficulty | 2.0 (1.5–2.5) | 1.7 (1.2–2.4) | |
| Uncertain benefit | 5.5 (4.3–7.2) | 5.5 (3.8–7.9) | |
| Age (years) | |||
| 65–75 | 1.4 (1.1–1.9) | 1.2 (0.8–1.8) | |
| ≥76 | 2.4 (1.8–3.1) | 2.0 (1.4–3.0) | |
| Age group—clinical group interaction term | |||
| 51–64—Self-management difficulty | 2.0 (1.2–3.2) | ||
| 51–64—Uncertain benefit | 2.2 (1.1–4.3) | ||
| 5–75—Relatively healthy | 1.1 (0.7–1.7) | ||
| 65–75—Self-management difficulty | 2.4 (1.6–3.7) | ||
| 65–75—Uncertain benefit | 7.0 (4.5–10.8) | ||
| ≥76—Relatively healthy | 1.6 (1.0–2.6) | ||
| ≥76—Self-management difficulty | 3.5 (2.3–5.3) | ||
| ≥76—Uncertain benefit | 12.7 (8.7–18.6) | ||
| Gender | |||
| Female | 0.6 (0.5–0.8) | 0.6 (0.5–0.8) | 0.8 (0.6–1.1) |
| Race | |||
| African American | 0.7 (0.5–0.9) | 0.7 (0.5–0.9) | 0.7 (0.5–1.1) |
| Hispanic | 0.6 (0.4–0.8) | 0.6 (0.4–0.8) | 0.8 (0.5–1.1) |
| Living arrangement | |||
| Unmarried living with other(s) | 1.6 (1.2–2.1) | 1.6 (1.2–2.2) | 1.6 (1.1–2.3) |
| Unmarried living alone | 1.4 (1.1–1.8) | 1.5 (1.2–1.8) | 1.1 (0.8–1.6) |
| Education (years) | |||
| 12 | 1.1 (0.9–1.4) | 1.1 (0.9–1.4) | 1.2 (0.9–1.6) |
| >12 | 1.1 (0.8–1.4) | 1.1 (0.8–1.4) | 1.3 (0.9–1.8) |
| Net worth (dollars) | |||
| 40,001–155,000 | 0.8 (0.6–1.0) | 0.8 (0.6–1.0) | 0.9 (0.7–1.3) |
| 155,001–420,000 | 0.9 (0.7–1.2) | 0.9 (0.7–1.2) | 1.0 (0.7–1.5) |
| >420,000 | 0.6 (0.4–0.9) | 0.6 (0.4–0.9) | 0.6 (0.4–1.0) |
| Use of insulin | |||
| Yes | 1.6 (1.2–2.1) | ||
Note: Models were adjusted for clinical group, age, gender, race, living arrangement, education, and net worth (Referent groups: Clinical Group, Relatively Healthy; Age, 51–64 years old; Gender, Male; Race, Caucasian; Living Arrangement, Married; Education, <12 years; Net Worth, ≤40,000 dollars). Model 2 included age group—clinical group interaction terms (referent group: 65–75 years old—Relatively Healthy Group). Model 3 was also adjusted for use of insulin (referent group: No).
Hazard ratios were derived using Health and Retirement Study respondent population weights to adjust for differential probability of selection into the sample and differential nonresponse.
As a final step, we tested Model 1 for interactions and found a statistically significant age group-clinical group interaction (Model 2 [column 2]). Two interaction terms proved to be significant and substantial in the positive direction: the combination of age group 65–75 years old and the Uncertain Benefit Group (hazard ratio 7.0) and the combination of age group 76 years and older and the Uncertain Benefit Group (hazard ratio 12.7). The interaction was driven by membership in the Uncertain Benefit Group, such that both adults 65–75 years old in the Uncertain Benefit Group and adults 76 years and older in the Uncertain Benefit Group had substantially increased likelihood of mortality, beyond the effect of age and the effect of being in the Uncertain Benefit Group when considered individually.
DISCUSSION
This study examines the mortality of middle-aged and older adults with diabetes in relation to the complexity of their health status. It builds on our previous work that characterized adults with diabetes as relatively healthy, likely to have difficulty in diabetes self-management, or having poor health status leading to uncertain benefit from current management interventions (5). Confirming our hypothesis, we found that health status (Relatively Healthy, Self-Management Difficulty, and Uncertain Benefit groups) predicted future mortality. Yet, more significantly, this study reveals the substantial survival of middle-aged and older adults with diabetes, regardless of health status. For all age groups and clinical groups, except adults 76 years and older in the Uncertain Benefit Group, survival at 5 years exceeded 50%.
Clinically, these findings contribute to the current discussion about the appropriate quality guidelines and targets in the care of older diabetes patients and about the means needed to achieve them (6–10). Large numbers of middle-aged and older adults with diabetes have characteristics likely to make self-management of their diabetes difficult (1–3). However, the substantial survival of the Self-Management Difficulty Group, even among the oldest adults, indicates the potential benefit for these patients of pursuing interventions that prevent or delay the onset or worsening of macrovascular and microvascular diabetes complications. For such interventions to be successful, these patients require additional support to perform self-management, whether provided by the health care system or by personal caregivers (formal or informal).
Adults 51–75 years old with diabetes who had dementia, had ADL dependency, or resided in long-stay nursing facilities likewise had substantial 5-year survival. Discussion with these patients and their families about the benefits and the risks and burdens of current diabetes management and about their personal goals of care is required.
Diabetes patients in the Self-Management Difficulty Group and the Uncertain Benefit Group have not been well represented in the large clinical trials that have produced much of the evidence for current management interventions (4). Rather, these trials have typically enrolled middle-aged adults who are relatively healthy. Yet, our study found that relatively healthy 65- to 75-year old adults had the same 5-year survival as the younger cohort. It remains to be demonstrated that the outcomes found in younger healthier adults with diabetes can be reproduced in older age groups and in those with complex health status. Nonetheless, our findings suggest that older, more clinically complex, adults may well survive long enough to experience treatment benefit, for both primary and secondary prevention.
Our findings add to the literature of quality assessment in diabetes care (6–10). The finding that medically complex patients survive to 5 years suggests that these patients may be appropriate to include in assessments of clinical quality (ie, to include in quality assessment denominators). Determinations of quality at the institution and system level may benefit from additional measures of quality that take into account health status complexity and other issues relevant to older adults (eg, geriatric conditions such as falling).
A strength of this research is that it is based on a large, nationally representative longitudinal survey (HRS) that provides detailed data on chronic diseases, task-specific disabilities, and mortality and includes a performance-based determination of cognitive ability. Further, the HRS samples across the age range of older adults, including the oldest old, and it samples both community-dwelling and nursing facility respondents.
This study has several limitations. First, the HRS is based on self-report data. In particular, the diagnosis of diabetes is self-reported, with no distinction between type 1 and type 2 diabetes. HbA1c data were limited to respondents who participated in the 2003 Diabetes Study, which had only a 48% usable rate; it is possible that a larger sample size could have produced significant findings. Also, we were unable to examine the roles of diabetes duration and of age of diabetes onset. Last, our analyses examined survival and mortality and not life expectancy.
This study found substantial survival for middle-aged and older adults with diabetes, regardless of the complexity of their health status. Clinically, these findings have implications for the management of older diabetes patients with comorbidity and disability burdens. At a policy level, these findings have implications for how older complex diabetes patients can be supported in their self-management and in how the quality of their care is best assessed. At a research level, these findings support the inclusion of older complex patients in clinical trials, to determine whether their outcomes replicate those of younger healthier diabetes patients. Such trials will also benefit from examining the trajectories of diabetes patients with varying ages of onset and with varying disease durations to determine efficacy of interventions.
FUNDING
Dr. C.T.C. was supported by a Mentored Clinical Scientist Research Career Development Award (5K08AG031837) from the National Institute on Aging, the Claude D. Pepper Older Americans Independence Center at the University of Michigan, the John A. Hartford Foundation Center of Excellence in Geriatrics at the University of Michigan, and the Ann Arbor VA Geriatric Research, Education and Clinical Center (GRECC). Dr. P.G.L. was supported by the Claude D. Pepper Older Americans Independence Center at the University of Michigan, the John A. Hartford Foundation Center of Excellence in Geriatrics at the University of Michigan, and the Ann Arbor VA GRECC. Dr. C.S.B. was supported by the Agency for Health care Research and Quality (1R24HS019459-01) and the Ann Arbor VA GRECC. The National Institute on Aging provided funding for the Health and Retirement Study (U01 AG09740), data from which were used in this study. An early version of this article was presented at the 2011 Annual Meeting of the Gerontological Society of America.
References
- 1.Selvin E, Coresh J, Brancati FL. The burden and treatment of diabetes in elderly individuals in the U.S. Diabetes Care. 2006;29(11):2415–2419. doi: 10.2337/dc06-1058. [DOI] [PubMed] [Google Scholar]
- 2.Suh DC, Kim CM, Choi IS, Plauschinat CA. Comorbid conditions and glycemic control in elderly patients with type 2 diabetes mellitus, 1988 to 1994 to 1999 to 2004. J Am Geriatr Soc. 2008;56(3):484–492. doi: 10.1111/j.1532-5415.2007.01563.x. [DOI] [PubMed] [Google Scholar]
- 3.Feil DG, Zhu CW, Sultzer DL. The relationship between cognitive impairment and diabetes self-management in a population-based community sample of older adults with Type 2 diabetes. J Behav Med. 2012;35(2):190–199. doi: 10.1007/s10865-011-9344-6. [DOI] [PubMed] [Google Scholar]
- 4.Cigolle CT, Blaum CS, Halter JB. Diabetes and cardiovascular disease prevention in older adults. Clin Geriatr Med. 2009;25(4):607–641. doi: 10.1016/j.cger.2009.09.001. vii-viii. [DOI] [PubMed] [Google Scholar]
- 5.Blaum C, Cigolle CT, Boyd C, et al. Clinical complexity in middle-aged and older adults with diabetes: the Health and Retirement Study. Med Care. 2010;48(4):327–334. doi: 10.1097/mlr.0b013e3181ca4035. [DOI] [PMC free article] [PubMed] [Google Scholar]
- 6.Aron D, Pogach L. Transparency standards for diabetes performance measures. JAMA. 2009;301(2):210–212. doi: 10.1001/jama.2008.930. [DOI] [PubMed] [Google Scholar]
- 7.Boyd CM, Darer J, Boult C, Fried LP, Boult L, Wu AW. Clinical practice guidelines and quality of care for older patients with multiple comorbid diseases: implications for pay for performance. JAMA. 2005;294(6):716–724. doi: 10.1001/jama.294.6.716. [DOI] [PubMed] [Google Scholar]
- 8.Meduru P, Helmer D, Rajan M, Tseng CL, Pogach L, Sambamoorthi U. Chronic illness with complexity: implications for performance measurement of optimal glycemic control. J Gen Intern Med. 2007;22(suppl 3):408–418. doi: 10.1007/s11606-007-0310-5. [DOI] [PMC free article] [PubMed] [Google Scholar]
- 9.Pogach L, Aron DC. Sudden acceleration of diabetes quality measures. JAMA. 2011;305(7):709–710. doi: 10.1001/jama.2011.153. [DOI] [PubMed] [Google Scholar]
- 10.Pogach LM, Rajan M, Maney M, Tseng CL, Aron DC. Hidden complexities in assessment of glycemic outcomes: are quality rankings aligned with treatment? Diabetes Care. 2010;33(10):2133–2139. doi: 10.2337/dc09-1665. [DOI] [PMC free article] [PubMed] [Google Scholar]
- 11.Barnett KN, McMurdo MET, Ogston SA, Morris AD, Evans JMM. Mortality in people diagnosed with type 2 diabetes at an older age: a systematic review. Age and Ageing. 2006;35:463–468. doi: 10.1093/ageing/afl019. [DOI] [PubMed] [Google Scholar]
- 12.McEwen LN, Kim C, Karter AJ, et al. Risk factors for mortality among patients with diabetes: the Translating Research Into Action for Diabetes (TRIAD) Study. Diabetes Care. 2007;30(7):1736–1741. doi: 10.2337/dc07-0305. [DOI] [PubMed] [Google Scholar]
- 13.Juster FT, Suzman R. An overview of the health and retirement study. J Hum Resour. 1995;30:S7–S56. [Google Scholar]
- 14.Soldo BJ, Hurd MD, Rodgers WL, Wallace RB. Asset and Health Dynamics Among the Oldest Old: An overview of the AHEAD study. J Gerontol B Psychol Sci Soc Sci. 1997;52:1–20. doi: 10.1093/geronb/52b.special_issue.1. [DOI] [PubMed] [Google Scholar]
- 15.Heisler M, Faul JD, Hayward RA, Langa KM, Blaum C, Weir D. Mechanisms for racial and ethnic disparities in glycemic control in middle-aged and older Americans in the health and retirement study. Arch Intern Med. 2007;167(17):1853–1860. doi: 10.1001/archinte.167.17.1853. [DOI] [PubMed] [Google Scholar]
- 16.Cigolle CT, Langa KM, Kabeto MU, Blaum CS. Setting eligibility criteria for a care-coordination benefit. J Am Geriatr Soc. 2005;53(12):2051–2059. doi: 10.1111/j.1532-5415.2005.00496.x. [DOI] [PubMed] [Google Scholar]
- 17.Cigolle CT, Langa KM, Kabeto MU, Tian Z, Blaum CS. Geriatric conditions and disability: the Health and Retirement Study. Ann Intern Med. 2007;147(3):156–164. doi: 10.7326/0003-4819-147-3-200708070-00004. [DOI] [PubMed] [Google Scholar]
- 18.Blaum CS, Ofstedal MB, Liang J. Low cognitive performance, comorbid disease, and task-specific disability: Findings from a nationally representative survey. J Gerontol Med Sci. Aug 2002;57(8):M523–M531. doi: 10.1093/gerona/57.8.m523. [DOI] [PubMed] [Google Scholar]
- 19.Herzog AR, Wallace RB. Measures of cognitive functioning in the AHEAD study. J Gerontol B Psychol Sci Soc Sci. 1997;52:37–48. doi: 10.1093/geronb/52b.special_issue.37. [DOI] [PubMed] [Google Scholar]
- 20.Crimmins EM, Kim JK, Langa KM, Weir DR. Assessment of cognition using surveys and neuropsychological assessment: the Heath and Retirement Study and the Aging, Demographics, and Memory Study. J Gerontol B Psychol Sci Soc Sci. 2011;66B(S1):il62–il71. doi: 10.1093/geronb/gbr048. [DOI] [PMC free article] [PubMed] [Google Scholar]