

Chronic liver disease can progress to cirrhosis if not detected early and appropriate interventions taken when possible. Serum levels of alanine aminotransferase (ALT, SGPT) and aspartate aminotransferase (AST, SGOT) are commonly measured during routine health care to detect such unsuspected liver disease. Care providers often use the reporting laboratory’s ALT upper reference limit (upper limit of normal, ULN) or a multiple thereof (e.g., 1.5 × ULN) to trigger further evaluation. Such evaluation can be expensive and invasive, yet ignoring aminotransferase elevations can allow life-threatening liver disease to progress if not recognized and treated appropriately. Therefore, how clinical laboratories define their own ALT ULN values is critically important in determining the risk benefit ratio of further evaluation.
For technical reasons related to sample stability, validated standards are not used to establish a ULN for ALT and AST1. Instead, laboratories use locally-defined reference populations to establish their own reference ranges for these tests. The criteria used to include and exclude individuals from this important cohort directly determine the value of the test in identifying the presence of disease2. As obesity increases in the general population, such reference populations could increasingly include individuals with unsuspected nonalcoholic fatty liver disease (NAFLD) which would skew the upper reference limit to inappropriately high levels. One recent population study excluded people at risk for NAFLD and concluded that the “healthy range” for serum ALT should be up to 30 U/L for men and 19 U/L for women3. Although some have argued that this would lead to unnecessary medical expenditures and further burden our healthcare system4, 5, large population studies in Korea have demonstrated increased prevalence of NAFLD6 and increased liver-related mortality in middle aged adults with ALT levels between 20 and 40 U/L compared to those with ALT < 20 U/L7.
The Nonalcoholic Steatohepatitis (NASH) Clinical Research Network (CRN), a group of eight academic institutions assembled by and in collaboration with the National Institute of Diabetes and Digestive and Kidney Diseases (NIDDK) to study fatty liver disease, began to design clinical studies in 2002 and considered using an ALT value greater than the ULN as an entry criterion for its major pediatric treatment trial8. However, variability was found in the ALT ULN values reported by clinical laboratories at CRN clinical centers that could confound the inclusion of homogeneous patient cohorts in this and other studies. The study described here was undertaken to establish the causes of the variability reported by laboratories of their self-defined ULN using results of analyses of samples distributed to clinical laboratories as part of annual accreditation by the College of American Pathologists (CAP).
Methods
Eleven clinical laboratories were identified as the primary laboratories to be used by the CRN clinical centers. The directors of these laboratories were queried in March 2003 using a written questionnaire regarding their results for ALT determinations of five samples analyzed as part of their CAP accreditation in 2002, the standard deviations of their analysis of these samples, the make and model of the analyzer used, and how they defined their own laboratory’s ULN. CAP external proficiency samples for ALT activity measurement are shipped as liquid serum or plasma maintained at 4 degrees C in a thermally insulated container. Directors were asked whether people with the following criteria were excluded from the reference population in order to establish the ALT ULN: known medical conditions (e.g., hypertension, diabetes, heart disease, arthritis), current medication use, history of intravenous drug use, obesity (BMI > 30 kg/m2), overweight (BMI > 25 kg/m2), or other factors. Data were collated by the NASH CRN Data Coordinating Center.
Results
Responses to the surveys were provided by all 11 clinical laboratories queried. The upper reference ranges defined using local reference populations (Table 1) varied from 35 U/L to 79 U/L for men and 31 U/L to 55 U/L for women (figure 1). Known disease states were typically used as exclusion criteria but overweight and obesity were not taken into account by any of the laboratories.
Table 1.
Characteristics of the reference populations used to define the serum ALT ULN by 11 clinical laboratories.
| Lab | N | Characteristics |
|---|---|---|
| A | Unknown | Reference range was determined long ago; as new instruments have been added, results always correlate, we continue to use this range |
| B | 94 | Excluded people with known medical conditions (e.g., hypertension, diabetes, heart disease, arthritis) or current medication use |
| C | 100 | Selected blood donors with no clinical symptoms |
| D | Unknown | Normal values have been the same for 25 years using the same instrument manufacturer; comparison studies between upgrades haves remained the same |
| E | Unknown | Excluded people with known medical conditions (e.g., hypertension, diabetes, heart disease, arthritis), current medication use, history of IV drug use |
| F | 222 | None |
| G | 222 | None |
| H | Unknown | Unknown criteria |
| I | > 120 | Excluded people with known medical conditions (e.g., hypertension, diabetes, heart disease, arthritis), current medication use, history of IV drug use, and whose medical history would affect test results |
| J | 1029 | Excluded people with known medical conditions (e.g., hypertension, diabetes, heart disease, arthritis) |
| K | 1354 | Selected people with normal AST, alkaline phosphatase, bilirubin |
Figure 1.
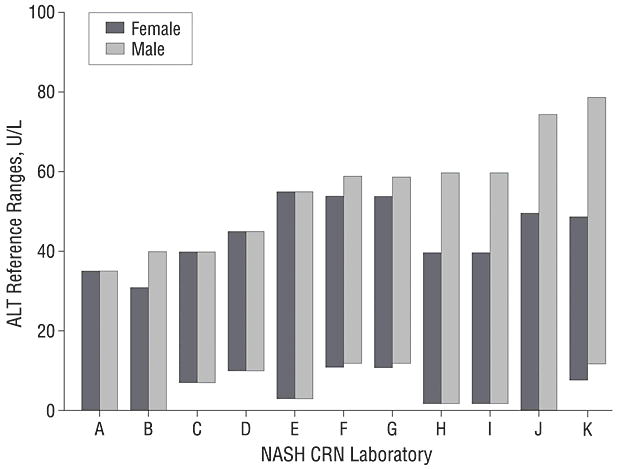
Reference ranges for serum ALT reported by the 11 NASH CRN laboratories. The bars indicate the reference ranges; the upper limit for women varied from 31 U/L in laboratory B to 55 U/L in laboratory E; the upper limit for men varied from 35 U/L in laboratory A to 79 U/L in laboratory K. The lower limit ranged from 0 to 12 U/L.
The College of American Pathologists distributed samples to laboratories for analysis and the results of sample C15, a sample with an ALT level near the upper reference range value reported by most laboratories, were compared to the national means from all laboratories that used the same analyzer. Intralaboratory variability in measuring sample C15 was small (Figure 2, SD < 3 U/L). Interlaboratory variability was also small with laboratories reporting mean C15 results in close agreement with other laboratories using the same analyzer. The maximum variability in C15 analysis attributable to differences among analyzers used by CRN labs was 18 U/L. Whereas this difference based on the particular machine used is not trivial, it did not completely explain the wide variation in ULN values reported by these laboratories. Most of the variation of the ULN reported by these 11 laboratories can only be explained by differences in their reference populations. The impact of the variable ULN on interpretation of the normalcy of the l1 laboratories’ C15 results is shown in figure 3.
Figure 2.
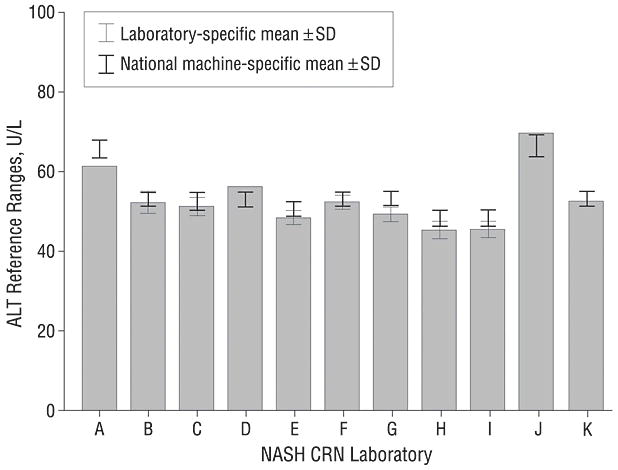
Mean ALT values for CAP sample C15. The gray bars indicate the laboratory specific means of replicate analyses and the thin line error bars indicate ± 1 SD in each direction; four laboratories (A, D, J, K) did not provide standard deviations of their results. The national machine specific mean ± 1 SD in each direction for the analyzer used in each laboratory is indicated by overlying the thick line error bars. The results from most laboratories were within 2 U/L of the national mean for their specific analyzer; laboratory A deviated the most from the national mean yet the difference was still only 4.9 U/L, indicating that laboratory performance was generally excellent.
Figure 3.
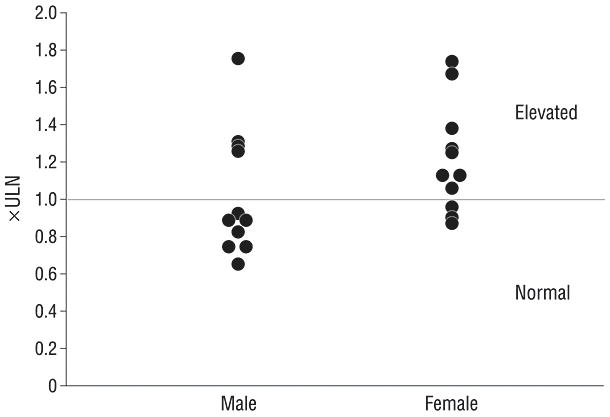
The ALT activity of one standardized sample (C15) reported by 11 different laboratories is expressed as a multiple of the gender-specific ULN for those laboratories. The disparate ULN values reported by different laboratories causes the results of this one sample to be variably interpreted as 0.66 to 1.75 × ULN if it came from a man and 0.87 to 1.73 × ULN if it came from a woman. If this sample was from a woman, it would be reported as normal by 3 laboratories (E, F, G) and elevated by the other 8 (Figure 3). If it was from a man, it would be reported as normal in 7 laboratories and elevated in 4 (A, B, C, D)
Since differences among analyzers play a modest role in contributing to differences in ALT values reported by different laboratories, the CAP data were further analyzed to determine whether the differences among machines were proportional to the values obtained or if the difference among machines was relatively constant. A relatively constant difference becomes less significant at higher ALT levels whereas a proportional difference amplifies the variability among analyzers and becomes relevant for clinical or study criteria that use high levels such as 500 U/L as a cutoff to trigger an intervention or evaluation. Analysis of CAP samples with lower and higher ALT levels revealed that the analyzer-specific differences were relatively constant and not proportional to the ALT result. Thus the variability among analyzers becomes less significant when measuring samples with higher ALT levels.
Discussion
The analysis of CAP data for ALT from eleven clinical laboratories with respect to each laboratory’s reported reference range demonstrates that the primary factor contributing to the widely divergent ALT ULN values is not variability within a laboratory or variability caused by the use of different analyzers, but must be related to the characteristics of the cohorts used by individual laboratories to define their own reference ranges. This unsettling observation suggests that the reported ULN values provided by laboratories with their test reports may not be reliable in identifying patients with unsuspected chronic liver disease.
Especially germane to this issue is the common use of multiples of reported ULN values as criteria for clinical trial entry or initiating clinical interventions such as stopping medications or further evaluating the abnormality with blood tests, imaging and even a liver biopsy. Multiplying inaccurate ULN values only multiplies the errant value created by using the local reference population. For example, if therapy with an HMG-CoA reductase inhibitor (i.e, a statin) is to be discontinued if the ALT rises above 3 × ULN, then clinical management will vary considerably depending on where a patient obtains a blood test.
The factors contributing to the variability in reference cohorts used to establish ULN values reported by different laboratories are unknown. Certainly, obesity could be a major factor. Obesity is commonly associated with NAFLD, an increasingly common condition that causes progressive liver disease to the point of cirrhosis in some patients. NAFLD can cause ALT elevations and as the current epidemic of obesity increases, reference populations may include increasing numbers of people with undiagnosed NAFLD. A recent study of adults enrolled in the Dallas Heart Study identified imaging evidence of NAFLD in 33% of the adult population9, suggesting a high likelihood that obesity and associated liver disease contribute to the relatively high ALT levels in laboratory reference populations. Alternatively, anthropomorphic, clinical or demographic differences other than obesity could be responsible for the variation among laboratories.
In summary, the ULN for serum ALT reported by clinical laboratories usually reflects characteristics of the local reference population, a population that was not screened for risk factors for fatty liver disease in our study. Differences among analyzers provided by different manufacturers play only a modest role in different ULN values from different laboratories whereas laboratory proficiency does not play a role. The implication of this finding for clinical practice is that the ULN for ALT reported by clinical laboratories that accompanies test results may not be reliable for identifying patients with unsuspected liver disease when the ULN is substantially above the proposed healthy range for ALT of 30 U/L for men and 19 U/L for women3. With the increasing prevalence of obesity and the likely parallel increase in the prevalence of NAFLD, clinical laboratories need to anticipate how this disease might adversely alter the makeup of reference populations. Laboratories should consider identifying healthy subjects without risk factors for insulin resistance and fatty liver disease when establishing reference groups for testing serum ALT. Until this is done, clinicians might identify patients with liver disease more consistently by using absolute values (such as 40 U/L) for the upper normal upper range of ALT rather than relying on laboratory-specified reference ranges.
Acknowledgments
The Nonalcoholic Steatohepatitis Clinical Research Network is supported by the National Institute of Diabetes and Digestive and Kidney Diseases (grants U01DK061718, U01DK061728, U01DK061731, U01DK061732, U01DK061734, U01DK061737, U01DK061738, U01DK061730, and U01DK061713 and the National Institute of Child Health and Human Development.
Members of the Steering Committee of the Nonalcoholic Steatohepatitis Clinical Research Network
Cleveland Clinic, Cleveland, OH: Arthur J. McCullough, MD Duke University Medical Center, Durham, NC: Anna Mae Diehl, MD Indiana University School of Medicine, Indianapolis, IN: Naga Chalasani, MD Johns Hopkins University Center for Clinical Trials (Data Coordinating Center), Baltimore, MD: James Tonascia, PhD National Institute of Diabetes and Digestive and Kidney Diseases (NIDDK), Bethesda, MD: Patricia R. Robuck, PhD, MPH Saint Louis University, St Louis, MO: Brent A. Neuschwander-Tetri, MD University of California San Diego, San Diego, CA: Joel E. Lavine, MD, PhD University of California San Francisco, San Francisco, CA: Nathan M. Bass, MD, PhD University of Washington, Seattle, WA: Kris V. Kowdley, MD Virginia Commonwealth University, Richmond, VA: Arun J. Sanyal, MD
I, Brent A. Neuschwander-Tetri, had full access to all of the data in the study and take responsibility for the integrity of the data and the accuracy of the data analysis.
Footnotes
The authors report no financial conflicts of interest.
References
- 1.Canalias F, Camprubi S, Sanchez M, Gella FJ. Metrological traceability of values for catalytic concentration of enzymes assigned to a calibration material. Clin Chem Lab Med. 2006;44:333–339. doi: 10.1515/CCLM.2006.058. [DOI] [PubMed] [Google Scholar]
- 2.PetitClerc C, Wilding P. The theory of reference values. Part 2. Selection of individuals for the production of reference values. J Clin Chem Clin Biochem. 1984;22:203–208. [PubMed] [Google Scholar]
- 3.Prati D, Taioli E, Zanella A, et al. Updated definitions of healthy ranges for serum alanine aminotransferase levels. Ann Intern Med. 2002;137:1–9. doi: 10.7326/0003-4819-137-1-200207020-00006. [DOI] [PubMed] [Google Scholar]
- 4.Kaplan MM. Alanine aminotransferase levels: what’s normal? Ann Intern Med. 2002;137:49–51. doi: 10.7326/0003-4819-137-1-200207020-00012. [DOI] [PubMed] [Google Scholar]
- 5.Kunde SS, Lazenby AJ, Clements RH, Abrams GA. Spectrum of NAFLD and diagnostic implications of the proposed new normal range for serum ALT in obese women. Hepatology. 2005;42:650–656. doi: 10.1002/hep.20818. [DOI] [PubMed] [Google Scholar]
- 6.Chang Y, Ryu S, Sung E, Jang Y. Higher concentrations of alanine aminotransferase within the reference interval predict nonalcoholic fatty liver disease. Clin Chem. 2007;53:686–692. doi: 10.1373/clinchem.2006.081257. [DOI] [PubMed] [Google Scholar]
- 7.Kim HC, Nam CM, Jee SH, Han KH, Oh DK, Suh I. Normal serum aminotransferase concentration and risk of mortality from liver diseases: prospective cohort study. BMJ. 2004;328:983. doi: 10.1136/bmj.38050.593634.63. [DOI] [PMC free article] [PubMed] [Google Scholar]
- 8.Lavine JE, Schwimmer JB. Clinical Research Network launches TONIC trial for treatment of nonalcoholic fatty liver disease in children. J Pediatr Gastroenterol Nutr. 2006;42:129–130. doi: 10.1097/01.mpg.0000189332.77644.1f. [DOI] [PubMed] [Google Scholar]