

Abstract
CD8+ T cells are specialized cells of the adaptive immune system capable of finding and eliminating pathogen-infected cells. To date it has not been possible to observe the destruction of any pathogen by CD8+ T cells in vivo. Here we demonstrate a technique for imaging the killing of liver-stage malaria parasites by CD8+ T cells bearing a transgenic T cell receptor specific for a parasite epitope. We report several features that have not been described by in vitro analysis of the process, chiefly the formation of large clusters of effector CD8+ T cells around infected hepatocytes. The formation of clusters requires antigen-specific CD8+ T cells and signaling by G protein-coupled receptors, although CD8+ T cells of unrelated specificity are also recruited to clusters. By combining mathematical modeling and data analysis, we suggest that formation of clusters is mainly driven by enhanced recruitment of T cells into larger clusters. We further show various death phenotypes of the parasite, which typically follow prolonged interactions between infected hepatocytes and CD8+ T cells. These findings stress the need for intravital imaging for dissecting the fine mechanisms of pathogen recognition and killing by CD8+ T cells.
Keywords: Plasmodium, immunity, lymphocytes
CD8+ T cells are specialized cells of the adaptive immune system that specifically kill pathogen-infected cells and tumors presenting cognate antigen on MHC class I molecules. In malaria infection, antigen-specific CD8+ T cells are capable of eliminating preerythrocytic liver-stage parasites that develop in hepatocytes (1). The liver stages develop after sporozoites, the parasite form injected by the mosquito, migrate to the liver and infect hepatocytes. In natural infections only a few dozen liver stages exist in the host, which mature to form merozoites that establish blood stage infection. The maturation time of the liver stages is generally short: from 48 h with rodent-infecting Plasmodium species to 7 d with Plasmodium falciparum; therefore, to be protective, liver stage-specific CD8+ T cells must rapidly find and eliminate the rare infected hepatocytes.
Although many studies have focused on the CD8+ T cells that target Plasmodium liver stages, the mechanisms by which they find infected cells in the liver, as well as the critical parameters required for parasite killing, such as the number and duration of parasitized cell-CD8+ T-cell contacts, are still unclear. So far, killing of Plasmodium liver stages by CD8+ T cells has been visualized only in vitro, and the sole reported event showed that CD8+ T cells eliminated the infected hepatocyte in less than 10 min (2). In vivo, CD8+ T-cell effector function has only been measured indirectly by measuring the ability of T cells to reduce liver parasite burden. Using this technique we have found that Plasmodium-specific T cells lacking various effector molecules, including perforin, IFN-γ, and Fas ligand, are all capable of eliminating parasites in the liver (3, 4). Nonetheless, because we have not been able to examine T-cell effector function in fine detail it is impossible to know whether these molecules truly play no role as effectors in CD8+ T cell-mediated protection.
Given the limitations of existing techniques to study effector CD8+ T-cell responses, we have turned to intravital microscopy to examine Plasmodium elimination by CD8+ T cells. Intravital microscopy has previously been used to measure effector CD8+ T-cell function in lymphoid tissue and peripheral organs. An early study measuring the lysis of peptide-pulsed B cells in lymph nodes using two-photon microscopy demonstrated target cell killing by CD8+ T cells in less than 20 min (5). In contrast, it was estimated that 6 h of cognate CD8+ T-cell contact were required to induce apoptosis of tumor cells in vivo (6). In studies with vaccinia virus, Leishmania, Listeria, and Toxoplasma, cognate T cells were seen changing their migratory behavior in the presence of microbial antigen, although pathogen killing was not observed (7–11). In fact, the elimination of a microbe by CD8+ T cells has not been seen in vivo to date, which is surprising given that in vitro studies have suggested that CD8+ T cells are capable of eliminating target cells after ∼5 min of contact (2, 12). We reasoned, however, that the established ability of CD8+ T cells to give sterilizing immunity to Plasmodium liver stages in ∼48 h (1, 13) gave us an optimal chance of imaging the events surrounding pathogen elimination by these cells.
Results
Clustering of Endogenous CD8+ T Cells Around Infected Hepatocytes in Immune Mice.
To visualize the interaction between activated CD8+ T cells and Plasmodium-infected hepatocytes in vivo, we undertook imaging in the mouse liver using spinning-disk confocal microscopy (14). GFP-expressing Plasmodium yoelii sporozoites (PyGFP) were used to infect naïve mice or mice immunized 10 d previously with P. yoelii radiation-attenuated sporozoites (RAS). To visualize CD8+ T cells, Phycoerythrin (PE)-conjugated α-CD8 antibodies were injected into the mice 24 h after infection. The mice were then immediately anesthetized and subjected to surgery to expose the liver for imaging. In RAS-immunized mice most parasites were surrounded by clusters of CD8+ cells, often extending over a radius of approximately 40 μm (Fig. 1A). Overall 52 of 66 parasites (79%) in immune mice had at least one CD8+ cell in a 40-μm radius, with 42 parasites being surrounded by clusters of two or more CD8+ cells (Fig. 1B). In contrast only 13 of 47 parasites (27%) in naïve mice had a CD8+ cell nearby, and in only one case was more than one CD8+ cell seen (Fig. 1B).
Fig. 1.

Clustering of antigen-specific T cells around infected hepatocytes. (A) Representative images of parasites and CD8+ T cells in naïve or RAS immune mice inoculated with 3 × 10⁷ PyGFP parasites and imaged 24 h later after injection of 4 μg PE-conjugated anti-CD8 mAb. Images are maximal projections of 17 slices, each 3 μm apart. CD8+ T cells are defined as clustering if they lie at least partially within a circle of 40-μm radius drawn around the parasite (outer dotted circle). (B) Number of cells clustering around parasites in naïve and immune mice; lines represent median values (data are pooled from three independent experiments per group analyzed by Mann-Whitney U test). (C) The observed frequency distribution of PyTCR cells among P. yoelii-infected hepatocytes (black bars; data from A and B) compared with the distribution that would be expected according to each of three different models for cluster formation (more details are given in SI Experimental Procedures). Akaike weights (w) indicate the relative weight of how a particular model describes experimental data (among three tested models). Estimated parameters for these models and their 95% confidence intervals are given in Table S1.
When we examined the frequency distribution of CD8+ T cells around infected hepatocytes, we were struck by the large variability in the number of CD8+ T cells in clusters (Fig. 1C). We compared this experimental distribution with three mathematical models of cluster formation (SI Experimental Procedures provides full details of models). If clusters formed as a result of random interactions between T cells and an infected hepatocyte we would expect T cells to enter clusters at a constant rate and leave clusters at a rate proportional to the number of T cells in the cluster. Steady-state distribution of the number of CD8+ T cells surrounding a given parasite in this case corresponds to a Poisson distribution (Fig. 1C, red line) that does not fit the data. In contrast two other models in which T cells were either preferentially attracted to larger clusters (density-dependent recruitment; Fig. 1C, green line) or preferentially retained in larger clusters (density-independent exit; Fig. 1C, gray line) fitted the data significantly better, suggesting that clusters may form by a nonrandom directed process.
Antigen-Specific CD8+ T Cells Drive Cluster Formation.
Using α-CD8 antibodies we could not discriminate whether the CD8+ T cells clustering around infected hepatocytes were parasite-specific. Moreover this technique is not compatible with time-lapse imaging because antibodies may alter the behavior of labeled T cells. To overcome these limitations, we examined the behavior of in vivo-activated T cell receptor (TCR) transgenic CD8+ T cells specific for the CS280–288 (SYVPSAEQI) epitope of the circumsporozoite protein of P. yoelii (PyTCR cells) in the context of H2-Kd (15). As a control we also examined the behavior of similarly activated OT-I cells that recognize the irrelevant SIINFEKL epitope from chicken ovalbumin in the context of H2-Kb. To ensure histocompatibility, both TCR transgenic donors and the wild-type recipient mice were BALB/c × C57BL/6 F1 (CB6) hybrid mice. The in vivo activated CD8+ T cells were labeled and transferred, either separately or together, into mice that had been inoculated 20 h previously with PyGFP sporozoites. Cells were transferred 20 h after infection so as to prevent parasites from being eliminated before they become visible. Six hours after transfer, mice were anesthetized and subjected to surgery to expose the liver, and interactions between infected hepatocytes and transferred CD8+ T cells were imaged by either static or time-lapse imaging.
When PyTCR cells were transferred alone to infected mice, they strikingly recapitulated the phenotype seen in the endogenous response, with large clusters of up to 25 antigen-specific cells seen around some infected hepatocytes (Fig. 2 A and B and Fig. S1 A, i). Comparison of the frequency distribution of PyTCR cells around infected hepatocytes with the mathematical models described in Fig. 1C suggested that clusters were likely to have formed by the density-dependent recruitment of T cells rather than by chance or by density-independent exit of T cells (Fig. S1 A, i). In contrast, when irrelevant OT-I cells were transferred to infected mice, 80 of 92 infected hepatocytes (87%) were not surrounded by any OT-I cells, whereas no infected hepatocyte was surrounded by more than 2 OT-I cells and (Fig. 2 A and B). Moreover, the frequency distribution of OT-I cells around infected hepatocytes is consistent with the model in which clusters are formed by chance (Fig. S1 Aii). Together these data show that antigen-specific CD8+ T cells are necessary and sufficient for the formation of CD8+ T-cell clusters.
Fig. 2.

Interaction of specific and nonspecific CD8+ T cells with infected hepatocytes. (A) Labeled OT-I (9 × 10⁶) or 9 × 10⁶ labeled PyTCR cells were transferred to separate mice infected 20 h previously with 3 × 10⁵ PyGFP parasites and imaged 6 h later. Images show associations between infected hepatocytes and (i) PyTCR or (ii) OT-I cells. Images are maximal Z projections of 17 slices, each 3 μm apart. (B) Proportion of infected hepatocytes surrounded by different numbers of OT-I or PyTCR cells. P values are based on χ2 test [χ2(2) = 19.6]. (C) Experiment performed as in A, except that the OT-I and PyTCR effector CD8+ T cells were transferred together. Image is a maximal Z projection of 12 slices, each 5 μm apart, showing a cluster of OT-I and PyTCR cells surrounding an infected hepatocyte. (D) Proportion of infected hepatocytes surrounded by different numbers of OT-I or PyTCR cells; data from experiment described in C. P values are based on χ2 test [χ2(2) = 1.69]. (E) Correlation of the numbers of OT-I and PyTCR cells in clusters for all infected hepatocytes measured. (F) Speed (i) and meandering indices (ii) of OT-I and PyTCR cells within clusters or outside clusters around infected hepatocytes (cells transferred together). P values are based on Mann-Whitney U test; data pooled from five movies in two independent experiments. (G) Montage of T cell dynamics around an infected hepatocyte.
Both Parasite-Specific and Irrelevant T Cells Are Recruited to Clusters Around P. yoelii Infected Hepatocytes.
In the previous experiments antigen-specific T cells were observed to form clusters around infected hepatocytes. To determine whether PyTCR transgenic cells alter the microenvironment around infected hepatocytes to enable the recruitment of additional nonspecific CD8+ T cells, identical numbers of activated OT-I and PyTCR cells were transferred together to animals infected 20 h previously. Interestingly, in the presence of PyTCR cells, OT-I cells were observed to form an integral part of CD8+ T-cell clusters forming around infected hepatocytes (Fig. 2 C and D) with the number of OT-I cells tightly correlating with the number of PyTCR cells present (Fig. 2E). Once again these data are consistent with mathematical model in which both OT-I and PyTCR cells are recruited to clusters in a density-dependent fashion (Fig. S1B).
Where clusters of specific and nonspecific CD8+ T cells were observed around parasites, we followed the behavior of the cells by time-lapse in vivo imaging. We found that both OT-I and PyTCR cells had similarly reduced speed and lower meandering indices inside clusters compared with those further away from infected hepatocytes (Fig. 2F). In some cases we were able to observe either PyTCR or OT-I cells entering or exiting clusters and, as they do so, rapidly changing their speed (Fig. S2). Together these data suggest that PyTCR cells can alter the microenvironment around the infected hepatocytes upon antigen recognition and facilitate the recruitment of both antigen-specific and non–antigen-specific cells to clusters. Interestingly, in some cases we were further able to observe the disintegration of PyGFP parasites, as indicated by blebbing of the parasite mass and loss of the GFP signal (Fig. 2G and Movie S1), suggesting that it might be possible to quantify parasite elimination in this system.
Destruction of Plasmodium Parasites by Antigen-Specific CD8+ T Cells.
To further characterize parasite elimination by CD8+ T cells we performed time-lapse imaging of the interactions of PyTCR cells with 32 PyGFP parasites in BALB/c mice. We performed these experiments in BALB/c mice because preliminary data suggested that parasites were efficiently eliminated from these mice, even when cells were transferred 18–24 h after infection (Fig. S3). We observed numerous interactions between effector PyTCR cells and PyGFP-infected hepatocytes, with 22 of 32 infected cells associated with at least one T cell during the course of imaging and 12 clusters observed.
In experimental agreement with our mathematical modeling suggesting clusters may form by density-dependent recruitment, we found that the entry rate of CD8+ T cells into a given cluster positively correlated with the number of CD8+ T cells already present in that cluster (Fig. 3 A, i). Furthermore, the per capita exit rate of CD8 T cells from a cluster was independent of the cluster size (Fig. 3 A, ii). These findings are consistent with the hypothesis that antigen-specific CD8+ T cells themselves drive the recruitment of other CD8+ T cells to the site of infection in a positive feedback loop. However, it is also possible that particular regions of the liver have higher T-cell traffic, potentiating cluster formation in these areas. As in the previous experiment (Fig. 2F), we found that cells in clusters had reduced speed and meandering indices compared with cells outside clusters (Fig. S4).
Fig. 3.

Destruction of parasites by effector CD8+ T cells. PKH-26 labeled effector PyTCR cells (1 × 10⁷) were transferred to mice 20 h after infection with 3 × 10⁵ PyGFP and imaged 4–8 h later; data are pooled from 32 movies in four independent experiments. (A) Correlation of (i) entry rate and (ii) per capita exit rate of PyTCR with the total number of PyTCR cells around each infected hepatocyte. Infected hepatocytes not associated with any T cell were excluded from the analysis. (B) Graphs of ΔVI vs. VIfinal for live (white symbols) and dead (black symbols) parasites in mice that received PyTCR cells and control animals. P value is based on Fisher exact test. (C) Numbers of PyTCR cells clustering around parasites that remained alive (white symbols) and died (black symbols) averaged over time. Bars show median values; P values are based on Mann-Whitney U test. (D) Montages of representative parasites illustrating DP 1–4; images are maximal projections of 9–15 Z sections, each 5 µm apart; graphs show the change in VI over time, with symbols showing when the montage images were taken.
We observed the in vivo elimination of liver stages in real time by tracking the parasite vitality index (VI) over the course of the imaging period. The VI is defined as the log-ratio of parasite fluorescence to the autofluorescence of the surrounding tissue. Profound decreases in the VI, suggestive of parasite death, were observed in 11 of 32 parasites in mice that received effector PyTCR cells, within the relatively short period of observation (Fig. 3B). This decrease in VI was associated with T-cell clustering: dying parasites were surrounded by an average of 3.2 CD8+ T cells; in contrast, parasites that survived were only surrounded by a mean of 0.97 T cells (Fig. 3C).
We are confident that this loss of VI represents T cell-mediated killing rather than possible artifacts such as photo-bleaching, photo-toxicity, or parasites moving out of the field of view because such changes were significantly rarer among PyGFP parasites in mice that did not receive PyTCR cells, which we used as a baseline for these studies (Fig. 3C). The majority of these control parasites (36 of 39) had only minor changes in their VI over time (mean ΔVI = +2.98% ± 15.8%), although 3 of 39 parasites did undergo complete loss of the GFP signal in <5 min (Fig. S5). A complete overview of the timing of imaging, PyTCR CD8+ T-cell interaction, and death for all parasites studied is given in Fig. S6.
Unexpectedly, we observed that dying parasites could display at least four different death phenotypes (DP). Three of these DPs were only seen in mice that received effector PyTCR cells, further demonstrating that we were observing bona fide T cell-mediated killing. The first DP (3 of 11) was characterized by a sudden loss of the bulk of the GFP signal but leaving a residual halo of GFP in place of the parasite (Fig. 3 D, i and Movie S2). The second DP (4 of 11) consisted of a progressive attrition of the VI lasting hours (Fig. 3 D, ii and Movie S3). One parasite displayed a dramatic phenotype (DP3) in which parasite material blebbed from the dying cell (Fig. 3 D, iii and Movie S4). This is the same phenotype as that observed originally (Fig. 2G and Movie S1). Finally, 3 of 11 parasites died in a similar manner to those in control mice (i.e., with complete loss of GFP signal in <5 min) (DP4; Fig. 3 D, iv and Movie S5). Overall, in mice that received CD8+ T cells, we observed one parasite death every 4 h of association between infected hepatocytes and CD8+ T cells (Fig. S6), which challenges the notion that CD8+ T cell-mediated killing is a rapid event.
CD8+ T-Cell Cluster Formation and Parasite Elimination Depend on G Protein-Coupled Receptor Signaling.
Our mathematic modeling and dynamic imaging data suggested that activated CD8+ T cells formed clusters via a positive feedback loop, with antigen-specific T cells recruiting other activated T cells—both specific and nonspecific—to the site of infection. Activated T cells express high levels of chemokines and their corresponding G protein-coupled receptors (GPCRs), which could be involved in this process. To test this hypothesis we used pertussis toxin, which inhibits GPCR signaling by inducing ADP ribosylation of G proteins and preventing their interaction with GPCRs (16). Effector PyTCR cells were treated with pertussis toxin (PTx) before transfer to mice that had been inoculated with PyGFP sporozoites. Only 20 of 75 parasites (27%) in mice that received PTx-treated CD8+ T cells were surrounded by any CD8+ T cells, and only three clusters of two or more CD8+ T cells were seen. In contrast, in mice that received vehicle-treated CD8+ T cells, 38 of 82 parasites (39%) were associated with at least one CD8+ T cell, with 22 clusters of two or more cells (Fig. 4A). Thus, PTx significantly impaired the ability of CD8+ T cells to cluster around infected hepatocytes. One possible explanation for the effect of PTx on CD8+ T-cell clustering would be that it affected overall T-cell migration to the liver, making fewer cells available to cluster around parasites. However, in agreement with a previous study (17), we found that whereas PTx impaired migration of PyTCR cells to the lymph nodes, it had no effect on their ability to migrate to the liver (Fig. 4B). We were also concerned that PTx treatment might affect the ability of CD8+ T cells to exit the sinusoids; however, using immunofluorescence microscopy we were unable to observe difference in the proportion of transferred cells in the parenchyma after PTx treatment (Fig. S7 A and B). Therefore, although GPCR signaling is dispensable for CD8+ T-cell entry to the liver, it is required for the formation of CD8+ T-cell clusters around infected hepatocytes.
Fig. 4.
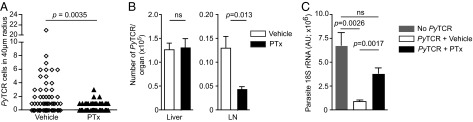
Treatment with PTx inhibits cluster formation and the destruction of parasites by effector CD8+ T cells. (A) Number of vehicle- or PTx-treated PyTCR cells clustering around PyGFP infected cells. Effector PyTCR cells (1 × 10⁷) were treated with 1 μg/mL PTx or vehicle alone for 1 h at 37 °C before being transferred to mice that had been challenged with 3 × 10⁵ P. yoelii sporozoites 20 h previously. Parasites were then imaged statically 6 h after PyTCR CD8+ T-cell transfer (data are pooled from two independent experiments per group and analyzed by Mann-Whitney U test). (B) PTx- and vehicle-treated cells migrate similarly to the liver: 5 × 10⁶ PyTCR cells, treated as in A, were transferred to recipient mice. Six hours later the number of PyTCR cells in perfused livers and lymph nodes was quantified by flow cytometry. (C) PTx treatment inhibits parasite elimination by PyTCR cells. PyTCR cells (5 × 10⁶) were treated either with PTx or vehicle as in A and transferred to mice that were challenged with 5 × 10³ P. yoelii. Forty-two hours later parasite burden in the liver was assessed by RT-PCR (data representative of two independent experiments).
Finally, we tested whether inhibiting CD8+ T-cell clustering would decrease their ability to eliminate parasites in the liver. For this, PTx-treated effector PyTCR cells were transferred to mice that were then infected with P. yoelii sporozoites. As shown in Fig. 4C, PTx-treated cells were unable to significantly inhibit parasite development in the liver. To exclude the possibility that PTx may be acting on T-cell effector function rather than its ability to form clusters, we verified that PTx had no discernible effect on CD8+ T-cell cytoxicity or effector cytokine secretion as measured ex vivo (Fig. S7 C and D). Together these data reinforce the notion that GPCR-dependent clustering of Plasmodium-specific CD8+ T cells around infected hepatocytes, is important for their killing capacity.
Discussion
This work presents a description of in vivo elimination of a microorganism by CD8+ T cells. This was frequently observed to occur after prolonged association of Plasmodium-infected hepatocytes with antigen-specific CD8+ T cells, which often clustered around infected hepatocytes. Our experimental data, supported by our mathematical modeling analysis, enables us to propose a model of how these clusters form. In this model an antigen-specific CD8+ T cell interacting with an infected hepatocyte alters the local microenvironment surrounding the site of infection, probably via the local secretion of cytokines and chemokines, resulting in the recruitment of additional effector CD8+ T cells of diverse specificities to form a cluster. This model is consistent with our finding that once an antigen-specific CD8+ T cell found an infected hepatocyte, both antigen-specific and nonspecific activated T cells are attracted to the cluster.
Importantly, clustering seems to be a physiological phenomenon and not an artifact of the use of TCR transgenic cells. We were able to observe clusters of endogenous T cells after immunization with RAS, which is in agreement with a previous postmortem histology study (18). These clusters would be expected to contain both Plasmodium-specific cells and potentially other effector and memory CD8+ T cells from concurrent or previous immune responses. Cluster formation during Plasmodium infection may, however, require the presence of large numbers of preexisting specific T cells (19). Such a large number may only be induced by vaccination with subunit vaccines or immunogens such as RAS, which have been shown to provide depots of persisting antigen that may help induce and maintain CD8+ T-cell responses of broad specificity (20).
The relative roles of antigen and microenvironment in altering effector T-cell behavior have been examined in a variety of infections and tumor models. Similarly to our findings with Plasmodium, nonspecific CD8+ T cells were recruited to tumors only in the presence of tumor-specific CD8+ T cells (21). However, in this model the recruited nonspecific cells had very distinct motility characteristics from the specific cells (22). Similarly, in infection models of Toxoplasma, Leishmania, Listeria, and Mycobacterium (8, 9, 23–25), nonspecific T cells have been observed infiltrating sites of infection and in some cases showing altered motility relative to cells outside the foci of infection (9, 24). In our system the T-cell behavior we observed is indistinguishable between specific and nonspecific cells at the site of infection. One reason for this may be kinetic: we are looking at T-cell behavior in an acute infection very shortly after infection, whereas most imaging studies look at more persistent challenges days to weeks after infection or cell transfer. The long-term behavior of specific and nonspecific T cells is a matter of interest that merits further studies.
A number of key questions remain: we do not know how the first antigen-specific CD8+ T cell finds the infected hepatocyte—or whether this is a random or directed process. A recent study has reported that Toxoplasma-specific effector CD8+ T cells adopt a generalized Lévy random walk, which optimizes their ability to find rare infected cells in the brain (26). It will be interesting to determine whether a similar process is happening with Plasmodium-specific cells in the liver. Moreover, we do not know which GPCRs are required for further T-cell recruitment and cluster formation; interestingly, it has been demonstrated that both specific and nonspecific T cells are recruited to the site of influenza virus infection in the lungs via CCR5 (27), whereas in the lymph node, CXCL9-CXCR3 interactions have been shown to be critical for the clustering of antigen-specific effector CD8+ T cells around DCs in viral infections (11, 28).
Although a single CD8+ T cell is probably sufficient to kill a parasite-infected cell, clustering likely increases the probability of parasite killing. Clustering of CD8+ T cells may aid the elimination of pathogens in a number of ways. CD8+ T cells are known to vary greatly in their ability to degranulate and produce effector cytokines in response to antigen (29). Therefore, CD8+ T cells with limited effector capacity may initially contact infected cells. These cells may, however, be able to act as sentinels and recruit other CD8+ T cells to the infected cell. A requirement for CD8+ T-cell clustering for efficient parasite killing is compatible with previous work that showed that a large number of Plasmodium-specific CD8+ T cells are needed to ensure sterile protection against parasite challenge (1, 13).
A final observation was the multiplicity of parasite DPs. The biological events causing these different phenotypes, however, are not clear. It is possible that the different DPs are due to the action of different CD8+ T-cell effector functions on infected cells. For example, the progressive loss of GFP signal may be indicative of growth arrest, perhaps induced by cytokines such as IFN-γ. The rapid transition from a focal GFP signal to a weak diffuse signal would be compatible with the loss of membrane integrity of the parasite and of the parasitophorous vacuole that surrounds the parasite, releasing GFP into the cytoplasm of the host cell. A striking DP we observed was cellular blebbing, suggestive of apoptosis, possibly resulting from perforin-mediated injection of granzymes by the CD8+ T cell into the host cell cytoplasm. The hypothesis that the different DPs are caused by different effector molecules is in agreement with the notion that multiple effector mechanisms are likely involved in Plasmodium liver stage elimination by CD8+ T cells (3, 4, 30).
In conclusion, this intravital dynamic imaging of Plasmodium elimination by CD8+ T cells reveals striking differences with in vitro data, which suggested that CD8+ T-cell killing of Plasmodium liver stages was rapid and followed short interactions with CD8+ T cells (2). It reveals that parasite destruction frequently involves the recruitment of multiple CD8+ T cells to a single infected cell and suggests that it can be achieved by distinct mechanisms. Future in vivo imaging work, aided by the use of KO CD8+ T cells and KO mice, will aim at deciphering the molecular basis of CD8+ T-cell homing to the infected hepatocyte and killing of the intracellular parasite.
Experimental Procedures
Generation of Effector PyTCR and OT-I Cells.
Thy1.2+ CD8+ transgenic cells specific for the SYVPSAEQI epitope of P. yoelii (15) on a BALB/c or CB6 background were adoptively transferred into littermate Thy1.1/2+ heterozygous WT mice (1 × 10⁶ cells per mouse) before immunization with 5 × 10⁶ pfu per mouse vaccinia-SYV (15). Seven to ten days later the spleens were harvested and lymphocytes were prepared by passing over a lymphoprep-M gradient (Cedarlane Laboratories). Activated transgenic Thy1.2+ CD8+ T cells were then purified from host mouse cells by negative selection using the CD8+ T-cell isolation kit (Miltenyi) supplemented with biotinylated α-Thy1.1 antibodies to remove the nonspecific CD8+ T cells. This yielded a 70–90% pure preparation of activated PyTCR cells. Effector OT-I cells were prepared similarly: CD45.2+cells were transferred to CD45.1+/2+ littermates and the mice immunized with 5 × 10⁶ pfu per mouse vaccinia-OVA. α-CD45.1 was used in lieu of α-Thy1.1 to remove nonspecific cells. Cells were labeled with either PKH-26 (Sigma) or eFluor670 (eBioscience) before transfer according to the manufacturers’ instructions. All experimental procedures on animals in the United States were approved by the Institutional Animal Care and Use Committee of the Johns Hopkins University. In France, animal experiments were conducted in accordance with national and European regulation on care and protection of laboratory animals.
Imaging of Parasite-CD8+ T-Cell Interactions in the Liver.
The liver of anesthetized BALB/c AnN mice (Charles River) infected with P. yoelii-GFP (31) was surgically exposed and prepared for imaging as described previously (14). For static imaging of the endogenous response, 4 μg of PE-conjugated anti-CD8 was injected into the mice immediately before surgery. For each parasite found, a Z stack of 17 slices, each 3 μm apart, was acquired by laser confocal spinning-disk microscopy (Zeiss) using a 40× oil immersion objective (Zeiss). In time-lapse imaging experiments, parasites were tracked for 2–4 h after surgery by laser confocal spinning-disk microscopy (Perkin-Elmer) using a 25× oil immersion objective (Zeiss). For each parasite a Z stack of 9–15 slices, each 5 μm apart, was acquired every 2–5 min. Full details of the analysis of imaging data are given in SI Experimental Procedures.
Analysis of Parasite Load in the Liver by RT-PCR.
Quantification of liver stage parasites was as previously described (15). Briefly, 42 h after challenge with 1 × 10⁴ P. yoelii sporozoites, livers were excised, and parasite load was determined by quantitative PCR for P. yoelii 18S rRNA using SYBR Green (Applied Biosystems).
Immunization of Mice with RAS.
BALB/c mice were immunized with 5 × 10⁴ P. yoelii RAS, (30 kRad irradiation) injected intradermally in the ear pinna.
Supplementary Material
Acknowledgments
We thank Dr. Yun-Chi Chen for providing recombinant vaccinia virus, Dr. Pascale Gueirard for animal breeding, Center for Production and Infection of Anopheles for providing mosquitoes, and IMAGOPOLE for the imaging platform. R.M. is supported by Grant ANR-10-LABX-62-IBEID from the French Government’s Investissement d’Avenir program, and R.A. by the French National Research Agency Grant ANR-10-JCJC-1302-PlasmoPEP. Work in the F.Z. laboratory was supported by National Institutes of Health Grant AI44375 (to F.Z.) and an European Molecular Biology Organization short-term fellowship (to I.A.C.). F.Z. and I.A.C. receive support from the Bloomberg Family Foundation.
Footnotes
The authors declare no conflict of interest.
*This Direct Submission article had a prearranged editor.
This article contains supporting information online at www.pnas.org/lookup/suppl/doi:10.1073/pnas.1303858110/-/DCSupplemental.
References
- 1.Romero P, et al. Cloned cytotoxic T cells recognize an epitope in the circumsporozoite protein and protect against malaria. Nature. 1989;341(6240):323–326. doi: 10.1038/341323a0. [DOI] [PubMed] [Google Scholar]
- 2.Trimnell A, et al. Genetically attenuated parasite vaccines induce contact-dependent CD8+ T cell killing of Plasmodium yoelii liver stage-infected hepatocytes. J Immunol. 2009;183(9):5870–5878. doi: 10.4049/jimmunol.0900302. [DOI] [PubMed] [Google Scholar]
- 3.Chakravarty S, Baldeviano GC, Overstreet MG, Zavala F. Effector CD8+ T lymphocytes against liver stages of Plasmodium yoelii do not require gamma interferon for antiparasite activity. Infect Immun. 2008;76(8):3628–3631. doi: 10.1128/IAI.00471-08. [DOI] [PMC free article] [PubMed] [Google Scholar]
- 4.Morrot A, Zavala F. Effector and memory CD8+ T cells as seen in immunity to malaria. Immunol Rev. 2004;201:291–303. doi: 10.1111/j.0105-2896.2004.00175.x. [DOI] [PubMed] [Google Scholar]
- 5.Mempel TR, et al. Regulatory T cells reversibly suppress cytotoxic T cell function independent of effector differentiation. Immunity. 2006;25(1):129–141. doi: 10.1016/j.immuni.2006.04.015. [DOI] [PubMed] [Google Scholar]
- 6.Breart B, Lemaître F, Celli S, Bousso P. Two-photon imaging of intratumoral CD8+ T cell cytotoxic activity during adoptive T cell therapy in mice. J Clin Invest. 2008;118(4):1390–1397. doi: 10.1172/JCI34388. [DOI] [PMC free article] [PubMed] [Google Scholar]
- 7.Beattie L, et al. Dynamic imaging of experimental Leishmania donovani-induced hepatic granulomas detects Kupffer cell-restricted antigen presentation to antigen-specific CD8 T cells. PLoS Pathog. 2010;6(3):e1000805. doi: 10.1371/journal.ppat.1000805. [DOI] [PMC free article] [PubMed] [Google Scholar]
- 8.Schaeffer M, et al. Dynamic imaging of T cell-parasite interactions in the brains of mice chronically infected with Toxoplasma gondii. J Immunol. 2009;182(10):6379–6393. doi: 10.4049/jimmunol.0804307. [DOI] [PubMed] [Google Scholar]
- 9.Waite JC, et al. Dynamic imaging of the effector immune response to listeria infection in vivo. PLoS Pathog. 2011;7(3):e1001326. doi: 10.1371/journal.ppat.1001326. [DOI] [PMC free article] [PubMed] [Google Scholar]
- 10.Wilson EH, et al. Behavior of parasite-specific effector CD8+ T cells in the brain and visualization of a kinesis-associated system of reticular fibers. Immunity. 2009;30(2):300–311. doi: 10.1016/j.immuni.2008.12.013. [DOI] [PMC free article] [PubMed] [Google Scholar]
- 11.Kastenmüller W, et al. Peripheral prepositioning and local CXCL9 chemokine-mediated guidance orchestrate rapid memory CD8(+) T cell responses in the lymph node. Immunity. 2013;38(3):502–513. doi: 10.1016/j.immuni.2012.11.012. [DOI] [PMC free article] [PubMed] [Google Scholar]
- 12.Stinchcombe JC, Bossi G, Booth S, Griffiths GM. The immunological synapse of CTL contains a secretory domain and membrane bridges. Immunity. 2001;15(5):751–761. doi: 10.1016/s1074-7613(01)00234-5. [DOI] [PubMed] [Google Scholar]
- 13.Schmidt NW, et al. Memory CD8 T cell responses exceeding a large but definable threshold provide long-term immunity to malaria. Proc Natl Acad Sci USA. 2008;105(37):14017–14022. doi: 10.1073/pnas.0805452105. [DOI] [PMC free article] [PubMed] [Google Scholar]
- 14.Thiberge S, et al. In vivo imaging of malaria parasites in the murine liver. Nat Protoc. 2007;2(7):1811–1818. doi: 10.1038/nprot.2007.257. [DOI] [PubMed] [Google Scholar]
- 15.Sano G, et al. Swift development of protective effector functions in naive CD8(+) T cells against malaria liver stages. J Exp Med. 2001;194(2):173–180. doi: 10.1084/jem.194.2.173. [DOI] [PMC free article] [PubMed] [Google Scholar]
- 16.Spangrude GJ, Sacchi F, Hill HR, Van Epps DE, Daynes RA. Inhibition of lymphocyte and neutrophil chemotaxis by pertussis toxin. J Immunol. 1985;135(6):4135–4143. [PubMed] [Google Scholar]
- 17.Klonowski KD, et al. Dynamics of blood-borne CD8 memory T cell migration in vivo. Immunity. 2004;20(5):551–562. doi: 10.1016/s1074-7613(04)00103-7. [DOI] [PubMed] [Google Scholar]
- 18.Hoffman SL, et al. Sporozoite vaccine induces genetically restricted T cell elimination of malaria from hepatocytes. Science. 1989;244(4908):1078–1081. doi: 10.1126/science.2524877. [DOI] [PubMed] [Google Scholar]
- 19.Schmidt NW, Butler NS, Badovinac VP, Harty JT. Extreme CD8 T cell requirements for anti-malarial liver-stage immunity following immunization with radiation attenuated sporozoites. PLoS Pathog. 2010;6(7):e1000998. doi: 10.1371/journal.ppat.1000998. [DOI] [PMC free article] [PubMed] [Google Scholar]
- 20.Cockburn IA, et al. Prolonged antigen presentation is required for optimal CD8+ T cell responses against malaria liver stage parasites. PLoS Pathog. 2010;6(5):e1000877. doi: 10.1371/journal.ppat.1000877. [DOI] [PMC free article] [PubMed] [Google Scholar]
- 21.Boissonnas A, Fetler L, Zeelenberg IS, Hugues S, Amigorena S. In vivo imaging of cytotoxic T cell infiltration and elimination of a solid tumor. J Exp Med. 2007;204(2):345–356. doi: 10.1084/jem.20061890. [DOI] [PMC free article] [PubMed] [Google Scholar]
- 22.Mrass P, et al. Random migration precedes stable target cell interactions of tumor-infiltrating T cells. J Exp Med. 2006;203(12):2749–2761. doi: 10.1084/jem.20060710. [DOI] [PMC free article] [PubMed] [Google Scholar]
- 23.Chtanova T, et al. Dynamics of T cell, antigen-presenting cell, and pathogen interactions during recall responses in the lymph node. Immunity. 2009;31(2):342–355. doi: 10.1016/j.immuni.2009.06.023. [DOI] [PMC free article] [PubMed] [Google Scholar]
- 24.Egen JG, et al. Macrophage and T cell dynamics during the development and disintegration of mycobacterial granulomas. Immunity. 2008;28(2):271–284. doi: 10.1016/j.immuni.2007.12.010. [DOI] [PMC free article] [PubMed] [Google Scholar]
- 25.Filipe-Santos O, et al. A dynamic map of antigen recognition by CD4 T cells at the site of Leishmania major infection. Cell Host Microbe. 2009;6(1):23–33. doi: 10.1016/j.chom.2009.04.014. [DOI] [PubMed] [Google Scholar]
- 26.Harris TH, et al. Generalized Lévy walks and the role of chemokines in migration of effector CD8+ T cells. Nature. 2012;486(7404):545–548. doi: 10.1038/nature11098. [DOI] [PMC free article] [PubMed] [Google Scholar]
- 27.Kohlmeier JE, et al. The chemokine receptor CCR5 plays a key role in the early memory CD8+ T cell response to respiratory virus infections. Immunity. 2008;29(1):101–113. doi: 10.1016/j.immuni.2008.05.011. [DOI] [PMC free article] [PubMed] [Google Scholar]
- 28.Sung JH, et al. Chemokine guidance of central memory T cells is critical for antiviral recall responses in lymph nodes. Cell. 2012;150(6):1249–1263. doi: 10.1016/j.cell.2012.08.015. [DOI] [PMC free article] [PubMed] [Google Scholar]
- 29.Precopio ML, et al. Immunization with vaccinia virus induces polyfunctional and phenotypically distinctive CD8(+) T cell responses. J Exp Med. 2007;204(6):1405–1416. doi: 10.1084/jem.20062363. [DOI] [PMC free article] [PubMed] [Google Scholar]
- 30.Butler NS, Schmidt NW, Harty JT. Differential effector pathways regulate memory CD8 T cell immunity against Plasmodium berghei vs. P. yoelii sporozoites. J Immunol. 2010;184(5):2528–2538. doi: 10.4049/jimmunol.0903529. [DOI] [PMC free article] [PubMed] [Google Scholar]
- 31.Ono T, Tadakuma T, Rodriguez A. Plasmodium yoelii yoelii 17XNL constitutively expressing GFP throughout the life cycle. Exp Parasitol. 2007;115(3):310–313. doi: 10.1016/j.exppara.2006.09.008. [DOI] [PMC free article] [PubMed] [Google Scholar]
Associated Data
This section collects any data citations, data availability statements, or supplementary materials included in this article.