

Abstract
Single-particle cryo-EM is a powerful approach to determine the structure of large macromolecules and assemblies thereof in many cases at subnanometer resolution. It has become popular to refine or flexibly fit atomic models into density maps derived from cryo-EM experiments. These density maps are typically significantly lower in resolution than electron density maps obtained from X-ray diffraction experiments, such that the number of parameters that need to be determined is much larger than the number of experimental observables. Overfitting and misinterpretation of the density, thus, become a serious problem. For diffraction data, a cross-validation approach was introduced almost 20 y ago; however, no such approach has been described yet for structure refinement against cryo-EM density maps, although the overfitting problem is, because of the lower resolution, significantly larger. We present a cross-validation approach for real-space refinement against cryo-EM density maps in analogy to cross-validation typically used in crystallography. Our approach is able to detect overfitting and allows for optimizing the choice of restraints used in the refinement. The approach is shown on three protein structures with simulated data and experimental data of the rotavirus double-layer particle. Because cross-validation requires splitting the dataset into at least two independent sets, we further present an approach to quantify correlations between the structure factor sets. This analysis is also helpful for other cross-validation applications, such as refinements against diffraction data or 3D reconstructions of cryo-EM density maps.
Keywords: flexible fitting, real-space structure refinement
Single-particle cryo-EM has emerged as a powerful tool to determine the structure of large biomolecular systems. The images of single particles in different orientations are recorded, which allows us to reconstruct a 3D density distribution of an average over these individual particles. These reconstructed density maps are typically in the medium- to low-resolution range of about 4–20 Å. These resolutions are usually not sufficient to directly build atomic models of macromolecules. However, in many cases, the cryo-EM density provides enough information to place individual proteins or protein domains that have been determined to higher resolution by X-ray crystallography or NMR spectroscopy or that have been built by homology modeling. Low-resolution density maps (worse than 15 Å) determine mostly the overall shape of a macromolecule, in which case the constituent individual proteins can be docked as rigid bodies into the density map (1–3), which might reveal the organization of complex protein assemblies (4–6). For the medium-resolution range between 4 and 15 Å, where more structural details are visible, a number of tools have been developed to refine or flexibly fit atomic models into density maps (7–14). Some approaches use additional information during the refinement from either energy functions [e.g., MDFF (10), MDfit (12), or Rosetta (13)] or a reference structure [e.g., DireX (14)]. In most cases, the macromolecules that are to be fitted into the low-resolution density maps are large, which means that the number of parameters (i.e., the number of atomic coordinates) is much larger than the number of experimental observables. Therefore, the refinement of structures at low resolution is highly susceptible to overfitting and misinterpretation of noisy density features. To reduce this overfitting problem, it is common to apply restraints during the refinement, such as secondary structure restraints (10) or deformable elastic network (DEN) restraints (14, 15), in addition to constraining bond lengths and angles. Another option to reduce the number of degrees of freedom is to select only the first few elastic normal modes (11, 16–18). The main question is how to optimally choose the degrees of freedom or the restraints and their relative strengths to allow for sufficient flexibility on the one hand but avoid overfitting on the other hand. A solution to this problem is given by the concept of cross-validation, which was introduced to the closely related problem of X-ray crystallographic refinement almost 20 y ago (19) and has since drastically increased the reliability of refined crystal structures. The idea is to leave out the part of the data (the test set) that is not used for the refinement but only for assessment of the refined model. In crystallography, typically 10% of the structure factors are randomly chosen as the test set, whereas the remaining 90% of the structure factors (the work set) are used for refining the structure. As an alternative, the use of the phase residual for cross-validation in refinement against electron diffraction data has been described (20) but is restricted to reciprocal space refinement. Cross-validation approaches have also been described for 3D density reconstruction procedures from single-particle images (21,22).
A crucial prerequisite for the cross-validation is that the information in the test set is independent from the work set. For diffraction data, this assumption is usually justified. However, because of the very different nature of the experiment, for cryo-EM density maps, this assumption does not generally hold. Here, we adapt the crystallographic cross-validation approach to structure refinement against cryo-EM data. The method is tested on three proteins with simulated data, where the target structure is known, and the rotavirus double-layer particle with experimental cryo-EM density map at a resolution of 8 Å.
Results
For cross-validation, the dataset needs to be split into two independent sets of structure factors. However, several factors lead to correlations between these structure factors: in cryo-EM reconstructions, the particle is usually placed at the center and surrounded by a void. If the particle is of limited size in real space, then there are correlations between neighboring Fourier components (23, 24). Smoothing a function (and thereby, introducing correlations between neighboring function values) by suppressing its high-frequency Fourier components has the same effect. In addition, the alignment of the images during the density reconstruction procedure introduces additional correlations of the noise in these images (25). In cryo-EM, the structure factors are, therefore, too strongly correlated, such that a random choice of the structure factors for the test set, which is usually done in crystallography, is not optimal. Furthermore, the signal-to-noise ratio (SNR) for cryo-EM density maps decreases for higher spatial frequencies. The Fourier shell correlation (FSC) (26) can be computed as a measure of the SNR in the individual Fourier shells and is shown in Fig. 1A for three model systems described below at two different resolutions of 5 and 10 Å. The reconstructed density maps are usually filtered to remove noise originating from the higher spatial frequency range (i.e., information from this range is often neglected in the interpretation of the density). However, the signal in this high-frequency band might still be strong enough to be useful for validation, which is shown below. We, therefore, propose to define as the test set for the cross-validation a continuous band (the free band) from this high-frequency region. The wider the free band, the less cross-talk occurs between structure factors within and outside the band, and the less correlated it is with the work band. The cross-talk is an even more serious problem at low resolution, because the low-resolution Fourier components are closer in reciprocal space than the high-frequency components (e.g., the Fourier components with a spatial frequency of 1/8 and 1/9 Å are closer in reciprocal space than the 1/3 and 1/4 Å components).
Fig. 1.

(A) FSC curves of the simulated cryo-EM density maps are shown for all three models (1AKE, 1IKN, and 1HRD) at resolutions of 5 and 10 Å. Red bars on top indicate the spatial frequency range that is used as the free band. Green bars on top indicate the spatial frequency range that is used as the work band. (B) FSC curves for the rotavirus DLP are shown for the standard even/odd tests for the low-resolution reconstruction (solid black) and comparison between the low-resolution reconstruction and the density map computed from the optimally fitted (scrambled) crystal structure (dashed blue). The FSC between the low-resolution reconstruction and the perfectly overfitted bead model (dotted red) is significantly larger in the work range and significantly smaller in the free range than the other two curves. The fact that the curve does not drop to zero in the free interval (red area) indicates correlations between structure factors from the work and free ranges. (A and B) The red areas indicate the frequency range that was used for the free interval.
Quantify Correlations by Perfect Overfitting.
To quantify these correlations, we propose to generate a perfectly overfitted model, which should reveal any correlation between the free and work bands. First a generic bead model is generated by randomly placing a large number of point masses (beads) into the work map. This bead model is then refined against the work map using a simulated annealing procedure, which allows fitting the work map with a correlation of better than 0.999. No information from the free band is used when either placing the beads or refining the bead model. To illustrate this fact for the rotavirus case (described below in more detail), Fig. 1B, Inset shows the bead model (small red dots) and a comparison between the work maps of the experimental and model density (gray surface and blue mesh, respectively). Fig. 1B shows FSC curves comparing the fitted models with the target density map for the rigid body, optimally restrained, and perfectly overfitted model. Ideally, if there were no correlations between the free and work bands, the FSC of the perfectly overfitted model would drop from about one to zero exactly at the high-frequency cutoff of the work band. However, in this case, there is clearly a noticeable correlation (Fig. 1B, dotted red line). Therefore, the correlation between the free density maps is significant higher for the fitted atomic model than the perfectly overfitted bead model. The choice of resolution shells for the selection of the test set has been described before for X-ray crystallography (27–29) to reduce correlations between the test and work sets in the case of high noncrystallographic symmetry. Similarly, the use of free resolution shells has been used by Shaikh et al. (21) to cross-validate the 3D reconstruction procedure. Our approach of perfectly overfitted bead models might also be useful to analyze the correlations in both of these situations to ensure sufficient independence of the free set.
DireX/DEN Refinement.
The approach has been implemented into the real-space refinement program DireX (14, 30), which optimizes the overlap of a density map computed from the model with the target (experimental) density map (SI Methods). For the cross-validated refinement, we compute the model density map using only Fourier components from the work band and also, filter the target density map with a rectangular filter as defined by the work band. DireX uses DEN restraints (14, 15) to account for the low observation-to-parameter ratio at low resolution. These harmonic restraints are defined between randomly chosen atom pairs that are within a distance range of typically 3–15 Å. The deformability is achieved by allowing the minimum of the network potential to move and balance the influence of the density map and a set of reference coordinates, which in the cases presented here, are equal to the coordinates of the starting models. The strength of these restraints relative to other forces is determined by the weight factor wDEN, and the deformability of the network is controlled by the parameter-γ, where γ = 0 means no deformability and γ = 1 means maximum deformability (i.e., no information about the reference model is used). These two parameters, γ and wDEN, need to be optimized, and it is shown here how the optimization can be done using cross-validation. Other refinement programs might need to optimize different restraints, which is possible analogously with our approach.
Measure of Fit.
The traditional measure of the fit of a model to diffraction data is the R value, which compares the amplitudes of structure factors. The free R value is then defined by considering only structure factors from the test set T in the calculation of the R value. We denote the free R value as  or
or  when the structure factors were selected randomly or from a continuous interval, respectively. Here, the R values are computed after matching the radial structure factor distribution of the model to the distribution of the target. In the case of EM, a more natural choice for the measure of the fit is the correlation of the density map computed from the model,
  , with the experimental density map,
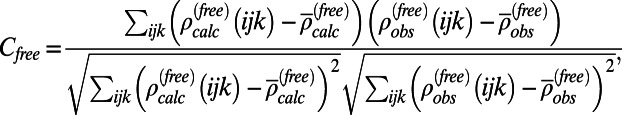
  . Here, we consider two different correlations: (i) the free map correlation, Cfree, where only structure factors from the free band were used to compute both density maps,
 |
and (ii) the work map correlation, Cwork, which is analogously defined for  , for which only structure factors from the work band were used. It should be noted that the absolute values of Cfree and Cwork cannot be compared directly, because they are computed on different frequency ranges, unlike
  and
and  , which are drawn from the same distribution of R values. For higher spatial frequencies, smaller changes in the atomic coordinates lead to larger changes of the correlation.
Tests with Simulated Data.
We tested the approach on three different proteins with simulated cryo-EM density maps at 5 and 10 Å resolution. The starting models are homology models taken from the benchmark set in the work by Topf et al. (8), where we chose an easy (1AKE; single domain), an intermediate (1IKN; two domain), and a hard (1HRD; two domain) case. The sequence identity of 1AKE, 1IKN, and 1HRD is 46%, 46%, and 28%, respectively, and the corresponding initial rmsd of the starting from the target structure is 3.6, 7.7, and 6.0 Å, respectively. An overview of all cases is given in Table 1. To simulate realistic density maps, we computed 900 projection images from each target structure with the program EMAN (31) and applied noise and a contrast transfer function for different defocus values to them (SI Methods) (32). The noise level was chosen such as to obtain a resolution of 5 or 10 Å (FSC0.5 criterion) for the final reconstructed density. These images were then used to reconstruct a density map with EMAN. Fig. 1A shows the FSC curves for all six cases (three models/maps at resolutions of 5 and 10 Å). The red bars at the top of Fig. 1A indicate the regions that are used here for the free set: for the 10 Å data, we use the range of 7–11 Å, and for the 5 Å data, we use the range of 4–6 Å. The work and free maps for two of these cases are visualized in SI Methods.
Table 1.
Summary of refinement results for three models with synthetic density maps
| Protein Data Bank ID code | Initial rmsd | 5 Å |
10 Å |
||||||||||
| Optimum restraints |
No restraints |
Optimum restraints |
No restraints |
||||||||||
| rmsd | CWork | CFree | rmsd | CWork | CFree | rmsd | CWork | CFree | rmsd | CWork | CFree | ||
| 1AKE | 3.60 | 1.40 | 0.874 | 0.211 | 1.86 | 0.880 | 0.189 | 1.47 | 0.907 | 0.524 | 2.67 | 0.911 | 0.425 |
| 1IKN | 7.73 | 1.80 | 0.822 | 0.355 | 7.94 | 0.853 | 0.175 | 2.14 | 0.859 | 0.441 | 8.30 | 0.871 | 0.354 |
| 1HRD | 5.96 | 3.88 | 0.832 | 0.235 | 3.99 | 0.850 | 0.167 | 4.30 | 0.854 | 0.365 | 4.95 | 0.874 | 0.316 |
The three models were taken from the homology model benchmark set from the work by Topf et al. (8) and represent an easy (1AKE), an intermediate (1IKN), and a hard (1HRD) case in terms of structural similarity between starting and target models. Refinements were done with and without DEN restraints for two resolutions: 5 and 10 Å. Results for the optimum restraints correspond to the DEN parameters that lead to the highest free density map correlation, Cfree. The rmsd (Å) of the refined to the target structure is always lower when using optimal restraints. The work map correlation, Cwork, is always higher without restraints compared with using optimum restraints, because the model fits the density map much better. However, without restraints, the rmsd of the refined to the target structure is always higher, indicating that the density is overfitted. Cfree is always higher when refining with optimum restraints compared with refinements without restraints, and higher Cfree values always correspond to better structures with lower rmsd.
DEN Parameter Optimization.
For each case we performed 300 refinements in total with five different wDEN and six different γ-parameters in the ranges 0.0–0.4 and 0.0–1.0, respectively. For each of these 30 DEN parameter combinations, 10 independent refinement runs were performed with different random number seeds. For the third case (1HRD) at 10 Å, contour plots (Fig. 2) show the dependency of the rmsd of the refined structure to the target structure, Cfree,  , and Cwork values on the wDEN and γ-parameters. The best structure, which corresponds to the lowest rmsd value of 4.29 Å, is obtained for wDEN = 0.1 and γ = 0.8 (Fig. 2A), whereas the highest Cfree is obtained for wDEN = 0.05 and γ = 0.4, which in turn, yields a structure that has an rmsd of 4.30 Å to the correct structure that is very similar to the rmsd of the best structure (4.29 Å). Therefore, picking the best Cfree yields a model that is very close to the best solution. High γ-values and low wDEN values correspond to weak restraints and lead to overfitted structures and hence, a large rmsd. The work map correlation (Cwork) is highest for these overfitted high rmsd structures, indicating that Cwork is not a good measure of the quality of the structure. In contrast, the contour plots of the rmsd and Cfree values have a very similar shape; particularly, the largest free correlation is found in the same region where the rmsd is lowest. The corresponding contour plots for all other cases are shown in SI Methods. The correlation between Cfree and rmsd is very strong, with −0.90 averaged over all six cases, suggesting that Cfree is, in fact, a good measure to detect the optimum structure. The
  value shows a good agreement with the rmsd as well; the correlation between
  and rmsd averaged over all six cases is 0.84. However,
  is not correlated with the rmsd, with an average correlation of −0.18.
Fig. 2.

Refinement results for the most difficult case 1HRD at 10 Å. Contour plots showing (A) the rmsd between refined model and correct crystal structure and (B) the free correlation, Cfree, (C) the free R value,  , and (D) the correlation of the work maps, Cwork, as a function of the strength, wDEN, and the deformability, γ, of the DEN restraints (DireX/DEN Refinement). Generally, the structure is less restrained with smaller wDEN and larger γ-values. The highest Cfree values fall into the same region of the parameters wDEN and γ, for which the rmsd is lowest. The Cwork value instead increases constantly for weaker restraints (smaller wDEN values) and higher deformability (larger γ-values) and therefore, is not correlated with the rmsd value.
Overview of All Refinements.
An overview of the results of all refinements is shown in Table 1, where refinements using optimum DEN restraints are compared with refinements without DEN restraints. For all cases, the optimum DEN parameters are determined by the maximum Cfree value. Without DEN restraints, most models are strongly overfit, leading to low rmsd values. As expected, Cwork is higher for these models, because without restraints, the model can be refined further to fit the density better. The Cfree value is, instead, always higher for the optimally restrained model and therefore, is in all cases able to detect the better model, even when the model is far from the correct structure, which is shown by the 1HRD case (Fig. 2). The template used for building the model for 1HRD has a relatively low sequence identity (28%), and the initial homology model has, therefore, several regions with severe errors, which cannot be corrected by refinement alone but instead, would need extensive remodeling.
Application to Real Data of the Rotavirus Double-Layer Particle.
One complication with testing a method on real data is that the correct structure is not precisely known. Thus, instead of comparing a fitted model with a crystal (or other reference) structure, we computed a low-resolution density map from the same dataset from which a high-resolution density map could be reconstructed. We then fitted a model to the low-resolution map and assessed this low-resolution (LR) model by comparing it directly with the high-resolution density map. Here, we chose a dataset of the double-layer particle (DLP) of the rotavirus made available by N. Grigorieff (Brandeis University, Waltham, MA) (33). The original high-resolution density map (EMDatabank ID 1461) was reconstructed using the best 8,400 of 18,120 particle images imposing 60-fold icosahedral symmetry and additional 13-fold nonicosahedral symmetry constraints, yielding a resolution of 3.8 Å (determined by comparison with an X-ray crystallographic map). The resulting density is shown in Fig. 3A superimposed with a crystal structure (Protein Data Bank ID code 1QHD) of the same protein (34). This high-resolution density map was used as the true answer in this test case. The low-resolution test density map was computed using all 18,120 particles with the originally assigned Euler angles but without imposing any (not even icosahedral) symmetry constraints. The obtained density map (Fig. 3B) has a resolution of 8.6 (6.6) as determined by the FSC = 0.5 (FSC = 0.143) criterion. The FSC of this low-resolution reconstruction is shown in Fig. 3C.
Fig. 3.

High- and low-resolution reconstructions of the rotavirus DLP. (A) Shown is the original high-resolution reconstruction (EMDatabank ID 1461) with a resolution of 3.8 Å (determined by comparison with an X-ray crystallographic map) superimposed with the crystal structure (Protein Data Bank ID code 1QHD) refined against this density (HR model). (B) Shown is a low-resolution reconstruction using the same image data but without applying any symmetry constraints. The resolution of this density map is 8.6 (6.6) with the FSC = 0.5 (FSC = 0.143) criterion. Superimposed are the crystal structure (orange), the scrambled crystal structure (yellow), and the structure refined against the high-resolution density [HR model; green (same as in A)]. (C) The FSC curve of the low-resolution reconstruction is shown together with the choice of the work range (green area) and the free range (red).
The crystal structure fits very well to the cryo-EM density map (Fig. 3 A and B), and its refinement leads to only small changes, with an rmsd of 0.94 Å. The interval 6–8 Å has been defined as the free band, and refinements for different combinations of DEN parameters were performed. The result of this parameter search is illustrated in the contour plots in Fig. 4 C–E. The optimal DEN parameters for which Cfree is maximized are γ = 0.0 and wDEN = 0.7 (red circles in Fig. 4 C and D), which means that the restraints were very strong and nondeformable. For comparison, the crystal structure was also refined to the high-resolution density to obtain a high-resolution (HR) model. The rmsd values of the HR model to the crystal structure and the LR model were 1.06 and 0.82 Å, respectively. Fig. 4A shows the crystal structure (orange), the LR model (blue), and the HR model (green). The main assessment of the LR model quality is done by computing the density correlation coefficient, CTarget, between the high-resolution density and a density computed from the LR model. The optimal DEN restraints yield a CTarget value of 71.32%.
Fig. 4.

Low-resolution DEN refinement results for the rotavirus DLP. The refinements were performed for different combinations of wDEN and γ-parameters. The models obtained with the optimal DEN parameters are shown in blue when starting from (A) the original (orange) and (B) the scrambled (yellow) crystal structures. For comparison, the crystal structure that has been refined against the original high-resolution density map (EMDatabank ID 1461) is shown in green. The dependence of the CTarget, Cfree, and Cwork values on the two DEN parameters obtained for (C–E) the crystal structure and (F–H) the scrambled crystal structure is shown as contour plots. CTarget is the correlation between the density map computed from the fitted model and the high-resolution density map, and it directly measures the quality of the fitted model.
To simulate the situation where the starting model is more distant from the correct solution, the crystal structure was scrambled by a 500-step run of DireX using a large diffusion coefficient without any density map restraints (Fig. 4B, yellow), yielding a model with an rmsd value of 3.1 Å from the crystal structure. The best refinement of this scrambled model yields an rmsd value of 2.2 Å to the HR model and a CTarget value of 53.33%. Fig. 4 F–H shows the parameter search for the scrambled model. The contour plots of CTarget and Cfree are clearly similar and have their maxima at the same DEN parameter combination.
Analysis of Correlations Between Free and Work Map.
To make sure the Cfree value is significant compared with the intrinsic correlation of structure factors between the free map and the work map, the work map is perfectly fitted with a generic bead model as described above and shown in Fig. 1B. The model consists of 11,162 beads and is fitted to the low-resolution density map using a simulated annealing procedure. The Cwork value of this perfectly overfitted model is 0.9768 ± 0.0004 when calculated over the entire volume and 0.9997 ± 0.0000 in the region that is covered by the bead model; the corresponding Cfree values are 0.2060 ± 0.0081 and 0.1987 ± 0.0081, respectively. The Cfree value obtained from the refinement of the scrambled crystal structure is 0.2869 ± 0.0078 and thus, significantly higher than the intrinsic correlation between the free and work bands. The errors are given by the SE, 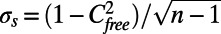 , of the correlation coefficient.
Choice of Free Band.
Fig. 5 shows the effect of the choice of the free band on the Cfree values. For each of three different choices (4–6, 6–8, and 8–10 Å), 100 refinements were performed, and the resulting distribution of Cfree values were plotted. All refinements were started from the scrambled crystal structure. The interval is optimally chosen when those restraint settings that are to be distinguished yield significantly different Cfree values and when the Cfree values are significantly larger than those values from the perfectly overfitted model. In addition to the SD,  , of the Cfree distribution that is caused by the stochastic nature of the refinement procedure, the SE,
  , of the calculation of a Cfree value has to be taken into account, where n is the number of Fourier components used to compute the density map. Two Cfree distributions are significantly different when the total error bars,
 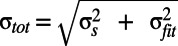 , are clearly separated (indicated by the black arrow in Fig. 5). The perfectly overfitted bead model Cfree values (gray) are best separated from the values obtained with the optimal restraints when using the 6- to 8-Å interval. We denote optimal restraints (γ = 0.4; wDEN = 0.3) as those restraints for which the highest Cfree values are obtained with the 6- to 8-Å interval. For the higher-frequency interval (4–6 Å), the noise leads to generally smaller Cfree values, where the values from optimal and strong restraints cannot be clearly distinguished. For the lower-frequency interval (8–10 Å), the correlations between the structure factors become larger, such that the Cfree values of the refined model become less significant with respect to the perfectly overfitted model. In general, the quality of the model also depends on the work map cutoff: for a too low-resolution cutoff, useful information is ignored, and for a too high-resolution cutoff, excessive noise hinders refinement. These effects were studied for the three synthetic test cases and are described in detail in SI Methods.
Fig. 5.

The choice of the free interval affects the significance of the obtained Cfree value. Three choices of (A) 4–6, (B) 6–8, and (C) 8–10 Å have been tested. For each of these frequency ranges and each restraint setting, 100 refinements were performed, yielding distributions of Cfree values. Results for the perfectly overfitted bead model (gray) are compared with rigid body fitting (green), fittings with strong restraints (orange), and optimal (yielding the largest average Cfree value) restraints (blue). For reliable cross-validation, the Cfree value of the fitted model needs to be significantly larger than the Cfree value from the perfectly overfitted model (i.e., the distributions of these values need to be separated). The blue and gray error bars on top of the Cfree distributions indicate the total error (including fitting and SE). The difference between these two distributions is largest for the 6- to 8-Å interval (indicated by the black arrow), which means that this interval is the best choice in this case. The average rmsd values for the different restraint settings are noted next to the corresponding Cfree distributions. The highest Cfree value (0.303) for the optimal free interval (6–8 Å) and the optimal restraints yields an rmsd value of 2.18 Å.
Discussion
The refinement of large biomolecular structures against low-resolution density maps obtained from single-particle cryo-EM is highly susceptible to overfitting, because the number of parameters (i.e., the atomic coordinates) is typically much larger than the number of experimental observables. We present an approach for the cross-validation of structure refinement against such cryo-EM density maps that is able to detect overfitting (Fig. 6). The structure factors that are omitted from the work set and used for validation are taken from a spatial frequency range with a relatively low SNR. These structure factors are typically not reliable for direct interpretation and usually ignored. However, the signal in this frequency range is still strong enough for validation. The broader this test frequency range is and the more it extends to lower frequencies with larger SNR, the more robust is the validation measure. However, the more signal that is omitted during the refinement, the lower the quality of the refined structure. It is interesting to note the similarity to the particle orientation refinement for the 3D reconstruction, which should be carried out neglecting higher-resolution components; therefore, the resolution given by the FSC is effectively cross-validated (22).
Fig. 6.

Flowchart summarizing the main steps of the cross-validation procedure.
For optimal cross-validation, the free set needs to be independent from the work set, which is, however, not exactly the case for cryo-EM data, because correlations between structure factors can be significant. These correlations could, in principle, be decreased by refining the model against the work band of a density that has been computed from only one-half of the images (e.g., even images), whereas Cfree is computed with the free band of a density that has been computed from the other one-half of the images (odd images). However, we found this procedure usually not to be necessary. To analyze the correlations between the structure factors, we developed the perfect overfitting method, which ensures that the cross-validation measure is, in fact, robust and significant. This method could also be useful to quantify correlations between the free and work sets in other cross-validation applications, such as 3D density reconstruction (21) and crystallographic refinement with high symmetry (for example, in the case of icosahedral viruses).
As a cross-validation measure, we proposed the free map correlation Cfree, and we have shown that it correlates well with the overall correctness of the model. Refined structures with a large Cfree value also have a low rmsd to the correct structure for three test proteins with simulated data. The Cfree value can therefore be used to optimize the choice of restraints used in refinement. Depending on which optimum parameters are chosen by Cfree, DEN refinement can cover the entire range from completely unrestrained to (almost) rigid body refinement. The cross-validation approach itself is independent of the particular choice of restraints, and therefore, our approach is of general applicability and can be used to optimize very different types of restraints used by other refinement programs. It should also help to decide whether, in the case of very low-resolution data (>10 Å), flexible refinement can be justified at all or whether rigid body fitting should instead be pursued. Finally, we expect that this cross-validation approach increases the reliability of refined structures and reduces mis- or overinterpretation of noisy and low-resolution density maps obtained from cryo-EM experiments.
Methods
All refinements and density map calculations were done with DireX (14). Density reconstructions were performed with the programs EMAN (31) and Frealign (35). Details on refinement protocols and the generation of bead models for perfect overfitting are described in SI Methods.
Supplementary Material
Acknowledgments
Image data of the rotavirus double-layer particle and Frealign scripts were kindly made available by N. Grigorieff. We thank Ed Egelman for helpful discussions. We also thank the anonymous reviewer for helpful comments and suggestions.
Footnotes
The authors declare no conflict of interest.
This article is a PNAS Direct Submission.
This article contains supporting information online at www.pnas.org/lookup/suppl/doi:10.1073/pnas.1119041110/-/DCSupplemental.
References
- 1.Roseman AM. Docking structures of domains into maps from cryo-electron microscopy using local correlation. Acta Crystallogr D Biol Crystallogr. 2000;56(Pt 10):1332–1340. doi: 10.1107/s0907444900010908. [DOI] [PubMed] [Google Scholar]
- 2.Rossmann MG. Fitting atomic models into electron-microscopy maps. Acta Crystallogr D Biol Crystallogr. 2000;56(Pt 10):1341–1349. doi: 10.1107/s0907444900009562. [DOI] [PubMed] [Google Scholar]
- 3.Pettersen EF, et al. UCSF Chimera—a visualization system for exploratory research and analysis. J Comput Chem. 2004;25(13):1605–1612. doi: 10.1002/jcc.20084. [DOI] [PubMed] [Google Scholar]
- 4.Dror O, Lasker K, Nussinov R, Wolfson H. EMatch: An efficient method for aligning atomic resolution subunits into intermediate-resolution cryo-EM maps of large macromolecular assemblies. Acta Crystallogr D Biol Crystallogr. 2007;63(Pt 1):42–49. doi: 10.1107/S0907444906041059. [DOI] [PMC free article] [PubMed] [Google Scholar]
- 5.Lasker K, Topf M, Sali A, Wolfson HJ. Inferential optimization for simultaneous fitting of multiple components into a CryoEM map of their assembly. J Mol Biol. 2009;388(1):180–194. doi: 10.1016/j.jmb.2009.02.031. [DOI] [PMC free article] [PubMed] [Google Scholar]
- 6.Rossmann MG, Morais MC, Leiman PG, Zhang W. Combining X-ray crystallography and electron microscopy. Structure. 2005;13(3):355–362. doi: 10.1016/j.str.2005.01.005. [DOI] [PMC free article] [PubMed] [Google Scholar]
- 7.Wriggers W, Milligan RA, McCammon JA. Situs: A package for docking crystal structures into low-resolution maps from electron microscopy. J Struct Biol. 1999;125(2–3):185–195. doi: 10.1006/jsbi.1998.4080. [DOI] [PubMed] [Google Scholar]
- 8.Topf M, et al. Protein structure fitting and refinement guided by cryo-EM density. Structure. 2008;16(2):295–307. doi: 10.1016/j.str.2007.11.016. [DOI] [PMC free article] [PubMed] [Google Scholar]
- 9.Fabiola F, Chapman MS. Fitting of high-resolution structures into electron microscopy reconstruction images. Structure. 2005;13(3):389–400. doi: 10.1016/j.str.2005.01.007. [DOI] [PubMed] [Google Scholar]
- 10.Trabuco LG, Villa E, Mitra K, Frank J, Schulten K. Flexible fitting of atomic structures into electron microscopy maps using molecular dynamics. Structure. 2008;16(5):673–683. doi: 10.1016/j.str.2008.03.005. [DOI] [PMC free article] [PubMed] [Google Scholar]
- 11.Tama F, Miyashita O, Brooks CL., 3rd Flexible multi-scale fitting of atomic structures into low-resolution electron density maps with elastic network normal mode analysis. J Mol Biol. 2004;337(4):985–999. doi: 10.1016/j.jmb.2004.01.048. [DOI] [PubMed] [Google Scholar]
- 12.Orzechowski M, Tama F. Flexible fitting of high-resolution x-ray structures into cryoelectron microscopy maps using biased molecular dynamics simulations. Biophys J. 2008;95(12):5692–5705. doi: 10.1529/biophysj.108.139451. [DOI] [PMC free article] [PubMed] [Google Scholar]
- 13.DiMaio F, Tyka MD, Baker ML, Chiu W, Baker D. Refinement of protein structures into low-resolution density maps using rosetta. J Mol Biol. 2009;392(1):181–190. doi: 10.1016/j.jmb.2009.07.008. [DOI] [PMC free article] [PubMed] [Google Scholar]
- 14.Schröder GF, Brunger AT, Levitt M. Combining efficient conformational sampling with a deformable elastic network model facilitates structure refinement at low resolution. Structure. 2007;15(12):1630–1641. doi: 10.1016/j.str.2007.09.021. [DOI] [PMC free article] [PubMed] [Google Scholar]
- 15.Schröder GF, Levitt M, Brunger AT. Super-resolution biomolecular crystallography with low-resolution data. Nature. 2010;464(7292):1218–1222. doi: 10.1038/nature08892. [DOI] [PMC free article] [PubMed] [Google Scholar]
- 16.Delarue M, Dumas P. On the use of low-frequency normal modes to enforce collective movements in refining macromolecular structural models. Proc Natl Acad Sci USA. 2004;101(18):6957–6962. doi: 10.1073/pnas.0400301101. [DOI] [PMC free article] [PubMed] [Google Scholar]
- 17.Suhre K, Navaza J, Sanejouand YH. NORMA: A tool for flexible fitting of high-resolution protein structures into low-resolution electron-microscopy-derived density maps. Acta Crystallogr D Biol Crystallogr. 2006;62(Pt 9):1098–1100. doi: 10.1107/S090744490602244X. [DOI] [PubMed] [Google Scholar]
- 18.Hinsen K, Reuter N, Navaza J, Stokes DL, Lacapère J-J. Normal mode-based fitting of atomic structure into electron density maps: Application to sarcoplasmic reticulum Ca-ATPase. Biophys J. 2005;88(2):818–827. doi: 10.1529/biophysj.104.050716. [DOI] [PMC free article] [PubMed] [Google Scholar]
- 19.Brünger AT. Free R value: A novel statistical quantity for assessing the accuracy of crystal structures. Nature. 1992;355(6359):472–475. doi: 10.1038/355472a0. [DOI] [PubMed] [Google Scholar]
- 20.Grigorieff N, Ceska TA, Downing KH, Baldwin JM, Henderson R. Electron-crystallographic refinement of the structure of bacteriorhodopsin. J Mol Biol. 1996;259(3):393–421. doi: 10.1006/jmbi.1996.0328. [DOI] [PubMed] [Google Scholar]
- 21.Shaikh TR, Hegerl R, Frank J. An approach to examining model dependence in EM reconstructions using cross-validation. J Struct Biol. 2003;142(2):301–310. doi: 10.1016/s1047-8477(03)00029-7. [DOI] [PubMed] [Google Scholar]
- 22.Scheres SHW, Chen S. Prevention of overfitting in cryo-EM structure determination. Nat Methods. 2012;9(9):853–854. doi: 10.1038/nmeth.2115. [DOI] [PMC free article] [PubMed] [Google Scholar]
- 23.Yang S, Yu X, Galkin VE, Egelman EH. Issues of resolution and polymorphism in single-particle reconstruction. J Struct Biol. 2003;144(1–2):162–171. doi: 10.1016/j.jsb.2003.09.016. [DOI] [PubMed] [Google Scholar]
- 24.Sousa D, Grigorieff N. Ab initio resolution measurement for single particle structures. J Struct Biol. 2007;157(1):201–210. doi: 10.1016/j.jsb.2006.08.003. [DOI] [PubMed] [Google Scholar]
- 25.Stewart A, Grigorieff N. Noise bias in the refinement of structures derived from single particles. Ultramicroscopy. 2004;102(1):67–84. doi: 10.1016/j.ultramic.2004.08.008. [DOI] [PubMed] [Google Scholar]
- 26.Harauz G, van Heel M. Exact filters for general geometry three dimensional reconstruction. Optik (Stuttg) 1986;73(4):146–156. [Google Scholar]
- 27.Fabiola F, Korostelev A, Chapman MS. Bias in cross-validated free R factors: Mitigation of the effects of non-crystallographic symmetry. Acta Crystallogr D Biol Crystallogr. 2006;62(Pt 3):227–238. doi: 10.1107/S0907444905040680. [DOI] [PubMed] [Google Scholar]
- 28.Kleywegt GJ, Jones TA. xdlMAPMAN and xdlDATAMAN—programs for reformatting, analysis and manipulation of biomacromolecular electron-density maps and reflection data sets. Acta Crystallogr D Biol Crystallogr. 1996;52(Pt 4):826–828. doi: 10.1107/S0907444995014983. [DOI] [PubMed] [Google Scholar]
- 29.Collaborative Computational Project, Number 4 The CCP4 suite: Programs for protein crystallography. Acta Crystallogr D Biol Crystallogr. 1994;50(Pt 5):760–763. doi: 10.1107/S0907444994003112. [DOI] [PubMed] [Google Scholar]
- 30.de Groot BL, et al. Groot BL de et al Prediction of protein conformational freedom from distance constraints. Proteins. 1997;29(2):240–251. doi: 10.1002/(sici)1097-0134(199710)29:2<240::aid-prot11>3.0.co;2-o. [DOI] [PubMed] [Google Scholar]
- 31.Ludtke SJ, Baldwin PR, Chiu W. EMAN: Semiautomated software for high-resolution single-particle reconstructions. J Struct Biol. 1999;128(1):82–97. doi: 10.1006/jsbi.1999.4174. [DOI] [PubMed] [Google Scholar]
- 32.Penczek PA, Zhu J, Schröder R, Frank J. Three dimensional reconstruction with contrast transfer compensation from defocus series. Scanning Microsc. 1997;11:147–154. [Google Scholar]
- 33.Zhang X, et al. Near-atomic resolution using electron cryomicroscopy and single-particle reconstruction. Proc Natl Acad Sci USA. 2008;105(6):1867–1872. doi: 10.1073/pnas.0711623105. [DOI] [PMC free article] [PubMed] [Google Scholar]
- 34.Mathieu M, et al. Atomic structure of the major capsid protein of rotavirus: Implications for the architecture of the virion. EMBO J. 2001;20(7):1485–1497. doi: 10.1093/emboj/20.7.1485. [DOI] [PMC free article] [PubMed] [Google Scholar]
- 35.Grigorieff N. FREALIGN: high-resolution refinement of single particle structures. J Struct Biol. 2007;157(1):117–125. doi: 10.1016/j.jsb.2006.05.004. [DOI] [PubMed] [Google Scholar]
Associated Data
This section collects any data citations, data availability statements, or supplementary materials included in this article.