Abstract
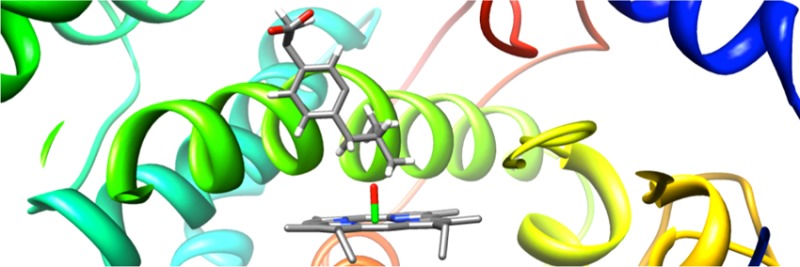
Cytochrome P450 enzymes (P450s) are important in drug metabolism and have been linked to adverse drug reactions. P450s display broad substrate reactivity, and prediction of metabolites is complex. QM/MM studies of P450 reactivity have provided insight into important details of the reaction mechanisms and have the potential to make predictions of metabolite formation. Here we present a comprehensive study of the oxidation of three widely used pharmaceutical compounds (S-ibuprofen, diclofenac, and S-warfarin) by one of the major drug-metabolizing P450 isoforms, CYP2C9. The reaction barriers to substrate oxidation by the iron-oxo species (Compound I) have been calculated at the B3LYP-D/CHARMM27 level for different possible metabolism sites for each drug, on multiple pathways. In the cases of ibuprofen and warfarin, the process with the lowest activation energy is consistent with the experimentally preferred metabolite. For diclofenac, the pathway leading to the experimentally observed metabolite is not the one with the lowest activation energy. This apparent inconsistency with experiment might be explained by the two very different binding modes involved in oxidation at the two competing positions. The carboxylate of diclofenac interacts strongly with the CYP2C9 Arg108 side chain in the transition state for formation of the observed metabolite—but not in that for the competing pathway. We compare reaction barriers calculated both in the presence and in the absence of the protein and observe a marked improvement in selectivity prediction ability upon inclusion of the protein for all of the substrates studied. The barriers calculated with the protein are generally higher than those calculated in the gas phase. This suggests that active-site residues surrounding the substrate play an important role in controlling selectivity in CYP2C9. The results show that inclusion of sampling (particularly) and dispersion effects is important in making accurate predictions of drug metabolism selectivity of P450s using QM/MM methods.
Introduction
The cytochrome P450 family of heme monooxygenase enzymes (P450s) plays an important role in the metabolism of drugs.1,2 Potentially harmful complications can sometimes occur during P450-mediated metabolism, such as drug–drug interactions and formation of toxic metabolites. Most drug molecules contain several sites that are susceptible to P450-mediated oxidation, and the site of oxidation may determine whether a toxic metabolite is formed. A detailed understanding of the mechanisms that govern drug metabolism processes at the atomic level is vital to accurately predict metabolites of new pharmaceutical compounds, which will help to eliminate potentially harmful leads at an early stage.
Many in silico methods have been developed for the prediction of P450 metabolite formation; these generally consist of four types: ligand-, structure-, rule-, and reactivity-based methods.3,4 Calculations on small models with QM methods fall into the latter category and can be useful in aiding in the understanding of how P450 enzymes work at the atomic level without the need for experimental data for parametrization/fitting, and can provide information for use in, e.g., quantitative structure–activity relationships (QSARs). For example, a structure–activity relationship was determined from the reaction barriers calculated for a range of substituted benzene molecules in a QM-only model of the active oxidizing species (Compound I, Cpd I).5 While model compounds can be useful in determining general chemical reactivity, such models often omit important details, such as steric effects due to the drug molecule interacting with the residues surrounding the active site. These effects are often important in determining at which site in a drug molecule oxidation occurs.6 Hybrid quantum mechanics/molecular mechanics (QM/MM) calculations surmount this problem, as the steric and electrostatic environment of the enzyme can be included in the calculation, hence providing a more accurate picture of reactivity than that possible with calculations performed for systems in vacuo.7,8
In previous work, we demonstrated that P450 chemoselectivity (e.g., hydroxylation versus epoxidation) can be predicted by comparing QM/MM reaction barriers to possible competing pathways.6,9 The favored pathway will usually be that with the lowest activation barrier to oxidation by Cpd I. For example, the selectivity in the metabolism of dextromethorphan by CYP2D6 was studied using QM and QM/MM methods.6 Many pharmaceutical compounds, such as dextromethorphan, contain multiple functional groups that are susceptible to P450 oxidation, in the case of dextromethorphan an aromatic ring, methoxy group, and N-CH3 group. QM calculations on a model system (comprised of anisole to represent the substrate, and a porphyrin group representation of Cpd I) predict that aromatic hydroxylation and oxidation of the methoxy group should be competitive. Indeed, aromatic oxidation is frequently observed in P450 metabolism of other substrates containing anisole fragments. In contrast, QM/MM (B3LYP/CHARMM27) calculations predict a much lower barrier to oxidation of the methoxy group, consistent with the fact that aromatic oxidation is not observed experimentally in this case.
Thus far, there have been few published QM/MM studies of large-molecule oxidation in human P450 isoforms.6,10 The formation of dopamine in CYP2D6, which occurs via aromatic hydroxylation of tyramine, has been studied with QM/MM at the B3LYP/CHARMM level.10 The authors observed that the mechanism favored by QM/MM calculations was not favored in a QM-only model, which reflects the influence of the protein environment on the reactivity of Cpd I. The stereoselectivity of hydrogen abstraction from S-(−)-nicotine in CYP2A6 has been studied using QM/MM and free energy methods.11 The authors observed that the barriers to abstraction of the hydrogen atoms cis and trans to the N-methyl group were similar; however, a more favorable free energy of binding (calculated using MM-PBSA) was observed for a binding position in which the trans hydrogen atom is placed close to the Cpd I oyxgen, in agreement with the experimentally observed stereoselectivity.
In this study, we describe QM and QM/MM modeling of the oxidation of three widely used pharmaceutical compounds by CYP2C9, namely diclofenac (1), S-ibuprofen (2), and S-warfarin (3, see Figure 1). We reveal key mechanistic features of these reactions and show that inclusion of the enzyme surrounding the active site is important for rationalizing experimentally observed selectivity. These features are also likely to be important for making predictions of metabolism for new drugs. We have developed and demonstrate here a successful protocol for this type of modeling application, in particular showing the importance of including conformational sampling and dispersion in DFT-based QM/MM calculations.
Figure 1.
Chemical structures of the drug molecules studied in this work: diclofenac (1), S-ibuprofen (2), and S-warfarin (3). Atoms numbered according to convention used in the current work. Diclofenac and ibuprofen were modeled in the QM/MM calculations here as the carboxylate (negatively charged) forms.
Ibuprofen
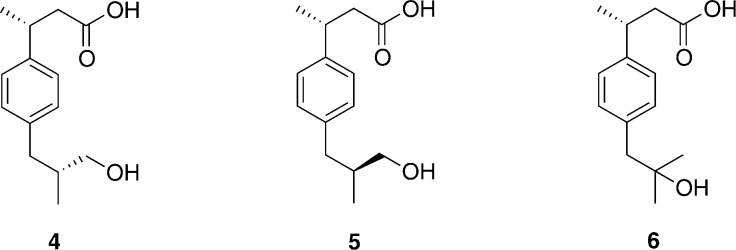
Ibuprofen (2) is a commonly used non-steroidal anti-inflammatory drug (NSAID) and acts as a nonselective inhibitor of cyclooxygenases 1, 2, and 3.12,13In vivo, 60% of R-ibuprofen undergoes conversion to S-ibuprofen.14−16 Ibuprofen is oxidized primarily by CYP2C9, with a small amount oxidized by CYP2C8.17,18 There are three metabolites of S-ibuprofen formed by CYP2C9: S,R- and S,S-3-hydroxyibuprofen are the major metabolites (4 and 5, Figure 2),17 and S-2-hydroxyibuprofen (6, Figure 2) is formed as a minor metabolite.
Figure 2.
Chemical structures of the metabolites formed during oxidation of S-ibuprofen by CYP2C9: major metabolites S,R-3-hydroxyibuprofen (4) and S,S-3-hydroxyibuprofen (5), and minor metabolite S-2-hydroxyibuprofen (6).
Diclofenac
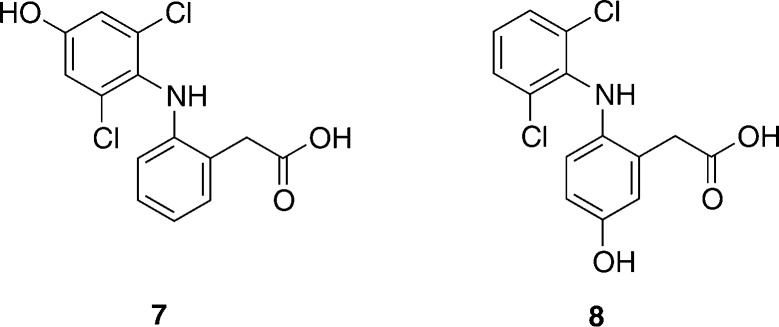
Diclofenac (1) is an NSAID widely used in the treatment of rheumatoid arthritis and post-operative pain. It contains two aromatic rings bearing different substituents (Figure 1). CYP2C18 and CYP2C19 can oxidize either of the two rings, giving rise to a mixture of C4′- and C5-hydroxylated diclofenac (7 and 8 in Figure 3, respectively).19 CYP2C9 and CYP3A4 exhibit very strict regioselectivities: CYP2C9 produces 4′-hydroxydiclofenac and 3′-hydroxydiclofenac,20 and CYP3A4 produces 5-hydroxydiclofenac exclusively.19 (Figure 3) These selectivity differences are observed despite a very similar electronic structure for the active oxidizing species (Cpd I) in these two enzymes.21
Figure 3.
Chemical structures of the metabolites formed during oxidation of diclofenac. 4′-Hydroxydiclofenac (7) is the major metabolite formed during oxidation by CYP2C9. 5-Hydroxydiclofenac (8) is the major metabolite formed during oxidation by CYP3A4.
Diclofenac oxidation has been studied using H2O2 and tBuOOH as oxidizing agents in the presence of an Fe-porphyrin catalyst.19 The authors concluded that C5 is the chemically preferred site of oxidation for diclofenac.
Warfarin
S-Warfarin (3) is a widely used anti-coagulant and undergoes hydroxylation by CYP2C9 at the 7- and 6-positions in a 3:1 ratio (Figure 4).22,23S-Warfarin also undergoes hydroxylation at the 4′ carbon, to a smaller extent, by CYPs 2C8, 2C18, and 2C19.23,24 The R-isoform of warfarin is predominantly metabolized by CYP3A4.23 Warfarin has an exceptionally low therapeutic index; i.e., the therapeutic amount required is very close to the amount that will cause internal hemorrhaging.25 Warfarin dosage is further complicated by drug–drug interactions, where the metabolic clearance of warfarin can be slowed down by the presence of other compounds.
Figure 4.
Chemical structure of S-7-hydroxywarfarin (9) and S-6-hydroxywarfarin (10), the major and minor metabolites formed during oxidation of S-warfarin by CYP2C9. These structures correspond to the open form of S-warfarin.
In solution, warfarin exists in an equilibrium between the open form (3 shown in Figure 1) and a diastereomeric pair of ring-closed hemiketals. The hemiketal form is favored in organic solvents; however, in aqueous solution and at physiological pH the open-side-chain form is preferred.26 In the crystal structure of CYP2C9 with S-warfarin bound, warfarin is in the open-side-chain form; hence, this is the form that is modeled in the present study.27
Computational Details
X-ray Crystal Structures
Three crystal structures of human CYP2C9 were available in the Protein Data Bank when this work was initiated. The 1OG2 and 1OG5 structures correspond to the apo form and a complex containing S-warfarin, respectively.27 Warfarin is bound at a considerable distance from the heme unit, with the hydroxylation site ∼10 Å from the heme iron. The authors used a docking technique to illustrate that it should be possible to bind two warfarin molecules simultaneously, with the putative second binding site located close to the heme group. This suggests that CYP2C9 might accommodate more than one substrate simultaneously. The 1OG2 and 1OG5 crystal structures do not provide any support for the existence of a previously suggested anionic binding site that would explain the preference of CYP2C9 toward negatively charged substrates.28−30 The side chains of Arg105 and Arg108, previously proposed to be involved in the binding of the anionic substrates, were found to be pointing away from the active site.
The 1R9O structure of CYP2C9 contains the drug flurbiprofen bound directly above the heme group in a position favoring oxidation.31 There are significant differences between the 1R9O and 1OG5 crystal structures, most notably the conformation of the Arg108 side chain, which points in toward the active site in 1R9O, and hydrogen-bonds to the carboxylic acid group of flurbiprofen.32 Indeed, mutation of Arg108 affects the binding of flurbiprofen and leads to decreased oxidation of S-warfarin and diclofenac.32,33
As the 1R9O crystal structure was obtained at a higher resolution, has a less altered protein sequence, and exhibits features corresponding to binding of substrates with anionic groups, such as ibuprofen and diclofenac, it was selected as the starting point for all of the MD simulations (and subsequent QM/MM calculations) presented in this study.
Structure Preparation for MD Simulations
All preparatory calculations were performed with the CHARMM program version c27b2, with the CHARMM22 forcefield.34 The 1R9O crystal structure was used,31 for the reasons described above. The Cpd I state of CYP2C9 was modeled, with the coordinates of the ferryl oxygen taken from a crystal structure of CYP101 (P450cam, PDB code 1DZ9).35S-ibuprofen and diclofenac were built using the molecular builder in Quanta 98. The coordinates of S-warfarin were taken from the 1OG5 crystal structure and hydrogen atoms were added. S-warfarin was docked into the active site of CYP2C9 using AUTODOCK 3.36 Deprotonated forms of S-ibuprofen and diclofenac were docked in the active site of the enzyme by hand, by superposition with flurbiprofen, before deleting the latter from the active site. Atomic charges for the CHARMM22 forcefield were obtained for all three substrates by fitting to electrostatic potential charges calculated using the B3LYP density functional37−40 and 6-31G(d) basis set41 in Jaguar 5.0.42 The raw charges resulting from the electrostatic potential fitting were edited in order to maintain a consistency with charges for related atoms in the CHARMM22 forcefield. The bonded parameters were chosen such as to be consistent with the CHARMM22 forcefield. The topology files and additional parameters for the substrates are provided in the Supporting Information.
Histidine tautomers were assigned using the optimal hydrogen-bonding network analysis method available in the WHATIF web interface.43 Hydrogen atoms were added using the HBUILD module of CHARMM, according to pKa values calculated using PROPKA.44 The protein was truncated to within 25 Å of the heme iron. Charged residues (Asp, Lys, Glu, and Arg) located more than 20 Å from the center of the system (i.e., the heme iron) were neutralized. The positions of the hydrogen atoms were energy minimized using 1000 steps of steepest descent (SD) and 500 steps of conjugate gradient (CG) minimization.
The protein was solvated in a box of pre-equilibrated TIP3P water molecules.45 Water molecules farther than 25 Å from the heme iron were deleted, together with all water molecules whose oxygen atom was 2.6 Å or closer to any heavy atom in the system. The positions of the water molecules were energy minimized using 1000 steps of SD, followed by 500 steps of CG, while keeping all other atoms fixed. Stochastic boundary molecular dynamics (SBMD) were performed on all water molecules (with all other atoms held frozen) with a buffer zone beyond a radius of 20 Å. The system was heated from 0 to 300 K over 1 ps and then equilibrated for 25 ps (with a time step of 1 fs). A friction coefficient of 62 ps–1 was applied to all water oxygen atoms.
All atoms were then optimized with 1500 steps of SD and 1500 steps of ABNR. In order to prevent distortion of Cpd I, the heme heavy atoms were fixed to their initial positions during all minimizations and MD simulations.46 The protein backbone heavy atoms were restrained to their initial positions with a force constant of 1.7 kcal mol–1 Å–2. The atoms in the buffer region (>20 Å from the Cpd I Fe atom) were harmonically restrained with force constants gradually increasing with distance from the center of the system. The optimized structure was used as the starting point for SBMD simulations detailed below.
Molecular Dynamics Simulations
Sampling is of great importance when modeling selectivity in enzymes.9,47,48 Methods such as QM/MM umbrella sampling simulations48−50 require many millions of energy and gradient evaluations and are hence only routinely feasible in QM/MM calculations using relatively low levels of QM theory, such as semiempirical methods. Such methods are not currently able to reliably model P450 oxidation reactions and hence are not suitable for modeling selectivity for these enzymes. Use of empirical valence bond methods51 would require significant parametrization of the reactant and product states for each drug that is modeled. Hence, in order to reduce the amount of parametrization, and to approximate to a sufficient amount of sampling, multiple QM/MM potential energy profiles have been calculated using different starting points from MM-based MD simulations (described below).
MD simulations were performed in CHARMM with stochastic boundary conditions. The same buffer region and harmonic restraints as detailed in the previous section were used in the SBMD simulations. Each system was equilibrated for 1 ns, prior to MD production runs of a minimum of 5 ns. The root-mean-squared deviation (RMSD) of the enzyme backbone heavy atoms from their positions in the crystal structure was used to determine the point in the simulation at which the enzyme was sufficiently equilibrated for structures to be selected for QM/MM calculations. Only once the value of the RMSD had begun to fluctuate around a constant value were structures considered for QM/MM calculations.
In order to obtain structures that were suitable for QM/MM reaction modeling, i.e., with the site of metabolism close enough to react with Cpd I, the addition of harmonic restraints between the substrate and Cpd I was necessary during selected MD simulations. For the generation of starting structures for QM/MM modeling of hydrogen abstraction from the C2 position of ibuprofen, a distance restraint of 2.7 Å (with a force constant of 100 kcal mol–1 Å–2) was applied between the Cpd I oxygen and the hydrogen atom attached to C2. A distance restraint was not necessary for the generation of starting structures for hydrogen abstraction from C3 of ibuprofen, nor for the hydroxylation of diclofenac at the C4′ or C5 positions. When modeling the hydroxylation of warfarin, preliminary QM/MM calculations revealed the necessity to constrain the position of warfarin (with respect to Cpd I), during the MD, to one which was similar to that observed for the transition state (TS) to C–O bond formation. In the absence of these restraints, the barriers were found to be unrealistically high, due to breakage of the Fe–S bond. In the MD simulations of warfarin in CYP2C9 an harmonic restraint with force constant of 2000 kcal mol–1 Å–2 was applied with an equilibrium distance of 2.0 Å between the C6 or C7 carbon atom of warfarin and the Cpd I oxygen, when modeling C6 or C7 hydroxylation, respectively.
Selection of Structures for QM/MM Calculations
Analysis of the MD simulations of ibuprofen and diclofenac revealed that many different orientations of the substrates were observed during the simulations. It has been found previously that calculating QM/MM profiles from MD structures in which the two reacting species are at large initial distances yields high activation energy barriers that are not representative of the true reactivity of the enzyme. Therefore, structures for QM/MM modeling were selected such that the orientation of the substrate in the active site was as close to the expected TS geometry as possible. MD structures were pre-screened on the basis of certain geometric criteria, relating to the proximity of the substrate to Cpd I, using a similar procedure to that used previously.9 Assuming that the “reactive” conformations make up a significant proportion of the MD simulation, it is reasonable to select such “reactive” conformations as the starting point for QM/MM calculations. As is discussed below, even when such selection is performed, a wide range of barriers is observed for a given reaction. A Boltzmann-weighted averaging procedure (as shown in eq 1) has been applied to calculate the average barrier, as this will favor the lower-energy barriers that will dominate the experimental reactivity. This approach has been applied previously for modeling the oxidation of alkenes in P450cam.9 The mathematical expression used for averaging does not take into account the different energies of the initial conformations for each pathway, as these are typically quite different, so that Boltzmann weighting would include a contribution only from the lowest energy initial conformation unless a very large number of pathways were studied. The fact that each conformation was visited in an MD simulation suggests they are all of reasonable free energy, and the conclusions were checked and found to be robust toward removing the lowest value of ΔEi⧧ from the averaging procedure.
| 1 |
The geometry criteria that were used to select starting structures for QM/MM modeling of ibuprofen and diclofenac (from the MD simulations described above) are summarized in Figure 5. Starting structures for modeling oxidation of ibuprofen were chosen such that the Fe–O–C(x) angle was in the range 110–130° and the Fe–H(x) distance was less than 3.5 Å, where H(x) is the hydrogen atom undergoing abstraction by Cpd I and C(x) is the carbon atom on the substrate to which this hydrogen is bonded. Starting structures for QM/MM modeling of diclofenac oxidation were selected such that the Fe–O–C(x) angle was in the range 110–130° and the Fe–C(x) distance was less than 4.0 Å, where C(x) is the substrate aromatic carbon that undergoes C–O bond formation with Cpd I (see below). No selection criteria were applied to the choice of starting structures for the modeling of warfarin oxidation, as the harmonic restraint present during the MD simulations (with the shorter O–C distance) yielded many structures close to the TS—these were selected at random for QM/MM calculations.
Figure 5.
Criteria used for selection of MD structures for QM/MM modeling of (a) aliphatic hydroxylation and (b) aromatic hydroxylation by CYP2C9.
QM/MM Calculations
QM/MM calculations were performed with the QoMMMa program,52 in which QM calculations were performed using Jaguar (version 5.5)42 with the B3LYP density functional.37−39 The MM part of the QM/MM calculations was performed in Tinker using the CHARMM27 all atom forcefield.34 The MM point charges were included in the QM Hamiltonian. The valences of the QM atoms at the QM/MM boundary were satisfied using the “link atom” method (i.e., the addition of hydrogen atoms).53 The charges of the MM atoms at the QM/MM boundary were set to zero to avoid unphysical interactions with the link atoms, and the residual charge was shifted onto the adjacent MM atoms. This QM/MM setup procedure has been used previously and has been shown to perform well for similar systems.9,21,46,54,55 An empirical dispersion correction was applied to the QM energy and gradient in all calculations.56 For geometry optimization the 6-31G(d) basis set41 was used for all atoms with the exception of Fe, for which the Los Alamos effective core potential was used (LACVP) (referred to herein as BSI).57 Single point energies were calculated using the LACV3P57 and 6-311++G(d,p) basis set combination (BSII).58−61
The QM region consisted of Cpd I, modeled as a truncated heme with all ring substituents replaced by hydrogen atoms, shown in Figure 6a, with the proximal cysteine represented by methyl mercaptide. For QM/MM calculations of ibuprofen and diclofenac, the entire substrate molecule was included in the QM region. The deprotonated form of diclofenac was used in QM/MM calculations, as this is the expected form at physiological pH. For QM/MM calculations of warfarin, the substrate molecule was split into QM and MM regions, as shown in Figure 6b.
Figure 6.
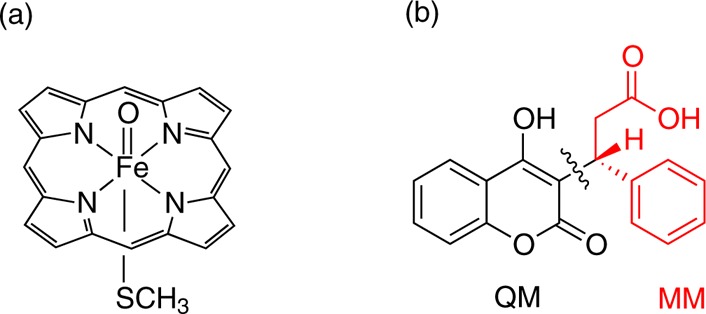
(a) QM representation of Cpd I used in QM and QM/MM calculations. (b) Separation of S-warfarin into QM and MM regions in QM/MM calculations.
All residues and water molecules with at least one atom located within 5 Å of any substrate or heme atoms were included in the minimization; all other atoms were held fixed. With the exception of the initial geometry optimizations of the enzyme–substrate complexes, an harmonic restraint with a force constant of 1000 kcal mol–1 Å –2 was applied to keep the reaction coordinate fixed to the appropriate value. Reaction profiles were generated by defining the reaction coordinate as the O–X distance, where O is the Cpd I oxygen and X is the hydrogen atom undergoing abstraction for ibuprofen oxidation, C4′ or C5 for diclofenac oxidation, and C6 or C7 for warfarin oxidation. The geometry was optimized with QM/MM at various points along the reaction coordinate, leading from reactant complex to intermediate, via the TS. In the case of warfarin oxidation, where the starting structures were close to the TS, the reaction was modeled in the forward and reverse directions to intermediate and reaction complex, respectively. The reaction coordinate was varied by steps of 0.2 Å with the exception of the region close to the TS, where steps of 0.1 Å were used. The potential energy barrier, ΔE⧧, was calculated as the difference in energy between the reactant complex and the highest point on the potential energy surface (i.e., the approximate TS). The Boltzmann-weighted average barrier for a given process was calculated for all available energy barriers using the expression in eq 1.
QM Calculations
QM calculations were performed using the ORCA program (version 2.8). The LANLDZ basis set62 was used for iron and 6-31G63,64 for all other atoms in all geometry optimization calculations (BSIII), together with Grimme’s empirical dispersion correction.56 Single-point energies were calculated using the SDD basis set65 for Fe and the valence triple-ζ basis set developed by Ahlrichs et al. with added d,p polarization functions for all other atoms (BSIV).66 The starting geometries for these gas-phase calculations were taken from the QM/MM geometries which produced the lowest potential energy barriers to hydroxylation. In the QM calculations of diclofenac, diclofenac was protonated at the carboxylate group, in order to prevent deprotonation of the N–H group by the carboxylate.
Results and Discussion
Aliphatic Hydroxylation
Aliphatic hydroxylation by P450s occurs via the hydrogen abstraction/rebound mechanism (Figure 7).67 The hydrogen abstraction step has been found to be rate-limiting68−73 and hence is the only step modeled here. Cpd I has two closely lying electronic states, a doublet and a quartet, both of which are believed to contribute to its reactivity, and hence both states are considered here. In model studies of hydrogen abstraction from methane, similar barriers were calculated for the doublet and quartet states.68 A small barrier to the rebound step was found for the quartet state of Cpd I, but no barrier was observed for the same step on the doublet surface.
Figure 7.

Rebound mechanism for aliphatic hydroxylation catalyzed by P450s. The first step is hydrogen abstraction, resulting in the formation of a substrate radical which then rebounds with the Fe-bound OH group to form the hydroxylated product.
Ibuprofen
Six MD simulations of the ibuprofen/CYP2C9 complex were performed in order to relax the crystal structure of CYP2C9 and to generate energetically accessible starting structures for the QM/MM energy profiles. Three simulations were performed for oxidation at C2 and three simulations for oxidation at C3. Each subset of simulations was propagated from the same initial geometry, only the set of initial velocities assigned to the atoms was varied. In the latter set of simulations, no restraints were included between the substrate and Cpd I and the isopropyl group of the ibuprofen molecule sampled many different conformations within the active site. The remainder of the ibuprofen molecule sampled fewer conformations in these simulations due to the presence of a hydrogen bond between the carboxylate group of ibuprofen and the Arg108 side chain. In the simulations that were performed to generate structures for C2 hydroxylation, the addition of an harmonic restraint was necessary in order to generate a sufficient number of “reactive” starting structures for QM/MM.
It has been postulated previously that the presence of a water molecule close to the Cpd I oxygen may lead to a lowering of the barrier to hydrogen abstraction in P450cam.74 However, we did not observe any water molecules close to the Cpd I oxygen during any of the MD simulations, for ibuprofen or the other substrates. Given the relative size of the substrates, there is little room in the active site for entrance of solvent during the simulations. We have reported previously that the displacement of water from the active site by the substrate results in a more reactive Cpd I.21
The isopropyl group of ibuprofen was positioned with all carbon atoms positioned at a distance of >5.0 Å from the Cpd I ferryl oxygen for the majority of one of the C3 MD simulations, and hence this simulation was not used to extract starting structures for QM/MM calculations. One of the simulations contained many more structures in which ibuprofen was in a “reactive” conformation, and hence this simulation was used to obtain QM/MM starting structures. In all three of the C3 MD simulations, the backbone RMSD continued to increase until after approximately 4 ns of simulation, hence all starting structures for QM/MM were obtained from after this point in the simulation, when we assume that the system has reached equilibrium. All three of the C2 MD simulations yielded many “reactive” conformations for hydroxylation by Cpd I at the C2 position, and hence all three of the C2 MD simulations were used for the generation of QM/MM starting structures.
Example QM/MM-optimized geometries of reactant complexes for the hydrogen abstraction from C2 and C3 of ibuprofen in CYP2C9 are shown in Figure 8. The reactant complexes leading to the lowest energy barriers (see Table 1) were selected as examples. In the reactant complex for hydrogen abstraction from C3, there is a hydrogen bond between the substrate and the Arg108 side chain. This interaction is not present in the reactant complex for hydrogen abstraction at C2. The O–H distance is smaller in the reactant complex for hydrogen abstraction from C3, compared to C2 (2.253 and 3.017 Å, respectively). The Fe–O–C(3) angle in the C3 hydrogen abstraction reactant complex structure is significantly smaller than the Fe–O–C(2) angle in the C2 hydrogen abstraction reactant complex (122.8° and 138.9°, respectively).
Figure 8.
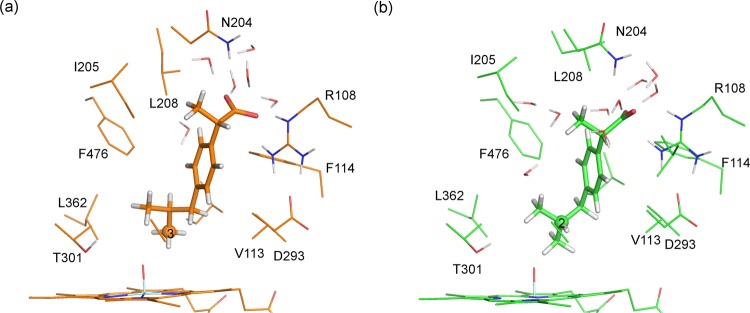
Reactant complex structures for hydrogen abstraction from (a) C3 and (b) C2 of S-ibuprofen, calculated at the B3LYP(BSI)/CHARMM27 level of theory (corresponding to doublet profiles 2-3 and 3-1 in Table 1).
Table 1. Potential Energy Barriers, ΔE⧧ [in kcal/mol], for Hydrogen Abstraction from Ibuprofen at the C2- and C3-Positions, Calculated at the B3LYP-D(BSII)//B3LYP-D(BSI)/CHARMM27 Level of Theorya.
| C3 |
C2 |
||||
|---|---|---|---|---|---|
| profile | 2ΔE⧧ | 4ΔE⧧ | profile | 2ΔE⧧ | 4ΔE⧧ |
| 3-1 | 18.2 | 18.1 | 2-1 | 26.4 | 28.1 |
| 3-2 | 19.8 | 18.6 | 2-2 | 31.4 | 32.5 |
| 3-3 | 22.5 | 21.4 | 2-3 | 26.2 | 29.7 |
| 3-4 | 20.2 | 19.7 | |||
| 3-5 | 20.9 | 20.0 | |||
| 3-6 | 24.6 | 22.4 | |||
| 3-AveB | 19.2 | 18.9 | 2-AveB | 26.5 | 28.7 |
AveB corresponds to the Boltzmann-weighted average calculated over all pathways. The superscript 2 and 4 labels correspond to the doublet and quartet spin states of Cpd I.
QM and QM/MM barriers have been calculated for hydrogen abstraction from both the C2 and C3 atoms of S-ibuprofen. Six QM/MM energy profiles were calculated for abstraction from each carbon atom. The QM/MM energy barriers for hydrogen abstraction from ibuprofen are displayed in Table 1. Out of the six attempts to model abstraction from C2, only three resulted in profiles that successfully went from reactants to intermediate, via a TS. For the remaining three profiles, it was not possible to achieve a converged structure corresponding to the TS. All six of the C3 profiles resulted in converged energy profiles.
The QM/MM barriers reported here are similar in magnitude for the doublet and quartet spin states of Cpd I; this finding is consistent with other QM/MM studies,6 as well as small QM-only model studies of the reactivity of Cpd I (e.g., methane oxidation68 and alkene oxidation75). The QM/MM barriers for C3 and C2 hydroxylation span the ranges 18.1–24.6 and 26.2–32.5 kcal/mol, respectively. It is not unusual to observe such a range in activation barriers for the same reaction calculated from different MD structures, and is due to the relative reactivities of different conformations.9 It is expected that the pathways with lower barriers are more representative of the reaction taking place in the enzyme, if one assumes that all of the reaction complexes are thermally accessible. The lowest barriers are observed for C3 hydroxylation, and this reflects the experimental preference for the formation of 3-hydroxyibuprofen versus 2-hydroxyibuprofen. The barriers to hydrogen abstraction from C2 are higher than expected, as one would not expect formation of 2-hydroxyibuprofen on the basis of the large difference between the lowest C3 and C2 barriers (∼7 kcal/mol). As 2-hydroxyibuprofen is a minor product of metabolism in CYP2C9, the large barriers suggest that our model system somehow disfavors the minor pathway to a larger extent than is observed experimentally.17 This may be due to incomplete sampling; it is possible that there is a conformation that favors C2 hydroxylation which was not accessed during the MD simulations described here.
Preliminary QM/MM barriers calculated at the same level of theory in the absence of the dispersion correction were found to be substantially higher (∼10 kcal/mol) than their counterparts where dispersion was included. Hence it is apparent that inclusion of dispersion is important in these calculations.
The QM barriers for hydrogen abstraction from C2 and C3 computed in vacuum are displayed in Table 2. The QM barriers predict the opposite selectivity to that predicted by the QM/MM calculations. The barriers to C2 hydroxylation are 16.3 and 14.8 kcal/mol for the doublet and quartet states of Cpd I, respectively. The barriers to C3 hydroxylation are 22.5 and 25.1 kcal/mol, hence C2 hydroxylation is favored by 7.7 kcal/mol in the gas phase. The barrier to C2 hydrogen abstraction is expected to be lower, reflecting that it requires less energy to abstract a hydrogen atom from a tertiary carbon atom, compared to a primary carbon. The QM barriers for C2 hydrogen abstraction are lower than those calculated in the enzyme, whereas the C3 barriers are higher than their QM/MM counterparts. As is discussed below, the C2 gas-phase TS geometry is very different to that optimized with QM/MM. Hence it is likely that the high energy barriers observed for C2 hydroxylation in CYP2C9 are due to the prevention of formation of a low-energy TS geometry by the steric effects of the enzyme active site.
Table 2. Gas-phase B3LYP-D(BSIV)//B3LYP-D(BSIII) Energies [in kcal/mol] for the Hydroxylation of S-Ibuprofen at the 2- and 3-Positionsa.
| site of oxidation | 2ERC | 4ERC | 2ETS | 4ETS | 2ΔE⧧ | 4ΔE⧧ |
|---|---|---|---|---|---|---|
| 2 | –14.6 | –14.6 | 1.6 | 0.2 | 16.3 | 14.8 |
| 3 | –13.8 | –13.8 | 8.8 | 11.3 | 22.5 | 25.1 |
ERC and ETS correspond to the energies of the reactant complex and transition state, respectively, calculated relative to separate reactants. ΔE⧧ is the potential energy barrier, calculated as the difference between ERC and ETS. The superscript 2 and 4 labels correspond to the doublet and quartet spin states of Cpd I, respectively.
The experimental rate constant for 3-hydroxylation of S-ibuprofen in CYP2C9, determined at 310 K, is 0.056 s–1.76 According to the Eyring equation, this corresponds to a free energy barrier of 20.0 kcal/mol. The experimental reaction barrier should be treated as the upper bound, as the rate limiting step in the catalysis of CYP2C9 has not been established. The reaction barriers calculated in this work are not free energy barriers, as entropy contributions are not calculated. However, previous work suggests that entropy contributions for similar reactions are small (<2 kcal/mol),48,77,78 and that predictions of reactivity, in good agreement with experiment, can be made on the basis of reaction enthalpies.79,80 The lowest value calculated for hydrogen abstraction from C3 with QM/MM (18.2 kcal/mol) is below the upper limit suggested by the activation free energy derived from the experimental rate constant. A zero point vibrational energy correction of ∼4 kcal/mol has been calculated for hydrogen abstraction from other P450 substrates using similar methods.9 This would bring the QM/MM calculated energy barrier to around 14 kcal/mol. C–H bond activation kinetics have been measured in the CYP-119 isoform with the substrate lauric acid.81 In this study, an apparent rate constant of 1.1 × 10⁷ s–1 was observed at 277 K. This corresponds to an energy barrier of ∼12 kcal/mol. Hence a barrier of 14 kcal/mol is likely to be representative of the true energy barrier to hydrogen abstraction from the C3 of ibuprofen.
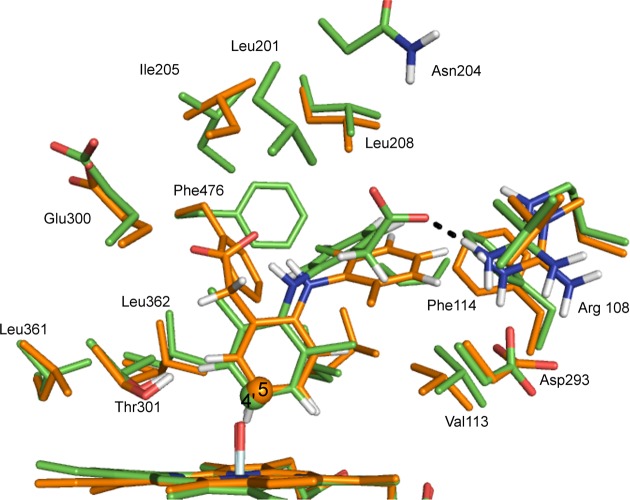
The TS structures for the hydrogen abstraction profiles 3-1 and 2-3 are shown in Figure 9. These profiles correspond to the lowest energy barriers for each reaction. There is a hydrogen-bonding interaction between one of the carboxylate oxygen atoms of ibuprofen and Arg108 in both TS structures. Arg108 has been identified as playing an important role in binding anionic substrates in CYP2C9.32 In the TS for hydroxylation at C3, the carboxylate oxygen of ibuprofen and the side chain N–H group of Arg108 are in an orientation that would result in a stronger hydrogen-bonding interaction than that between the corresponding atoms for C2 hydroxylation. This is because the carboxylate group in the latter reaction is dragged further into the active site (i.e., closer to Cpd I) in order for the Cpd I oxygen to abstract the hydrogen from C2, as illustrated in Figure 9.
Figure 9.
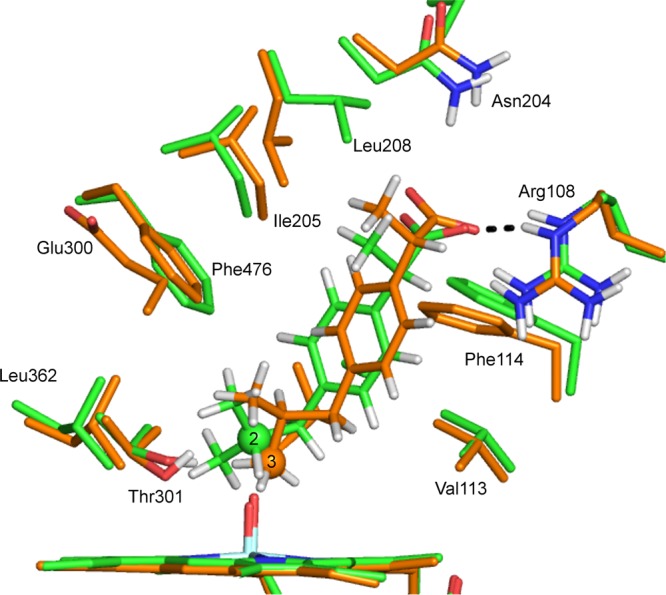
Transition-state structures for hydrogen abstraction from C3 and C2 of S-ibuprofen, calculated at the B3LYP-D(BSI)/CHARMM27 level of theory (corresponding to doublet profiles 2-3 and 3-1 in Table 1). The carbon atoms corresponding to C2 and C3 hydroxylation are in green and orange, respectively.
The TS structures for hydrogen abstraction from ibuprofen calculated in vacuo are shown in Figure 10. The orientations of ibuprofen relative to the heme in the gas-phase calculations are very different to those observed in the QM/MM structures (Figure 9). This observation is unsurprising given that in the QM/MM calculations, the orientation of ibuprofen is restricted by the residues surrounding the active site. In the gas phase, ibuprofen is less sterically hindered and can adopt an orientation in which the dispersion interaction between ibuprofen and the heme is maximized, as has been observed previously for other substrates.75 Indeed, in previous work we observed that the effect of dispersion on optimized geometries is smaller in QM/MM than in QM calculations on P450 oxidation.82
Figure 10.
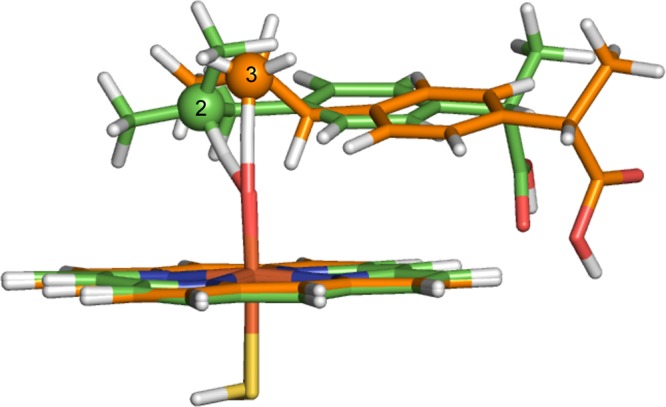
Transition-state structures for hydrogen abstraction from C3 and C2 of S-ibuprofen, calculated in vacuo at the B3LYP-D/BSIII level of theory. The carbon atoms corresponding to C2 and C3 hydroxylation are in green and orange, respectively.
There is a large difference in barrier between oxidation at C2, compared with C3 in vacuo (7 kcal/mol). This is due (in part) to the relative ease of removal of a hydrogen atom from a tertiary carbon atom, compared to that of a primary carbon atom. In addition to this, the angle formed between the two reactants at the TS results in better orbital overlap in the case of C2, compared with C3, as shown in Figure 11. The shape of the Fe–O π* is such that the most favorable angle of approach for the substrate is around 130° (in the case of ibuprofen, the Fe–O–C(x) angle). It is possible that the dispersion interactions between the heme and ibuprofen moieties do not allow for the C3 hydrogen atoms to form a TS in which optimal overlap can occur between the two reactants. In the enzyme, the amino acid residues surrounding the active site can anchor the substrate in a position such that a more favorable angle of approach is formed between the heme and ibuprofen, and hence a lower barrier to hydrogen abstraction is observed.
Figure 11.

(a) Effect of angle of approach of substrate (Sub) to Cpd I on barrier to aliphatic and aromatic hydroxylation. Optimal orbital overlap leads to low barrier when angle of approach is approximately 130° (green). At larger angles of approach, non-optimal orbital overlap occurs, leading to higher barriers (red). (b) Orbital energy diagram for the first electron transfer step in the oxidation of substrate by Cpd I. The electron may transfer to either of the two singly occupied Fe–O π* orbitals.
From the calculations described above, it is clear that in the case of oxidation of S-ibuprofen by CYP2C9, the effect of the enzyme environment is to determine the regioselectivity of oxidation, by restricting the orientation of the substrate relative to Cpd I, placing the C3 group at an optimal position and angle for hydroxylation to occur. The angle dependence of regioselectivity may play an important role in the automated prediction of P450 metabolites. The sensitivity of barrier to angle of attack may explain the necessity for careful structure selection in QM/MM calculations on P450s.
Aromatic Hydroxylation
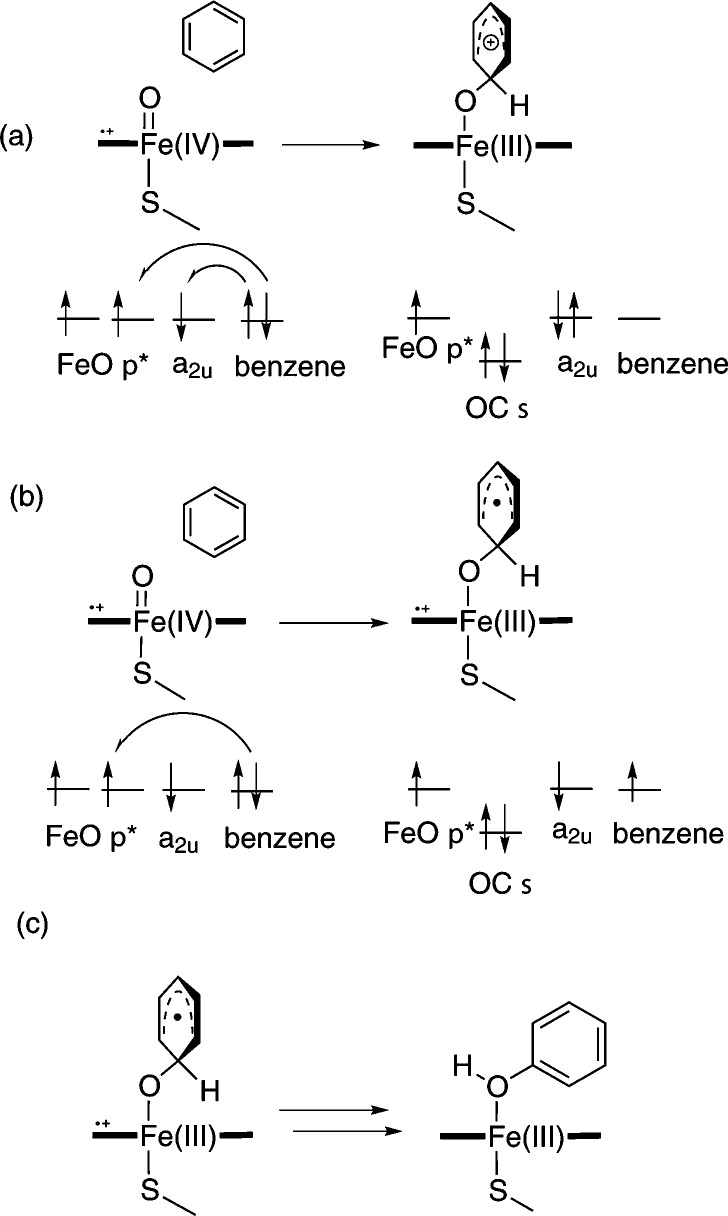
P450-catalyzed aromatic hydroxylation is believed to occur via the addition/rearrangement mechanism (Figure 12), whereby hydroxylation proceeds via a tetrahedral σ-complex, which is formed upon addition of Cpd I to the aromatic substrate carbon atom. The addition/rearrangement mechanism is supported by observed isotope effects for the hydroxylation of deuterated chlorobenzenes, which are inconsistent with the previously suggested initial epoxide formation mechanism.83 The addition of Cpd I to benzene and analogues has been studied in the gas phase,5,84 as well as with QM/MM methods.55,82 The tetrahedral σ-complex can have both radical- or cation-like character, depending on the extent of electron transfer from the aromatic substrate to the single-occupied orbitals of Cpd I.5
Figure 12.
Addition/rearrangement mechanism for aromatic hydroxylation catalyzed by P450s.5,83 The orbital energy levels are indicated schematically. The first step is C–O bond formation, resulting in the formation of a σ-adduct with either (a) cationic or (b) radical character. (c) The second step is rearrangement to form the hydroxylated product.
The effect of the orientation of the substrate with respect to Cpd I to the barrier to C–O bond formation has also been investigated.5,55,82 The side-on (perpendicular) and face-on (parallel) orientations of benzene with respect to the Cpd I porphyrin were calculated both in the gas phase5 and with QM/MM.55,82 In the former case, a slight preference for side-on addition was observed,5 whereas in the latter calculations, no distinct preference could be determined.55,82
The tetrahedral intermediate can rearrange to form a phenol product directly, or via ketone or epoxide intermediates. The calculated barriers to these competing processes for benzene were similar, indicating that a mixture of these species is likely to be observed.55
Two drugs have been studied here that are known to undergo aromatic hydroxylation in CYP2C9: S-warfarin and diclofenac. Both of these drugs contain several possible sites at which aromatic hydroxylation can occur; QM/MM calculations have been used here to investigate if the preferred site of metabolism can be rationalized on the basis of the relative barriers to C–O formation with Cpd I at each site.
Warfarin
The mechanism for the hydroxylation of R- and S-warfarin has been studied experimentally by Bush et al. using deuterium-labeled substrates.85 The relative amounts of deuterated products formed (and absence of an observed kinetic isotope effect) suggested that hydroxylation proceeds through an addition-rearrangement mechanism, prior to, or in the absence of, epoxide formation. This reactivity is believed to be dictated by the nature of Cpd I, whereas the regioselectivity of hydroxylation is believed to be dependent on the binding position of the substrate, which will be determined by the residues surrounding the active site. The majority of S-warfarin that is metabolized by CYP2C9 is converted to the 7-hydroxy product, with a small amount of 6-hydroxywarfarin formed.23
As mentioned above, MD simulations of S-warfarin and CYP2C9 were performed with an harmonic restraint between the substrate carbon undergoing C–O bond formation (C6 or C7) and the Cpd I oxygen. To keep the substrate close to Cpd I, in an orientation close to that expected for the TS, a large force constant value (2000 kcal mol–1 Å –2) was used. As a result, there was relatively little movement of the substrate in the active site, compared with the other substrates studied here. This is despite the fact that the protein and solvent were free to sample different conformations. QM/MM reaction profiles were calculated from selected MD structures, by increasing the C–O distance to locate the reactant complex, and decreasing the same distance to locate the TS and intermediate.
There were several differences between the MD simulations that were performed for C6 and C7 hydroxylation. In the C6 MD simulation, a hydrogen bond was observed between the carboxylate group of Glu300 and the hydroxyl group located on the benzolactone ring of warfarin, for the entire simulation. In the C7 simulation this hydrogen bond was not present, and instead a bridging water molecule was located between the two groups. Additionally, in the C6 simulation, a hydrogen bond was observed between the Arg108 side chain and the carbonyl oxygen of the benzolactone ring of warfarin (O2 in Figure 1). In the C7 simulation, the average distance between the groups is larger than in the C6 simulation (average values of the Arg108 HH22–warfarin O2 distance 2.30 and 3.29 Å for the C6 and C7 simulations, respectively). Mutagenesis studies of CYP2C9 with S-warfarin revealed a loss of formation of 7-hydroxywarfarin for R108F and R108E mutations.32,86 The third hydrogen-bonding interaction between the enzyme and substrate that differs between the two simulations is that between the aliphatic ketone oxygen of warfarin (O4 in Figure 1) and the carboxamide NH2 group of Asn204. The average distance between the closest amide proton of Asn204 and the O4 of warfarin is 3.03 and 2.40 Å in the C6 and C7 MD simulations, respectively. Asn204 formed a hydrogen bond to the acid group of flurbiprofen in the 1R9O crystal structure (the starting point for the calculations in this work).31
Example QM/MM-optimized reactant complexes for C–O bond formation between Cpd I and C6 and C7 of S-warfarin in CYP2C9 are shown in Figure 13. In the binding poses for addition to C6 and C7 displayed in Figure 13, the same interactions were observed between warfarin and the active-site residues as described for the MD simulation described above.
Figure 13.
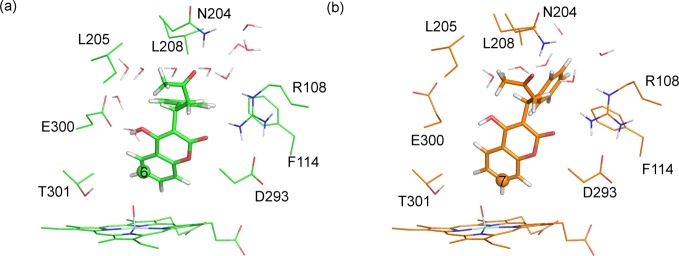
Reactant complex structures for hydrogen abstraction from (a) C6 and (b) C7 of S-warfarin, calculated at the B3LYP-D(BSI)/CHARMM27 level of theory (corresponding to doublet profiles 6-8 and 7-9 in Table 3).
The barriers to C–O formation between S-warfarin and Cpd I, calculated at the B3LYP-D/CHARMM27 level, are provided in Table 3. The barriers to addition at C6 and C7 span the ranges 21.4–27.8 and 13.6–23.0 kcal/mol, respectively. As mentioned above, it is expected that a wide range of values will be observed for activation barriers when sampling different enzyme conformations. The barriers for a given pathway are similar, whether the doublet or quartet spin state of Cpd I is considered. In previous work, barriers to C–O bond formation with the doublet state of Cpd I were found to be slightly lower than the corresponding quartet state;5 this is not the case for C–O bond formation between Cpd I and S-warfarin.
Table 3. Potential Energy Barriers, ΔE⧧ [in kcal/mol], from B3LYP-D(BSII)//B3LYP-D(BSI)/CHARMM27 Profiles (and Corresponding Boltzmann-Weighted Average, AveB) for Hydroxylation of S-Warfarin at the 6- and 7-Positionsa.
| C6 |
C7 |
||||
|---|---|---|---|---|---|
| profile | 2ΔE⧧ | 4ΔE⧧ | profile | 2ΔE⧧ | 4ΔE⧧ |
| 6-1 | 22.6 | 22.6 | 7-1 | 19.9 | 18.9 |
| 6-2 | 24.6 | 24.0 | 7-2 | 17.2 | 16.2 |
| 6-3 | 23.2 | 22.5 | 7-3 | 16.7 | 14.4 |
| 6-4 | 22.9 | 23.2 | 7-4 | 23.0 | 22.1 |
| 6-5 | 27.8 | 26.3 | 7-5 | 20.6 | 18.4 |
| 6-6 | 23.8 | 23.4 | 7-6 | 16.0 | 14.6 |
| 6-7 | 23.3 | 23.4 | 7-7 | 16.3 | 15.2 |
| 6-8 | 21.4 | 21.8 | 7-8 | 15.6 | 14.6 |
| 6-9 | 22.8 | 22.6 | 7-9 | 14.2 | 13.6 |
| 6-10 | 24.7 | 24.4 | 7-10 | 16.0 | 14.6 |
| AveB | 22.4 | 22.7 | AveB | 15.1 | 14.3 |
The superscript 2 and 4 labels correspond to the doublet and quartet spin states of Cpd I.
There is a clear preference for addition to the C7 carbon atom in the present QM/MM calculations, in agreement with the observed formation of 7-hydroxywarfarin as the major product in CYP2C9 assays.23 The experimental Vmax for hydroxylation of S-warfarin in CYP2C9, determined at 310 K is 133.3 pmol min–1 nmol–1,87 which corresponds to a free energy barrier of approximately 16 kcal/mol. As discussed for ibuprofen above, this value is an upper bound, as it represents the overall rate of turnover for the enzyme, and it is not known whether this is the overall rate-limiting step. The Boltzmann-weighted average value for the activation enthalpy of 14.3 kcal/mol, calculated at the B3LYP-D/CHARMM27 level is in good agreement with the experimental value, assuming that the contribution of entropy to the free energy barrier is small.
The barriers for addition of Cpd I to the truncated model of S-warfarin in the gas phase, are shown in Table 4. The barriers to C6 and C7 hydroxylation are 12.8 and 13.3 kcal/mol, respectively, and are lower than the values calculated with QM/MM. The gas-phase barriers for the doublet state of Cpd I are lower than those calculated for the quartet and predict a slight preference for hydroxylation at C6. Assuming that the relative barriers to C–O addition at C6 and C7 will determine the ratio of S-6- and S-7-hydroxywarfarin, these barriers are not consistent with the 3:1 experimental preference for the formation of S-7- over S-6-hydroxywarfarin.23
Table 4. Gas-Phase B3LYP-D(BSIV)//B3LYP-D(BSIII) Energies [in kcal/mol] for Hydroxylation of S-Warfarin at the 6- and 7-Positionsa.
| site of oxidation | 2ERC | 4ERC | 2ETS | 4ETS | 2ΔE⧧ | 4ΔE⧧ |
|---|---|---|---|---|---|---|
| 6 | –12.9 | –13.0 | –0.1 | 1.7 | 12.8 | 14.7 |
| 7 | –12.9 | –13.0 | 0.4 | 3.0 | 13.3 | 16.0 |
ERC and ETS correspond to the energies of the reactant complex and transition state, respectively, calculated relative to separate reactants. ΔE⧧ is the potential energy barrier, calculated as the difference between ERC and ETS. The superscript 2 and 4 labels correspond to the doublet and quartet spin states of Cpd I.
The QM/MM barriers correctly display a preference for C–O bond formation at C7, in contrast to the gas-phase barriers. This suggests that the enzyme plays an important role in governing the selectivity of oxidation for S-warfarin in CYP2C9; despite C6 being slightly more reactive toward Cpd I than C7. It is C7 that undergoes C–O bond formation, due to the active-site residues positioning warfarin in a favorable geometry for reaction at C7.
The relatively small experimental preference for S-7- over S-6-hydroxywarfarin (3:1)23 is at first sight not consistent with our QM/MM calculations. The large difference in C–O addition barriers in our calculations would suggest exclusive formation of the S-7 hydroxylation product. It is possible that the QM/MM calculated barriers do not reproduce the differences in energy barrier accurately. However, the apparent discrepancy may also be due to the fact that our calculations only address the first step in the reaction mechanism, formation of a tetrahedral adduct of the Cpd I oxygen to one or the other of the two carbon atoms. In many cases, such adducts will lead to formation of the final hydroxylated product with the same regiochemistry as that of the initial addition. However, the mechanism of the subsequent steps does allow for migration of oxygen from one carbon to another. Previous work5,55,88 shows that the tetrahedral adducts can react further in one of three ways, each of which has a low energy barrier: (i) proton shuffling, with transfer of a proton from the O-bonded carbon to the porphyrin ring; (ii) hydride migration from the O-bonded carbon to a neighboring carbon; (iii) ring closure by formation of a second C–O bond between the oxygen and a neighboring carbon to yield an epoxide (or arene oxide), that can undergo subsequent (presumably non-enzymatic) ring-opening. Pathways (i) and (ii) lead, after further steps, to formation of a product with a C–O bond in the same position as in the adduct. However, depending on the regiochemistry of epoxide ring-opening, the hydroxylated product from pathway (iii) can have a C–O bond either at the position of addition or at the neighboring position. The regiochemistry of ring-opening of arene oxides in the presence of weak acid is known to be influenced by resonance stabilization of an initially formed carbocation.89 In the present case, the lactone oxygen substituent should favor opening of a 6,7-arene oxide to yield the S-6 hydroxylation product. Hence the observation of ca. 20% of the S-6 hydroxylation product could be due to initial exclusive addition of Cpd I to C-7—consistent with our calculations. This would need to be followed by dominant rearrangement of the adduct through mechanisms (i) or (ii), forming the major observed S-7 hydroxylation product, but partial occurrence of mechanism (iii) leading to arene oxide. This would then open regioselectively to the S-6 product. This interpretation is consistent with the amount of deuterium retention obtained during studies of the cytochrome P450-catalyzed hydroxylation of selectively deuterated forms of S-warfarin.90
The QM/MM transition states corresponding to the lowest energy pathways for C6 and C7 hydroxylation of S-warfarin are displayed in Figure 14. One notable difference between the TSs to C6 and C7 hydroxylation is between the Fe–O–C(x) angle. In the C7 TSs, this angle varies between 126 and 130°, whereas this angle is significantly larger in the C6 TSs (between 140 and 143°). This is in agreement with the relationship between angle of attack and barrier to oxidation observed for ibuprofen, summarized in Figure 11.
Figure 14.
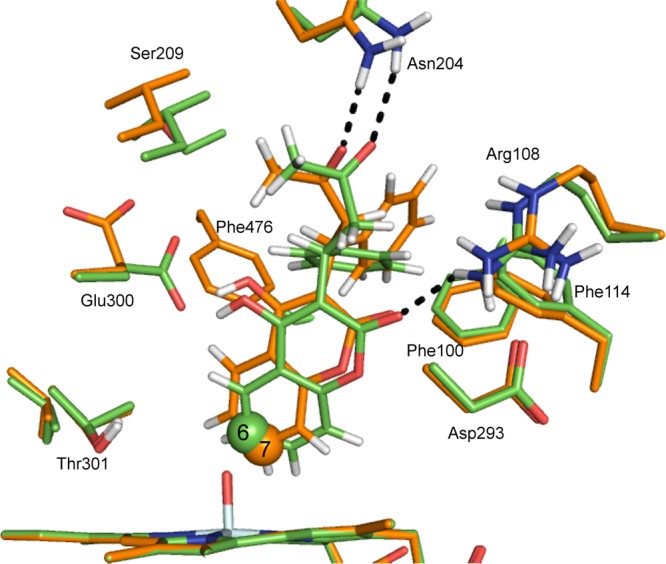
Transition-state structures for C–O bond formation between C6 and C7 of S-warfarin and the Cpd I ferryl oxygen of CYP2C9, calculated at the B3LYP-D(BSI)/CHARMM27 level of theory (corresponding to doublet profiles 6-8 and 7-9 in Table 3). The carbon atoms corresponding to C6 and C7 hydroxylation are displayed in green and orange, respectively.
The gas-phase TS geometries for C–O bond formation to C6 and C7 of the truncated QM model S-warfarin are superimposed in Figure 15. The geometries are very similar with respect to angle of approach of the substrate carbon atom to Cpd I, which is expected given that the barriers are very similar (12.8 and 13.3 kcal/mol for C6 and C7 hydroxylation, respectively). Given the similarity of the C6 and C7 barriers, one might expect equal formation of 6- and 7-hydroxywarfarin (or even a slight preference for 6-hydroxywarfarin). This is not the experimental observation, however; clearly the enzyme controls the selectivity by orientating the substrate in such a position that hydroxylation at C7 is more facile.
Figure 15.
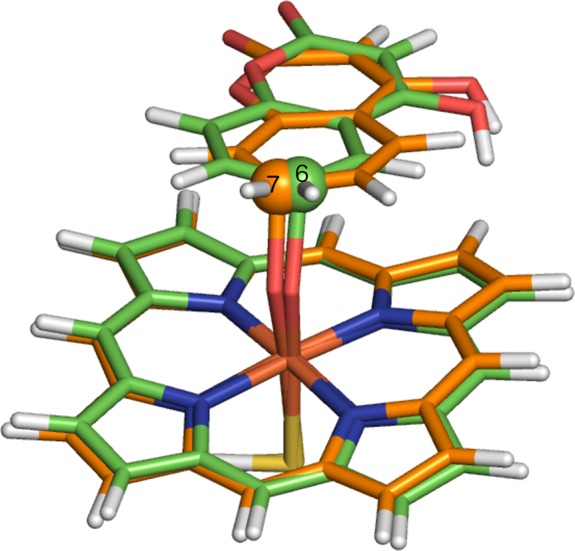
Transition-state structures for hydrogen abstraction from C6 and C7 of a truncated model of S-warfarin, calculated in vacuo at the B3LYP-D/BSIII level of theory. The carbon atoms corresponding to C6 and C7 hydroxylation are in purple and yellow, respectively.
The difference in the orientation of the substrate relative to the heme, between the gas-phase and QM/MM TS geometries, is similar to that observed for S-ibuprofen. In the gas-phase calculations the ring structure of warfarin lies parallel to the heme, whereas in the QM/MM calculations the ring is closer to a perpendicular orientation. This difference is clearly a result of the amino acid residues surrounding the active site in the latter case.
Diclofenac
As mentioned in the Introduction, the metabolism of diclofenac by CYP2C9 predominantly leads to formation of 4′-hydroxydiclofenac. The formation of the 5-hydroxy product in CYP2C9 was observed when the acid group was removed from diclofenac.19 Oxidation by CYP3A4 leads to exclusive formation of 5-hydroxydiclofenac, and the 5-position has been shown to be the chemically more reactive site using Cpd I mimetic species.19
The MD simulation performed prior to oxidation at C4′ in diclofenac generated many structural snapshots where the distance between the C4′ and the Cpd I oxygen (C4′–OCpdI) was less than 3.0 Å, i.e., close enough for reaction to occur (the average value of this distance over the entire MD trajectory was 3.4 Å). A hydrogen bond was observed between the Arg108 side chain and the acid group of diclofenac for the majority of this simulation. During the parts of the simulation in which this interaction was missing, no noticeable effect was observed on the C4′–OCpdI distance. In the MD simulations used to generate structures for C5 oxidation, no hydrogen-bonding interaction was observed between Arg108 and the diclofenac acid group; instead the acid group forms hydrogen bonds to two water molecules for the entire simulation.
Example QM/MM optimized reactant complex structures for the addition of Cpd I to C4′ and C5 of diclofenac are displayed in Figure 16. As in the MD simulations, a hydrogen bond is observed between the carboxylate of diclofenac and the Arg108 side chain in the reactant complex to addition at C4′. In the reactant complex for addition to C5, the carboxylate of diclofenac does not form any hydrogen bonds to the protein; however, it does form hydrogen bonds to three surrounding water molecules. Additionally, in the C5 addition reactant complex, an intramolecular hydrogen bond is formed between the carboxylate and N–H groups of diclofenac.
Figure 16.
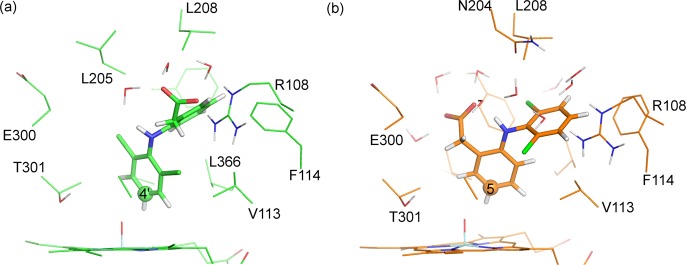
Reactant complex structures for hydrogen abstraction from (a) C4′ and (b) C5 of diclofenac, calculated at the B3LYP-D(BSI)/CHARMM27 level of theory (corresponding to doublet profiles 4′-2 and 5-3 in Table 5).
The barriers to C4′- and C5-hydroxylation in diclofenac are provided in Table 5. The barriers for addition of Cpd I to C4′, calculated with B3LYP-D/CHARMM27, span the range 17.4–27.2 kcal/mol. The corresponding barriers for addition to C5 span the range 11.9–18.7 kcal/mol. Similar barriers were observed for the doublet and quartet spin states of Cpd I, and because previous studies have shown a tendency for lower barriers for the doublet state, not all of the pathways were calculated for both spin states.
Table 5. Potential Energy Barriers, ΔE⧧ [in kcal/mol], from B3LYP-D(BSII)//B3LYP-D(BSI)/CHARMM27 Profiles for Hydroxylation of Diclofenac at the 4′- and 5-Positionsa.
| C4′ |
C5 |
||||
|---|---|---|---|---|---|
| profile | 2ΔE⧧ | 4ΔE⧧ | profile | 2ΔE⧧ | 4ΔE⧧ |
| 4′-1 | 18.8 | 19.5 | 5-1 | 18.7 | |
| 4′-2 | 18.3 | 17.4 | 5-2 | 11.9 | |
| 4′-3 | 22.3 | 5-3 | 11.8 | 15.7 | |
| 4′-4 | 27.2 | ||||
| 4′-5 | 20.4 | ||||
| AveB | 19.0 | 17.8 | AveB | 12.1 | 15.7 |
The superscript 2 and 4 labels correspond to the doublet and quartet spin states of Cpd I.
The gas-phase QM barriers are provided in Table 6. The barriers to both 4′- and 5-hydroxylation are lower for the doublet spin state of Cpd I (12.9 and 13.4 kcal/mol, respectively). In the gas phase, C4′-hydroxylation has a slightly lower barrier than that of C5-hydroxylation. This is in stark contrast to the QM/MM barriers, where C5-hydroxylation is favored by over 6 kcal/mol.
Table 6. Gas-Phase B3LYP-D(BSIV)//B3LYP-D(BSIII) Energies [in kcal/mol] for Hydroxylation of Diclofenac at the 4′- and 5-Positionsa.
| site of oxidation | 2ERC | 4ERC | 2ETS | 4ETS | 2ΔE⧧ | 4ΔE⧧ |
|---|---|---|---|---|---|---|
| 4′ | –12.1 | –12.1 | 0.8 | 1.3 | 12.9 | 13.4 |
| 5 | –10.5 | –10.5 | 2.9 | 4.9 | 13.4 | 15.5 |
ERC, ETS, and ΔE⧧ correspond to the reactant complex, transition state, and potential energy barrier, respectively. The superscript 2 and 4 labels correspond to the doublet and quartet spin states of Cpd I.
The QM/MM barriers suggest that addition to C5 should be preferred in CYP2C9, which is inconsistent with the metabolites observed during experimental studies.19 Given that QM/MM was able to predict the correct selectivity for addition to warfarin, this may seem surprising. However, a possible explanation for the disagreement with experiment is that the free energies of binding of diclofenac in the respective reactant complexes for 4′- and 5-hydroxylation are not factored into the above evaluations of the energy barriers. For ibuprofen and warfarin oxidation, where the major and minor sites of metabolism are relatively close together, the major and minor metabolites can be formed with the substrate in very similar binding orientations. For diclofenac, the two sites of metabolism that have been investigated are on different rings, and hence the substrate is required to be in two distinct binding poses in order for these sites to be close enough to Cpd I for reaction to occur. Our methods do not take into account the relative free energies of binding for the two orientations. The narrow active-site cavity in CYP2C9 does not allow for interchange between these two orientations during the relatively short time scale available in MD simulations. Simulations of S-warfarin in the active site of CYP2C9 performed by Seifert et al.91 exhibited movement of the substrate around the active site; however, a larger movement than this would be required to interchange between the two binding orientations of diclofenac. In P450s with larger active sites, such as CYP3A4, the major metabolites formed with such isoforms are more likely to be those that result from oxidation of the most reactive site with respect to Cpd I, as the sites will be more likely to be equally accessible to Cpd I. Calculating accurate free energies of binding for P450 substrates is challenging, and beyond the scope of the present work.
The QM/MM optimized structures of the TSs corresponding to the lowest energy C4′ and C5 profiles are superimposed in Figure 17. In the TS corresponding to hydroxylation at C4′, a hydrogen bond is observed between the acid group of diclofenac and Arg108. This interaction is also present in the reactant complex structure, and during the majority of the MD simulation. This interaction cannot occur when diclofenac is oriented for oxidation at C5, and this interaction may explain the preference for oxidation at C4′. As mentioned above, experiments have shown that removal of the acid group from diclofenac results in oxidation at C5.19
Figure 17.
QM/MM transition-state structures for C–O bond formation between C4′ and C5 of diclofenac and the Cpd I ferryl oxygen of CYP2C9, calculated at the B3LYP-D-6-31G(d)/CHARMM27 level of theory (corresponding to doublet profiles 4′-2 and 5-3 in Table 5). The carbon atoms corresponding to C4′ and C5 hydroxylation are displayed in green and orange, respectively.
The gas-phase optimized TS geometries for oxidation at C4′ and C5 of diclofenac are shown in Figure 18. In the C5 hydroxylation TS, the ring undergoing oxidation is oriented parallel to the heme, with an Fe–O–C(5) angle of 135.9°. In the C4′ hydroxylation TS, the ring undergoing oxidation lies at an acute angle relative to the heme. The Fe–O–C(4′) angle is 125.2° for the 4′-hydroxylation TS. Applying the terminology used in our previous work on P450-mediated hydroxylation of benzene,5,55,82 the C5 and C4′ TSs approximate to face-on and side-on addition, respectively. Despite the different geometries observed for the gas-phase TSs to C4′- and C5-hydroxylation, the energies of the two species are very similar (12.9 and 13.4 kcal/mol, respectively, in the doublet spin state of Cpd I).
Figure 18.
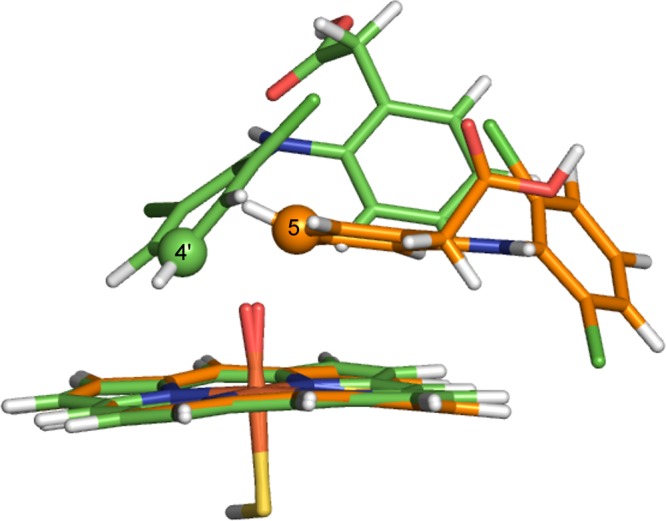
Gas-phase transition state structures for C–O bond formation between C4′ and C5 of diclofenac and the Cpd I ferryl oxygen of CYP2C9, calculated at the B3LYP-D/6-31G(d) level of theory. The carbon atoms corresponding to C4′ and C5 hydroxylation are displayed in green and orange, respectively.
Thus, the present calculations suggest that the observed preference for C4′-hydroxylation of diclofenac in CYP2C9 reflects the formation of the hydrogen-bonding interaction between the acid group of diclofenac and Arg108. The barriers to hydroxylation calculated in the gas phase are generally lower than those calculated in the enzyme, which suggests that the effect of Arg108 is not catalytic, but rather that interaction between the substrate and Arg108 leads to a preference for the 4′-hydroxylation binding site. This is consistent with a pharmacophore model for CYP2C9, which suggests that most substrates for CYP2C9 will have an anionic site at about 8 Å from the site of metabolism, which will interact with a cationic protein residue (Asp108).29,92 The acid carbon of diclofenac is approximately 7.4 Å from C4′ in the gas-phase calculations, and 4.8 Å from C5. Hence hydroxylation at the C5 position would not be expected in CYP2C9, on the basis of the pharmacophore. Certainly, this observation is consistent with the experimental preference for oxidation at C5 in diclofenac with the acid group removed.19 The two oxidation sites in diclofenac are sufficiently distant from each other that distinct binding modes are clearly required. On the other hand, there is unlikely to be a significant difference between the binding complexes for the two competing pathways for ibuprofen and warfarin, where a single binding mode is a sensible starting point for both pathways.
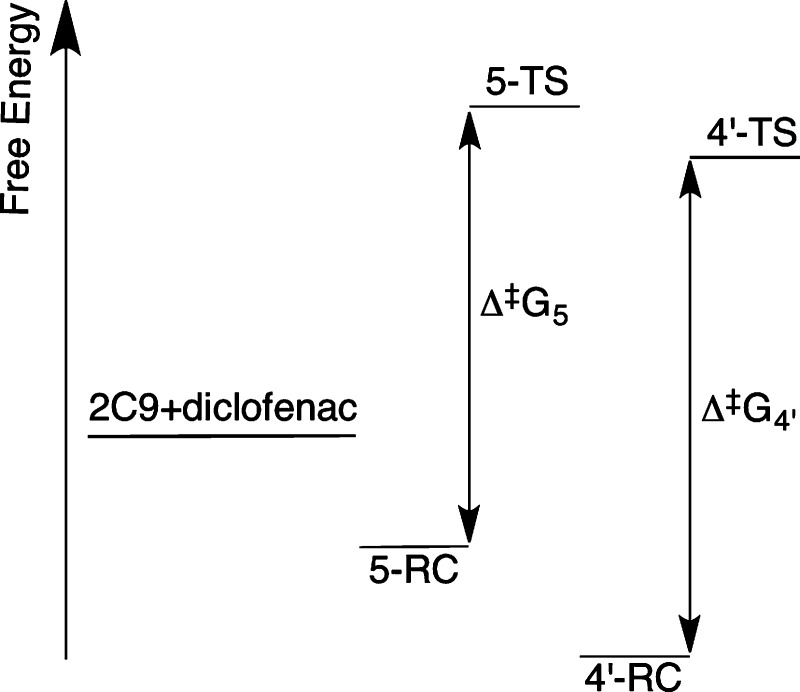
The Curtin–Hammett free energy diagram shown in Figure 19 provides a hypothetical explanation as to why 4′-hydroxylation is favored, despite having a higher QM/MM barrier than that found for C5-hydroxylation. If the free energies of the C4′ reactant complex and TS are lower than those of C5, due to the stabilizing effect of hydrogen-bonding to Arg108, the 4′-hydroxylation pathway would be favored, even if the “local” barrier to hydroxylation at C5 (Δ⧧G5) is smaller. Certainly, this hypothesis is merely speculation at this stage. It would be interesting to investigate this effect further, but accurate calculations of binding free energies for P450s (or indeed other proteins) are not currently routine.93 Further experimental studies of diclofenac oxidation by CYP2C9 in which Arg108 is mutated to another residue might help to support our hypothesis. The R108E mutant CYP2C9 was found to exhibit greatly reduced hydroxylation of diclofenac at the 4′-position; however, no corresponding increase in 5-hydroxylation was reported.86
Figure 19.
Putative energy level diagram for CYP2C9 oxidation of diclofenac. 2C9+diclofenac refers to the free energy of the separate diclofenac molecule and CYP2C9 enzyme. 5-TS/5-RC and 4′-TS/4′-RC correspond to the free energies of the transition states/reactant complexes to 5- and 4′-hydroxylation, respectively. In this hypothesis, the energy barrier to 4′-hydroxylation (Δ⧧G4′) is larger than that of 5-hydroxylation (Δ⧧G5). However, the free energy of binding is greater for 4′-hydroxylation, and the relative energy of the transition state to 4′-hydroxylation is lower than that for 5-hydroxylation; hence 4′-hydroxylation would be the preferred pathway.
Concluding Remarks
Accurate predictions of metabolites formed during P450-mediated metabolism should help identify ADME/Tox properties of drug candidates, and thus lessen the risk of adverse drug reactions arising in the late stages of drug development. Here we have shown that QM/MM calculations can be used to investigate regioselectivity in drug metabolism. We have modeled the metabolism of three commonly used pharmaceutical compounds. Our calculations largely rationalize the experimentally known selectivity and provide further support to the theory that predictions of metabolites can be made on the basis of the relative energy barriers to oxidation by Cpd I at different sites on a given drug molecule. When (as is usually the case) multiple binding modes are possible, it is important also to consider which binding modes are favored; where multiple binding orientations of a drug molecule are accessible, the relative free energies of such orientations may also need to be taken into account. In the case of diclofenac, the relative numbers of hydrogen bonds in the two binding positions provide an indication of the preferred binding mode. Such interactions should be considered during the initial docking of the substrate into the active site.
From a practical perspective, we present a protocol here that can be used for modeling the metabolic reactions of drug molecules in CYP2C9, and indeed in other P450 isoforms. Several factors must be taken into account to achieve reliable results. The choice of method is important; a QM method that can correctly model the electronic structure of Cpd I is imperative. In order to get barrier heights that are in reasonable agreement with experiment, dispersion should be accounted for, e.g., by use of an empirical correction56 as shown here. When calculating reaction barriers in enzymes, conformational sampling is also extremely important, as a wide range of barriers can often be observed due to slight fluctuations in the orientation of the substrate and surrounding residues. This can be achieved by calculating several reaction profiles, using different structures generated from MD simulations. Applied in this way, QM/MM methods can contribute usefully to understanding and predicting drug metabolism by P450s.
Acknowledgments
A.J.M. is an EPSRC Leadership Fellow (grant no. EP/G007705/01) and (together with J.N.H. and R.L.) thanks EPSRC for support. A.J.M. and R.L. also thank EPSRC for support under the CCP-BioSim project (grant no. EP/J010588/1; www.ccpbiosim.ac.uk). K.T.H. acknowledges support from Pfizer and BBSRC and J.Z. from Vernalis. This work was carried out using the computational facilities of the Advanced Computing Research Centre, University of Bristol – http://www.bris.ac.uk/acrc/.
Supporting Information Available
CHARMM topology files and additional parameters for diclofenac, ibuprofen, and warfarin; absolute QM/MM energies of reactant complexes and transition states and QM geometries of all stationary points; PDB coordinate files for the QM/MM optimized stationary points of the lowest energy pathways. This material is available free of charge via the Internet at http://pubs.acs.org.
Author Present Address
§ M.J.d.G.: Argenta, 8/9 Spire Green Centre, Flex Meadow, Harlow, Essex CM19 5TR, U.K.
The authors declare no competing financial interest.
Supplementary Material
References
- Ortiz de Montellano P. R., Ed. Cytochrome P450: Structure, Mechanism, and Biochemistry, 3rd ed.; Kluwer Academic/Plenum Publishers: New York, 2005. [Google Scholar]
- Lonsdale R.; Harvey J. N.; Mulholland A. J. In Iron-Containing Enzymes: Versatile Catalysts of Hydroxylation Reactions in Nature; de Visser S. P., Kumar D., Eds.; RSC Publishing: Cambridge, UK, 2011; Chapter 11, pp 366–399. [Google Scholar]
- de Graaf C.; Vermeulen N. P. E.; Feenstra K. A. J. Med. Chem. 2005, 48, 2725–2755. [DOI] [PubMed] [Google Scholar]
- Kirchmair J.; Williamson M. J.; Tyzack J. D.; Tan L.; Bond P. J.; Bender A.; Glen R. C. J. Chem. Inf. Model. 2012, 52, 617–648. [DOI] [PMC free article] [PubMed] [Google Scholar]
- Bathelt C. M.; Ridder L.; Mulholland A. J.; Harvey J. N. Org. Biomol. Chem. 2004, 2, 2998–3005. [DOI] [PubMed] [Google Scholar]
- Oláh J.; Mulholland A. J.; Harvey J. N. Proc. Natl. Acad. Sci. U.S.A. 2011, 108, 6050–6055. [DOI] [PMC free article] [PubMed] [Google Scholar]
- Ranaghan K. E.; Mulholland A. J. Int. Rev. Phys. Chem. 2010, 29, 65–133. [Google Scholar]
- Lonsdale R.; Harvey J. N.; Mulholland A. J. Chem. Soc. Rev. 2012, 41, 3025–3038. [DOI] [PMC free article] [PubMed] [Google Scholar]
- Lonsdale R.; Harvey J. N.; Mulholland A. J. J. Phys. Chem. B 2010, 114, 1156–1162. [DOI] [PubMed] [Google Scholar]
- Schyman P.; Lai W.; Chen H.; Wang Y.; Shaik S. J. Am. Chem. Soc. 2011, 133, 7977–7984. [DOI] [PubMed] [Google Scholar]
- Li D.; Huang X.; Han K.; Zhan C.-G. J. Am. Chem. Soc. 2011, 133, 7416–7427. [DOI] [PMC free article] [PubMed] [Google Scholar]
- Mitchell J. A.; Akarasereenont P.; Thiemermann C.; Flower R. J.; Vane J. R. Proc. Natl. Acad. Sci. U.S.A. 1993, 90, 11693–11697. [DOI] [PMC free article] [PubMed] [Google Scholar]
- Chandrasekharan N. V.; Dai H.; Roos K. L. T.; Evanson N. K.; Tomsik J.; Elton T. S.; Simmons D. L. Proc. Natl. Acad. Sci. U.S.A. 2002, 99, 13926–13931. [DOI] [PMC free article] [PubMed] [Google Scholar]
- Kaiser D. G.; Vangiessen G. J.; Reischer R. J.; Wechter W. J. J. Pharm. Sci. 1976, 65, 269–273. [DOI] [PubMed] [Google Scholar]
- Rudy A. C.; Knight P. M.; Brater D. C.; Hall S. D. J. Pharmacol. Exp. Ther. 1991, 259, 1133–1139. [PubMed] [Google Scholar]
- Lee E. J.; Williams K.; Day R.; Graham G.; Champion D. Br. J. Clin. Pharmacol. 1985, 19, 669–674. [DOI] [PMC free article] [PubMed] [Google Scholar]
- Hamman M. A.; Thompson G. A.; Hall S. D. Biochem. Pharmacol. 1997, 54, 33–41. [DOI] [PubMed] [Google Scholar]
- Garcia-Martin E.; Martinez C.; Tabares B.; FrIas J.; Agundez J. Clin. Pharmacol. Ther. 2004, 76, 119–127. [DOI] [PubMed] [Google Scholar]
- Mancy A.; Antignac M.; Minoletti C.; Dijols S.; Mouries V.; Ha Duong N.; Battioni P.; Dansette P. M.; Mansuy D. Biochemistry 1999, 38, 14264–14270. [DOI] [PubMed] [Google Scholar]
- Yasar U.; Eliasson E.; Forslund-Bergengren C.; Tybring G.; Gadd M.; Sjöqvist F.; Dahl M.-L. Eur. J. Clin. Pharmacol. 2001, 57, 729–735. [DOI] [PubMed] [Google Scholar]
- Lonsdale R.; Oláh J.; Mulholland A. J.; Harvey J. N. J. Am. Chem. Soc. 2011, 133, 15464–15474. [DOI] [PMC free article] [PubMed] [Google Scholar]
- Rettie A. E.; Korzekwa K. R.; Kunze K. L.; Lawrence R. F.; Eddy A. C.; Aoyama T.; Gelboin H. V.; Gonzalez F. J.; Trager W. F. Chem. Res. Toxicol. 1992, 5, 54–59. [DOI] [PubMed] [Google Scholar]
- Kaminsky L. S.; Zhang Z.-Y. Pharmacol. Ther. 1997, 73, 67–74. [DOI] [PubMed] [Google Scholar]
- Rettie A. E.; Eddy A. C.; Heimark L. D.; Gibaldi M.; Trager W. F. Drug Metab. Dispos. 1989, 17, 265–270. [PubMed] [Google Scholar]
- Pirmohamed M. Br. J. Clin. Pharmacol. 2006, 62, 509–511. [DOI] [PMC free article] [PubMed] [Google Scholar]
- Heimark L. D.; Trager W. F. J. Med. Chem. 1984, 27, 1092–1095. [DOI] [PubMed] [Google Scholar]
- Williams P. A.; Cosme J.; Ward A.; Angove H. C.; Matak Vinkovic D.; Jhoti H. Nature 2003, 424, 464–468. [DOI] [PubMed] [Google Scholar]
- de Groot M. J.; Alex A. A.; Jones B. C. J. Med. Chem. 2002, 45, 1983–1993. [DOI] [PubMed] [Google Scholar]
- Mancy A.; Broto P.; Dijols S.; Dansette P. M.; Mansuy D. Biochemistry 1995, 34, 10365–10375. [DOI] [PubMed] [Google Scholar]
- Jones B. C.; Hawksworth G.; Horne V. A.; Newlands A.; Morsman J.; Tute M. S.; Smith D. A. Drug Metab. Dispos. 1996, 24, 260–266. [PubMed] [Google Scholar]
- Wester M. R.; Yano J. K.; Schoch G. A.; Yang C.; Griffin K. J.; Stout C. D.; Johnson E. F. J. Biol. Chem. 2004, 279, 35630–35637. [DOI] [PubMed] [Google Scholar]
- Dickmann L. J.; Locuson C. W.; Jones J. P.; Rettie A. E. Mol. Pharmacol. 2004, 65, 842–850. [DOI] [PubMed] [Google Scholar]
- Ridderström M.; Masimirembwa C.; Trump-Kallmeyer S.; Ahlefelt M.; Otter C.; Andersson T. B. Biochem. Biophys. Res. Commun. 2000, 270, 983–987. [DOI] [PubMed] [Google Scholar]
- Mackerell A. D.; Bashford D.; Bellott M.; Dunbrack R.; Evanseck J.; Field M.; Fischer S.; Gao J.; Guo H.; Ha S.; Joseph-McCarthy D.; Kuchnir L.; Kuczera K.; Lau F.; Mattos C.; Michnick S.; Ngo T.; Nguyen D.; Prodhom B.; Reiher W.; Roux B.; Schlenkrich M.; Smith J.; Stote R.; Straub J.; Watanabe M.; Wiorkiewicz-Kuczera J.; Yin D.; Karplus M. J. Phys. Chem. B 1998, 102, 3586–3616. [DOI] [PubMed] [Google Scholar]
- Schlichting I.; Berendzen J.; Chu K.; Stock A. M.; Maves S. A.; Benson D. E.; Sweet R. M.; Ringe D.; Petsko G. A.; Sligar S. G. Science 2000, 287, 1615–1622. [DOI] [PubMed] [Google Scholar]
- Morris G. M.; Goodsell D. S.; Halliday R. S.; Huey R.; Hart W. E.; Belew R. K.; Olson A. J. J. Comput. Chem. 1998, 19, 1639–1662. [Google Scholar]
- Vosko S. H.; Wilk L.; Nusair M. Can. J. Phys. 1980, 58, 1200–1211. [Google Scholar]
- Becke A. D. J. Chem. Phys. 1993, 98, 5648–5652. [Google Scholar]
- Stephens P.; Devlin F.; Chabalowski C.; Frisch M. J. Phys. Chem. 1994, 98, 11623–11627. [Google Scholar]
- Lee C.; Yang W.; Parr R. Phys. Rev. B 1988, 37, 785–789. [DOI] [PubMed] [Google Scholar]
- Rassolov V.; Ratner M.; Pople J.; Redfern P.; Curtiss L. J. Comput. Chem. 2001, 22, 976–984. [Google Scholar]
- Jaguar v.5.5; Schrodinger, LLC: Portland, OR, 2005.
- Krause R.; Nielsen J. E.; Vriend G.. WHAT IF Web Interface, http://swift.cmbi.kun.nl/whatif/, accessed June 8, 2012.
- Li H.; Robertson A. D.; Jensen J. H. Proteins: Struct., Funct. Bioinf. 2005, 61, 704–721. [DOI] [PubMed] [Google Scholar]
- Jorgensen W. L.; Chandrasekhar J.; Madura J. D.; Impey R. W.; Klein M. L. J. Chem. Phys. 1983, 79, 926–935. [Google Scholar]
- Żurek J.; Foloppe N.; Harvey J. N.; Mulholland A. J. Org. Biomol. Chem. 2006, 4, 3931–3937. [DOI] [PubMed] [Google Scholar]
- Frushicheva M. P.; Warshel A. ChemBioChem 2012, 13, 215–223. [DOI] [PMC free article] [PubMed] [Google Scholar]
- Lonsdale R.; Hoyle S.; Grey D. T.; Ridder L.; Mulholland A. J. Biochemistry 2012, 51, 1774–1786. [DOI] [PMC free article] [PubMed] [Google Scholar]
- Torrie G. M.; Valleau J. P. Chem. Phys. Lett. 1974, 28, 578–581. [Google Scholar]
- Torrie G.; Valleau J. J. Comput. Phys. 1977, 23, 187–199. [Google Scholar]
- Åqvist J.; Warshel A. Chem. Rev. 1993, 93, 2523–2544. [Google Scholar]
- Harvey J. N. Faraday Discuss. 2004, 127, 165–177. [DOI] [PubMed] [Google Scholar]
- Singh U. C.; Kollman P. A. J. Comput. Chem. 1986, 7, 718–730. [Google Scholar]
- Bathelt C. M.; Żurek J.; Mulholland A. J.; Harvey J. N. J. Am. Chem. Soc. 2005, 127, 12900–12908. [DOI] [PubMed] [Google Scholar]
- Bathelt C. M.; Mulholland A. J.; Harvey J. N. J. Phys. Chem. A 2008, 112, 13149–13156. [DOI] [PubMed] [Google Scholar]
- Grimme S. J. Comput. Chem. 2006, 27, 1787–1799. [DOI] [PubMed] [Google Scholar]
- Hay P.; Wadt W. J. Chem. Phys. 1985, 82, 299–310. [Google Scholar]
- Clark T.; Chandrasekhar J.; Spitznagel G. W.; Schleyer P. V. R. J. Comput. Chem. 1983, 4, 294–301. [Google Scholar]
- Frisch M. J.; Pople J. A.; Binkley J. S. J. Chem. Phys. 1984, 80, 3265–3269. [Google Scholar]
- Krishnan R.; Binkley J. S.; Seeger R.; Pople J. A. J. Chem. Phys. 1980, 72, 650–654. [Google Scholar]
- McLean A. D.; Chandler G. S. J. Chem. Phys. 1980, 72, 5639–5648. [Google Scholar]
- Hay P. J.; Wadt W. R. J. Chem. Phys. 1985, 82, 299–310. [Google Scholar]
- Hehre W. J.; Ditchfield R.; Pople J. A. J. Chem. Phys. 1972, 56, 2257–2261. [Google Scholar]
- Francl M. M.; Pietro W. J.; Hehre W. J.; Binkley J. S.; Gordon M. S.; DeFrees D. J.; Pople J. A. J. Chem. Phys. 1982, 77, 3654–3665. [Google Scholar]
- Dolg M.; Wedig U.; Stoll H.; Preuss H. J. Chem. Phys. 1987, 86, 866–872. [Google Scholar]
- Schafer A.; Horn H.; Ahlrichs R. J. Chem. Phys. 1992, 97, 2571–2577. [Google Scholar]
- Groves J. T.; McClusky G. A. J. Am. Chem. Soc. 1976, 98, 859–861. [Google Scholar]
- Ogliaro F.; Harris D.; Cohen S.; Filatov M.; de Visser S. P.; Shaik S. J. Am. Chem. Soc. 2000, 122, 8977–8989. [Google Scholar]
- Kumar D.; de Visser S. P.; Shaik S. J. Am. Chem. Soc. 2003, 125, 13024–13025. [DOI] [PubMed] [Google Scholar]
- Kumar D.; de Visser S. P.; Sharma P. K.; Cohen S.; Shaik S. J. Am. Chem. Soc. 2004, 126, 1907–1920. [DOI] [PubMed] [Google Scholar]
- Kumar D.; de Visser S. P.; Shaik S. J. Am. Chem. Soc. 2004, 126, 5072–5073. [DOI] [PubMed] [Google Scholar]
- Schöneboom J. C.; Cohen S.; Lin H.; Shaik S.; Thiel W. J. Am. Chem. Soc. 2004, 126, 4017–4034. [DOI] [PubMed] [Google Scholar]
- de Visser S. P.; Kumar D.; Cohen S.; Shacham R.; Shaik S. J. Am. Chem. Soc. 2004, 126, 8362–8363. [DOI] [PubMed] [Google Scholar]
- Kumar D.; Altun A.; Shaik S.; Thiel W. Faraday Discuss. 2011, 148, 373–383. [DOI] [PubMed] [Google Scholar]
- Lonsdale R.; Harvey J.; Mulholland A. J. J. Phys. Chem. Lett. 2010, 1, 3232–3237. [Google Scholar]
- Klose T. S.; Ibeanu G. C.; Ghanayem B. I.; Pedersen L. G.; Li L.; Hall S. D.; Goldstein J. A. Arch. Biochem. Biophys. 1998, 357, 240–248. [DOI] [PubMed] [Google Scholar]
- Claeyssens F.; Harvey J. N.; Manby F. R.; Mata R. A.; Mulholland A. J.; Ranaghan K. E.; Schütz M.; Thiel S.; Thiel W.; Werner H.-J. Angew. Chem., Int. Ed. 2006, 45, 6856–6859. [DOI] [PubMed] [Google Scholar]
- Senn H. M.; Käestner J.; Breidung J.; Thiel W. Can. J. Chem. 2009, 87, 1322–1337. [Google Scholar]
- Ridder L.; Mulholland A. J.; Rietjens I. M. C. M.; Vervoort J. J. Am. Chem. Soc. 2000, 122, 8728–8738. [Google Scholar]
- Ridder L.; Harvey J. N.; Rietjens I. M. C. M.; Vervoort J.; Mulholland A. J. J. Phys. Chem. B 2003, 107, 2118–2126. [Google Scholar]
- Rittle J.; Green M. T. Science 2010, 330, 933–937. [DOI] [PubMed] [Google Scholar]
- Lonsdale R.; Harvey J. N.; Mulholland A. J. J. Chem. Theory Comput. 2012, 8, 4637–4645. [DOI] [PubMed] [Google Scholar]
- Korzekwa K. R.; Swinney D. C.; Trager W. F. Biochemistry 1989, 28, 9019–9027. [DOI] [PubMed] [Google Scholar]
- Bathelt C. M.; Ridder L.; Mulholland A. J.; Harvey J. N. J. Am. Chem. Soc. 2003, 125, 15004–15005. [DOI] [PubMed] [Google Scholar]
- Bush E. D.; Trager W. F. J. Med. Chem. 1985, 28, 992–996. [DOI] [PubMed] [Google Scholar]
- Tai G.; Dickmann L. J.; Matovic N.; DeVoss J. J.; Gillam E. M. J.; Rettie A. E. Drug Metab. Dispos. 2008, 36, 1992–1997. [DOI] [PMC free article] [PubMed] [Google Scholar]
- Sullivan-Klose T. H.; Ghanayem B. I.; Bell D. A.; Zhang Z.-Y.; Kaminsky L. S.; Shenfleld G. M.; Miners J. O.; Birkett D. J.; Goldstein J. A. Pharmacogenetics 1996, 6, 341–349. [DOI] [PubMed] [Google Scholar]
- de Visser S. P.; Shaik S. J. Am. Chem. Soc. 2003, 125, 7413–7424. [DOI] [PubMed] [Google Scholar]
- Rao S. N.; More O’Ferrall R. A.; Kelly S. C.; Boyd D. R.; Agarwal R. J. Am. Chem. Soc.. 1993, 115, 5458–5465. [Google Scholar]
- Darbyshire J. F.; Iyer K. R.; Grogan J.; Korzekwa K. R.; Trager W. F. Drug Metab. Dispos. 1996, 24, 1038–1045. [PubMed] [Google Scholar]
- Seifert A.; Tatzel S.; Schmid R. D.; Pleiss J. Proteins 2006, 64, 147–155. [DOI] [PubMed] [Google Scholar]
- Mancy A.; Dijols S.; Poli S.; Guengerich F. P.; Mansuy D. Biochemistry 1996, 35, 16205–16212. [DOI] [PubMed] [Google Scholar]
- Woods C. J.; Malaisree M.; Hannongbua S.; Mulholland A. J. J. Chem. Phys. 2011, 134, 054114. [DOI] [PubMed] [Google Scholar]
Associated Data
This section collects any data citations, data availability statements, or supplementary materials included in this article.


