Abstract
Purpose
To characterize imaging features of histologically proven hepatic adenoma (HA) as well as histologically and/or radiologically proven focal nodular hyperplasia (FNH) using delayed hepatobiliary MR imaging with 0.05mmol/kg gadoxetic acid.
Materials and Methods
Five patients with six HAs with histological correlation were retrospectively identified on liver MRI studies performed with gadoxetic acid, and T1-weighted imaging acquired during the delayed hepatobiliary phase. Additionally, 23 patients with 34 radiologically diagnosed FNH lesions (interpreted without consideration of delayed imaging) were identified, two of which also had histological confirmation. Signal intensity ratios relative to adjacent liver were measured on selected imaging sequences.
Results
All six hepatic adenomas (100%), which had histological confirmation, demonstrated hypointensity relative to adjacent liver on delayed imaging. Further, all of the FNH (including 34 radiologically proven, 2 of which were also histologically proven) were either hyperintense (23/34, 68%) or isointense (11/34, 32%) relative to the adjacent liver on delayed imaging. None of the FNHs were hypointense relative to liver.
Conclusion
Distinct imaging characteristics of HA versus FNH on delayed gadoxetic acid-enhanced MRI, with adenomas being hypointense and FNH being iso- or hyperintense on delayed imaging may improve specificity for characterization, and aid in the differentiation of these two lesions.
Keywords: hepatic adenoma, focal nodular hyperplasia, FNH, gadoxetic acid, magnetic resonance imaging
INTRODUCTION
Hepatic adenoma (HA) and focal nodular hyperplasia (FNH) are benign lesions of the liver that occur predominantly in women of child-bearing age. Both lesions are typically asymptomatic and are often discovered incidentally on imaging (1–2). HA is strongly associated with exposure to estrogens, particularly estrogen-containing oral contraceptives. HA may rupture and hemorrhage, particularly after recent hormonal use and with increasing tumor size (3). Importantly, malignant transformation may occur in up to 5% of HAs (4). For these reasons, HA, particularly larger and subcapsular lesions, are often excised surgically. On the contrary, FNH has no known malignant potential and few, if any, complications, and therefore is considered a “do not touch” lesion.
MRI is a well-established diagnostic tool for detection and characterization of focal liver lesions. For some lesions such as FNH, when characteristic features are present, (e.g., hypervascularity on arterial phase, central scar, etc) the radiological diagnosis is widely accepted as the definitive diagnosis (5). This is possible because the imaging appearance of FNH is relatively consistent and atypical FNH are uncommon (6). The appearance of HA, however, can be highly variable. It typically presents as a hypervascular lesion with variable T2-weighted (T2w) signal, and occasionally contains fat (7). Unfortunately, in many situations, HA and FNH have similar imaging appearances. Given these imaging similarities, and overlapping patient populations, additional imaging information that can improve specificity in distinguishing HA from FNH would be very helpful.
Extensive experience with delayed MR imaging using hepatobiliary gadolinium based contrast agent (GBCA), gadobenate dimeglumine, has been reported (5, 8). These studies have demonstrated that FNH lesions are typically iso- or hyperintense relative to the adjacent liver parenchyma on the delayed hepatobiliary phase while hepatic adenomas are almost invariably hypointense. The major disadvantage of gadobenate dimeglumine for differentiation of HA from FNH is that only 4–5% of this agent is taken up into liver resulting in a comparably late delayed imaging phase beginning after 45–60 min (9).
Gadoxetic acid (Eovist, Bayer Health Care Pharmaceuticals Inc, Wayne, NJ) is an alternative hepatobiliary GBCA that was recently approved by the FDA. It has dual pharmacokinetic properties; it is similar to conventional extracellular agents, making it appropriate for dynamic phase imaging, and it also demonstrates rapid uptake into functioning hepatocytes and excretion into the bile yielding delayed hepatobiliary phase imaging. Approximately 50% of gadoxetic acid is taken up into functioning hepatocytes and subsequently excreted into the bile ducts. Peak enhancement occurs at approximately 20 minutes, and delayed enhancement persists for several hours (10).
Given the higher uptake (50% vs. 4–5%) and earlier hepatobiliary phase of gadoxetic acid, compared to gadobenate dimeglumine, it may be advantageous to use gadoxetic acid for characterization of HA and FNH. However, our literature review revealed MR imaging findings in only 6 histologically proven cases of HA from two publications (11–12), and only 16 histologically proven cases of FNH (12–13). For FNH, these reports have demonstrated that gadoxetic acid has a similar uptake pattern as gadobenate dimeglumine. Reports on MR imaging of HA’s with gadoxetic acid, however, demonstrated both hyper- and hypointensity on delayed phase imaging (11–12). Therefore, there is uncertainty regarding the enhancement patterns of hepatic adenomas in the delayed hepatobiliary phase after injection of gadoxetic acid.
Gadoxetic acid has been approved for liver lesion characterization at a dose of 0.025mmol/kg. This dose is based on the minimum effective dose for detecting and characterizing lesions in the delayed hepatobiliary phase, without regard to the dynamic phase of contrast enhancement. There is a growing body of literature demonstrating this dose may be insufficient for adequate enhancement during the dynamic phase and that 0.05mmol/kg may be a more appropriate dose when dynamic phase imaging is necessary (13–16). Therefore, the purpose of this retrospective study is to describe the enhancement patterns of gadoxetic acid-enhanced MRI in histologically proven cases of HA and FNH, and in radiologically diagnosed FNH. A secondary aim of this work is to report the enhancement pattern of these lesions at a dose of 0.05mmol/kg of gadoxetic acid.
MATERIALS AND METHODS
Lesion and Patient Identification
After obtaining approval from our institutional review board, a retrospective review of all abdominal MRI studies was performed between July 2008 and December 2010. In accordance with IRB approval, digital departmental reports of abdominal MRI studies were searched for the key words: "adenoma", "FNH", and "focal nodular hyperplasia". Of these studies, all exams performed with gadoxetic acid were selected. Of the remaining studies, medical records were searched for available pathology reports related to biopsy or surgical excision. Data were collected in compliance to HIPAA regulations.
MR Imaging
Imaging was performed on 1.5T clinical scanners (Signa HDx or HDxt, GE Healthcare, Waukesha, WI) using an 8-channel phased array torso or cardiac coil. Patients were administered 0.05mmol/kg of gadoxetic acid at 2.0 ml/s and delayed phase imaging was performed at approximately 20 minutes.
Image parameters for 3D dynamic phase T1 weighted (T1w) spoiled gradients imaging with periodic spectrally selective intermittent fat inversion included (LAVA (17)): 256 × 192 matrix, TR/TE: 4.3/1.9 ms, FOV: 36–40 cm, slice thickness: 5mm, receiver bandwidth: ±62.5 kHz, number of slices: 44. The true spatial resolution was 1.4–1.6 × 1.9–2.1 × 5mm3 (interpolated to 0.7–0.8 × 0.7–0.8 × 2.5mm3), and scan time was 23s. Pre-contrast, late arterial, portal venous, and 2–5 minute equilibrium phase T1w imaging was performed in all patients.
Delayed hepatobiliary imaging at 20 minutes was performed using an investigational version of a free-breathing 3D-SPGR T1-weighted acquisition with a periodic cylindrical excitation “navigator” pulse that was used to determine diaphragm position and reject data acquired outside of a prescribed range of motion. Fat-suppression was achieved with intermittent spectrally selective fat suppression (LAVA, GE Healthcare) (18). In addition, this sequence was modified to allow the use of higher flip angles (30–40°) to maximize SNR and CNR performance (18–19). Other imaging parameters for delayed sequences included: matrix: 320 × 256, TR/TE: 5.8/2.7 ms, FOV: 36 cm, slice thickness: 1.8 mm, BW: ±62.5 kHz, number of slices: 100, for true spatial resolution of 1.1 × 1.4 × 1.8mm3 interpolated to 0.7 × 0.7 × 0.9mm3. Total scan time was approximately 4–6 minutes depending on the patients’ pattern of breathing.
Per clinical standard, image parameters for respiratory triggered 2D fat suppressed T2 weighted (T2w) fast spin-echo (FSE) imaging included: matrix: 320 × 224, TR/TEeff: 1 respiratory cycle/ 90 ms, FOV: 36–40cm, slice thickness: 5 mm with 1mm gap, echo train length: 16, BW: ±50 kHz, number of slices: 60. True spatial resolution was 1.1–1.3 × 1.6–1.8 × 5mm3 (interpolated to 0.7–0.8 × 0.7–0.8 × 5mm3) and scan time was approximately 5 min, depending on respiratory rate.
Image parameters for T1w 2D in and opposed phase imaging included: matrix: 320 × 192, TR: 150–160 ms/TE1: 2.3 ms/TE2: 4.6 ms, BW: ±83 kHz, flip angle: 70°, FOV: 36–40cm, slice thickness: 5mm, number of slices: 42–50. True spatial resolution was 1.1–1.3 × 1.9–2.1 × 5mm3 (interpolated to 0.7–0.8 × 0.7–0.8 × 5mm3) and scan time was approximately 20–22 sec, broken into 2 or 3 breath-holds, depending on the number of slices.
Image Analysis
All images were evaluated by two board certified radiologists with fellowship training in abdominal imaging, and with 7 and 10 years of clinical experience, respectively. The analysis consisted of i) a review of the clinical diagnosis of FNH cases without taking into account delayed phase T1w imaging, ii) a confidence grading of lesions defined as FNH, and iii) a quantitative analysis of signal intensities in FNH and HA, which are described in the following two sections.
In order to remove the influence of delayed enhancement patterns on the radiological diagnosis of FNH, all lesions with an initial clinical diagnosis of FNH were re-evaluated. Well-established criteria for characteristics of FNH (e.g., hypervascularity on arterial phase, presence of central scar, etc) were used to establish a radiological diagnosis of FNH (7). Only T2w, contrast-enhanced dynamic phase T1w, in/opposed phase, and diffusion weighted images were evaluated in consensus to establish a radiological diagnosis of FNH.
The original clinical interpretation may have included or been influenced by the presumed behavior that FNH are iso- or hyperintense to adjacent liver parenchyma, based on the known behavior of FNH with gadobenate dimeglumine, despite the fact that gadoxetic acid was used. Therefore, in the re-evaluation of these cases, delayed hepatobiliary phase images were not taken into account. A 4-point confidence grading was assigned in an independent reading. In discrepant cases, a consensus grading was reached. Grading was performed as follows:
FNH equally possible in comparison to other lesions in differential diagnosis
FNH most likely diagnosis, other lesions must be considered in differential diagnosis
FNH most likely diagnosis, other lesions highly unlikely, although possible
FNH only possible diagnosis, no other lesion considered in differential diagnosis
All cases assigned a 4 were considered to have a radiological diagnosis of FNH.
To establish objective measures for iso-, hyper-, and hypointensity, signal intensity ratios (SIR) of the lesions compared to adjacent liver parenchyma were measured on T1w in- and out-of-phase, pre-contrast T1w and T2w images, and contrast enhanced dynamic T1w (arterial phase, portal venous phase and the 20 minutes delayed hepatobiliary phase) images. Analysis was performed on an Advanced Workstation (GE Healthcare, Waukesha, WI). Regions of interest (ROI) were manually placed in each lesion and in adjacent liver parenchyma, with as large a size as reasonably possible to lie within the lesion and to avoid large vessels or bile ducts. Then, the signal intensity ratio (SIR) of lesion to liver signal was calculated. For in- and out-of-phase imaging, the out of phase image signal was normalized to the in phase image at the same location, not to the surrounding liver tissue (i.e., hypointensity of out of phase images representing lesions containing fat). Lesions were characterized as hypo-intense if the SIR was <0.95, iso-intense if the lesion had a SIR ≥ 0.95 and ≤ 1.05, and hyper-intense if the SIR measured >1.05.
Pattern Identification
As discussed below in the Results section, three general patterns of delayed hepatobiliary enhancement were identified in the FNH cases. Some FNHs experienced uniform enhancement throughout the lesion such that any complex morphology seen on delayed imaging was very similar to that noted on late arterial phase imaging. Further, many of the FNHs had a relatively hyperintense and thick rim on delayed imaging that did not correspond to the same regions of late arterial enhancement. Of these FNHs with a hyperintense rim, some had a central core that was hypointense to the adjacent liver, while others had a central core that was isointense or hyperintense to the adjacent liver. Based on these three patterns of enhancement, we classified all FNHs into one of the three following categories:
Type 1 = Uniform uptake, iso- or hyperintense to liver
Type 2 = Hyperintense rim with core that is hypointense relative to liver
Type 3 = Hyperintense rim with core that is iso- or hyperintense to liver
It is important to note that these classifications are based on general patterns of appearance on delayed imaging and are not based on any form of histological correlation. [SR1]Correlation of enhancement pattern type with approximate lesion area on the image with longest lesion diameters (antero-posterior×transverse dimension) was performed using unpaired two-sided t-test and Spearman rank correlation test.
Histological Analysis
All cases of HA and FNH with pathological correlation were re-reviewed in a blinded manner by a board certified pathologist with 9 years of experience. The specimen consisted of biopsies and resections. Both FNHs contained the diagnostic features of fibrous septa with a ductular reaction and irregularly thickened arteries unaccompanied by bile ducts, lying against nodular proliferation of hepatocytes without portal tracts or central veins. The diagnosis of HA in the remainder of the cases was made on the basis of benign hepatocytes regularly arranged in the usual 1–2 cell thick cords separated by non-dilated sinusoids but completely lacking portal tracts. One of the HAs was originally missed on needle core biopsy because the pathologist was not aware of the fact that the biopsy was a mass lesion. None of the other diagnoses was altered by blinded review.
RESULTS
Identification of Hepatic Adenoma Cases
The medical records search revealed 6 HAs in 5 female patients with both gadoxetic acid enhanced MRI and a pathological diagnosis of HA made on biopsy or surgical resection. One of the patients had numerous lesions consistent with liver adenomatosis (20) and two of these lesions were biopsied. Therefore, 6 histologically proven HA lesions from 5 female patients (mean age at diagnosis = 35 years, range 21 to 51 years), all with a history of oral contraceptive use, were included in the analysis. Cases of presumed HA without pathological correlation were excluded from our study.
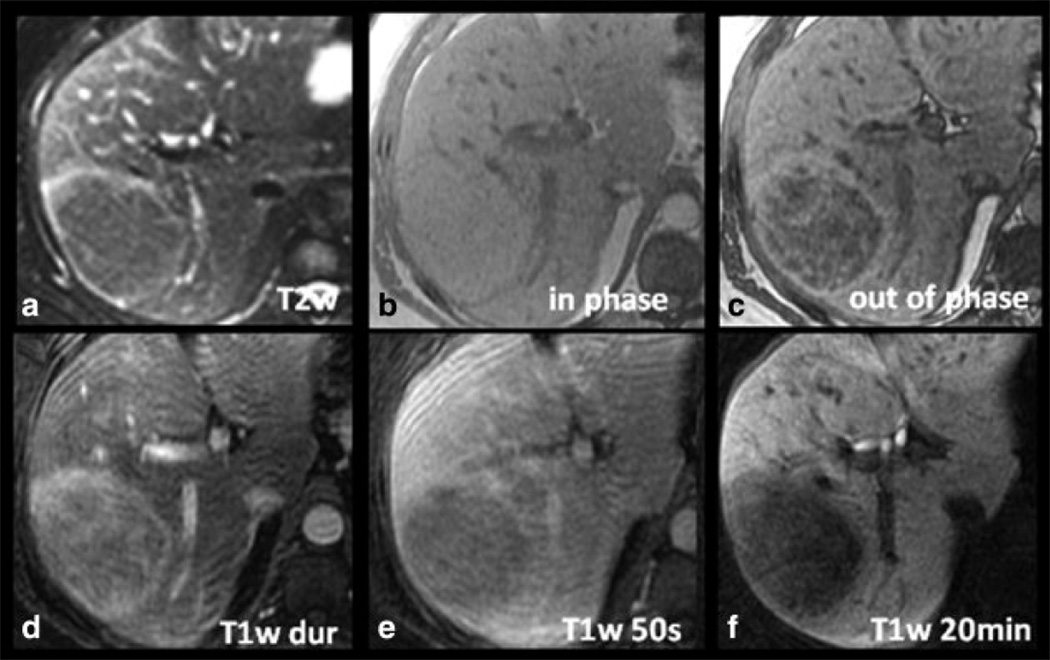
Figure 1 shows a case of histologically proven hepatic adenoma in a 34-year-old woman. The lesion is hyperintense on the late arterial phase contrast-enhanced T1w image, contains a significant amount of fat as demonstrated by dropout of signal on opposed phase imaging, and is hyperintense on T2w imaging. Delayed hepatobiliary phase T1w image at 20 minutes demonstrates that the lesion is hypointense relative to the adjacent liver. The lesion was surgically resected and shown histologically to be an HA. Of note, this patient had a second hypervascular lesion (not shown) in the right lobe of the liver that was isointense on delayed hepatobiliary images. This lesion was resected at the same time as the adenoma and shown histologically to be an FNH.
Figure 1.
Imaging characteristics of a histologically proven HA in a 34-year-old woman with gadoxetic acid-enhanced MRI. The lesion is hyperintense on the late arterial phase contrast-enhanced T1w image (T1w dur, D), contains a significant amount of fat as demonstrated by dropout of signal on opposed phase imaging (C), and is slightly hyperintense on T2w imaging (A). Note the hypointensity of the lesion on delayed T1w hepatobiliary phase images at 20 minutes (T1w 20min, F) relative to the adjacent liver.
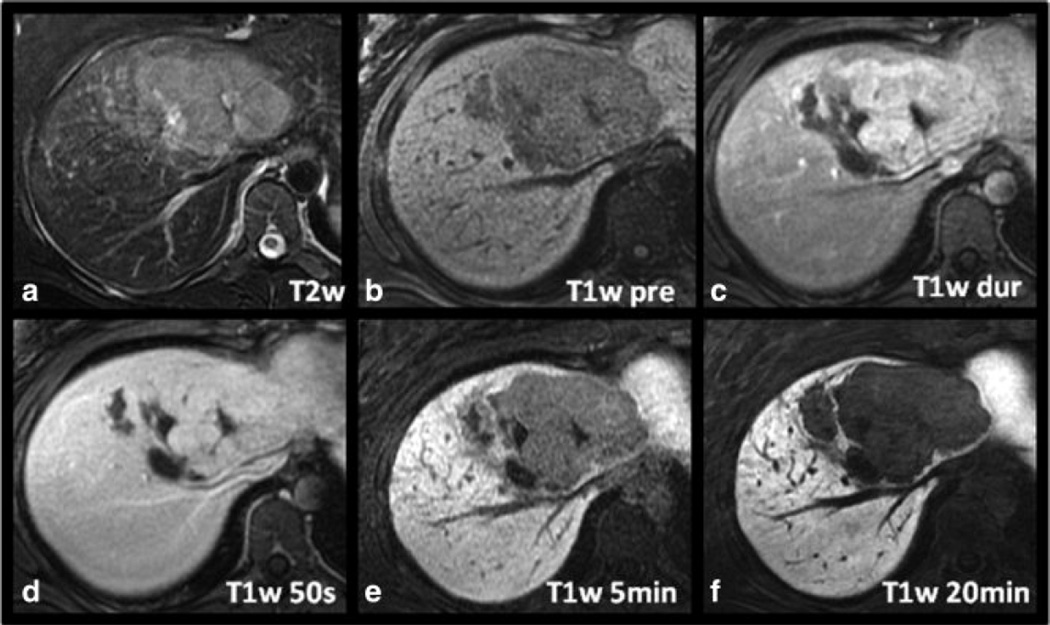
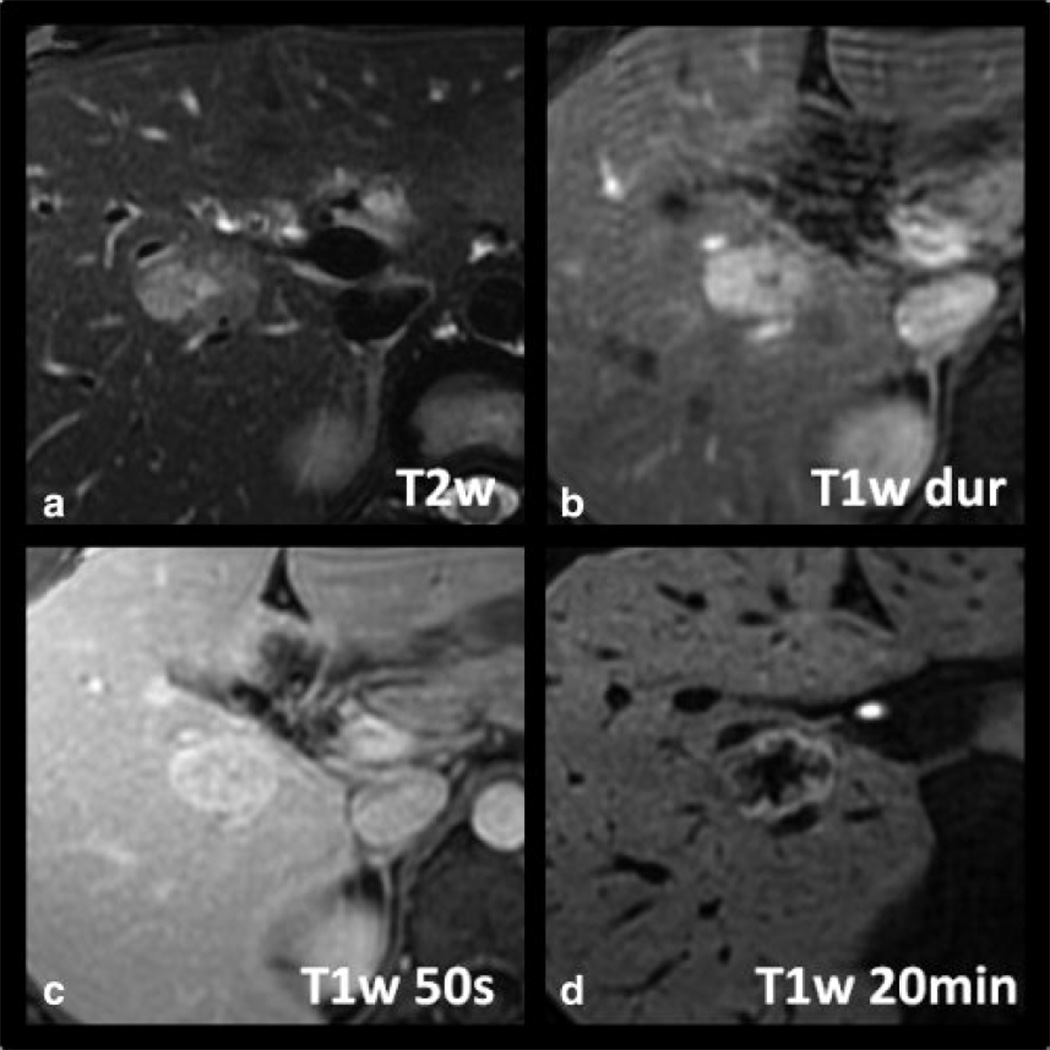
Figure 2 shows a second case of histologically proven HA in a 21-year-old woman. The lesion has a central scar and the arterial enhancement is relatively intense, making it initially difficult to distinguish from an FNH. The delayed hepatobiliary phase image at 20 minutes, however, demonstrates marked hypointensity of the lesion compared to surrounding liver.
Figure 2.
Another example of a histologically proven HA in a 21-year-old woman. The lesion demonstrates relatively intense arterial enhancement (C) and a central scar, making it difficult to distinguish from an FNH. However, note the marked hypointensity of the lesion compared to surrounding liver which was a common finding seen in all the hepatic adenomas.
Identification of Focal Nodular Hyperplasia Cases
Twenty-three patients (19 women, 4 men; mean age 34.5 years, range 19 to 55) with 34 lesions with a radiological diagnosis of FNH were identified based on the four-point confidence scoring system and a confidence score of 4 by both radiologists. Of the 34 FNH lesions, two were histologically proven, one by surgical resection (this FNH occurred in the patient with an adenoma that was surgically resected, described above) and the other, in a different patient, by biopsy. Both patients with histologically proven FNH were female, 34 and 25 years old, respectively.
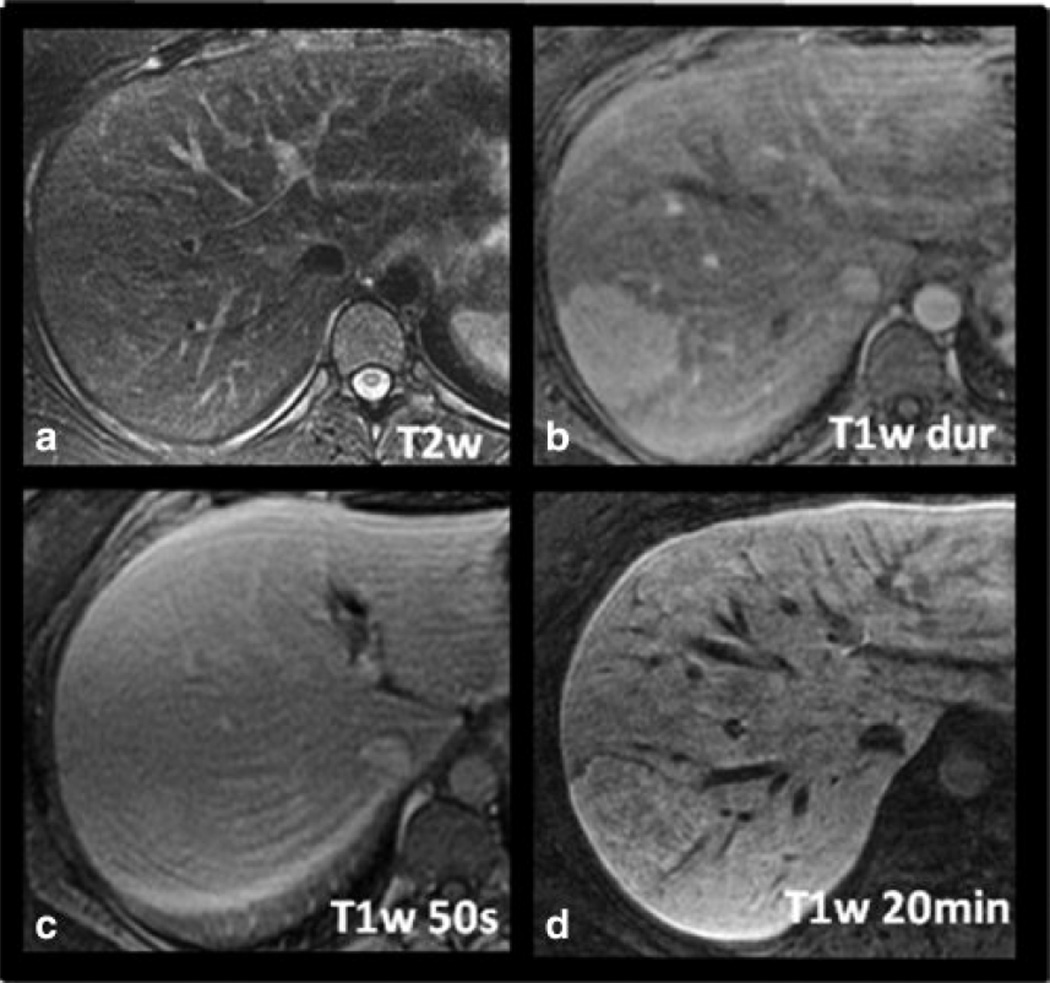
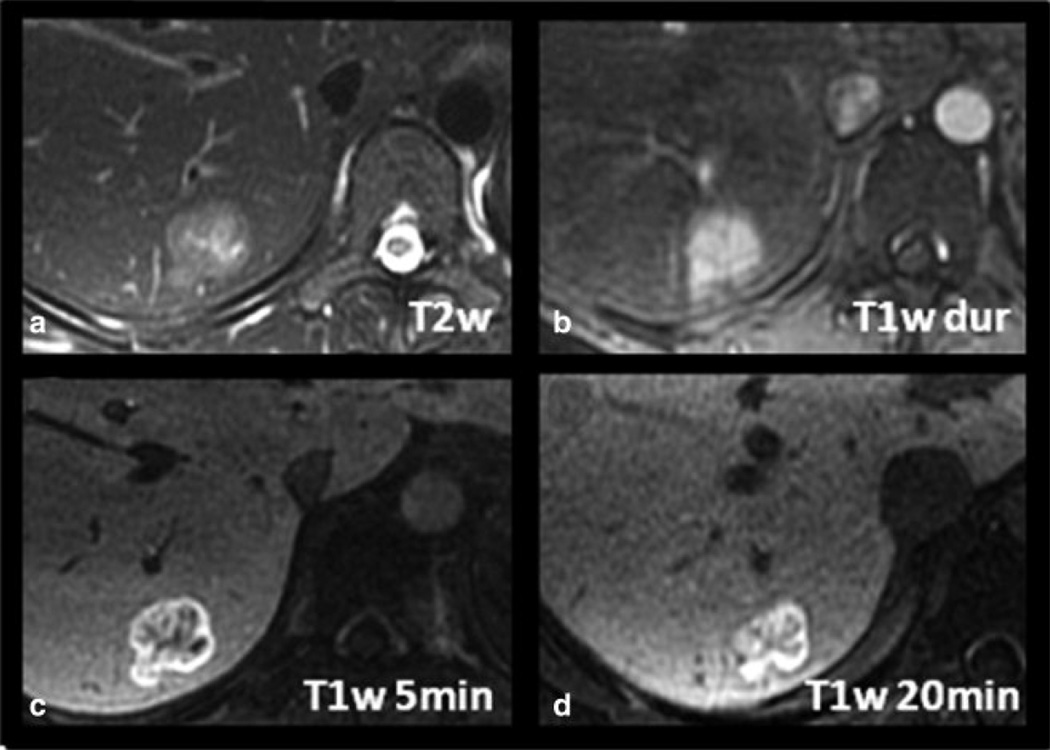
Figure 3 shows a case of a histologically proven FNH in a 25-year-old woman. The lesion is hyperintense on late arterial phase T1w imaging with equalization in the portal venous phase and isointensity on T2w imaging. Delayed T1w hepatobiliary phase images at 20 minutes demonstrated that the lesion was hyperintense to the adjacent parenchyma. The lesion lacked a central scar and the patient had an unusual presentation of hemoperitoneum, raising the possibility that this lesion may have been an adenoma. Given its subcapsular location, and the potential risk for catastrophic hemorrhage if the lesion were an adenoma, core biopsy was performed. Histological findings were diagnostic of FNH.
Figure 3.
Imaging characteristics of a histologically proven FNH in a 25-year-old woman with gadoxetic acid-enhanced MRI. The lesion is hyperintense on late arterial phase T1w imaging (B) with equalization in the portal venous phase (C) and isointensity on T2w imaging (A). Note slight hyperintensity of the lesion on delayed T1w hepatobiliary phase images at 20 minutes distinguishing it from hepatic adenoma. No central scar is present in this case.
Table 1 lists the imaging features of all histologically proven hepatic adenomas and FNH identified in this study. Of the 6 HA evaluated, 2 demonstrated low out phase/in phase SIRs reflecting intralesional fat. Of the 6 HA, 5 were hyperintense on T2w imaging and one lesion was isointense compared to adjacent liver. All lesions demonstrated hyperintensity on arterial phase sequence. Signal intensities were more variable on portal venous phase, with 3 lesions hyperintense, and 3 hypointense compared to adjacent liver. On the 20 minutes delayed hepatobiliary phase T1w imaging, all 6 hepatic adenomas demonstrated hypointensity relative to adjacent liver parenchyma.
Table 1.
Signal characteristics of histologically proven HA and FNH on gadoxetic acid-enhanced MRI expressed by SIR (signal intensity ratio; in brackets) and qualitative description.
| Age/Sex | Imaging Sequence | ||||||||||||
|---|---|---|---|---|---|---|---|---|---|---|---|---|---|
| Dx | T1w pre contrast |
Out of Phase / In Phase |
T2w | T1w arterial |
T1w portal venous |
T1w delayed (20min) |
|||||||
| 22 y/o F | HA | Hyper | [1.06] | Iso | [1.01] | Hyper | [1.95] | Hyper | [1.36] | Hyper | [1.15] | Hypo | [0.93] |
| 34 y/o F | HA | Hypo | [0.75] | Hypo | [0.63] | Hyper | [1.09] | Hyper | [1.12] | Hypo | [0.79] | Hypo | [0.35] |
| 21 y/o F | HA | Hypo | [0.74] | Iso | [1.03] | Hyper | [1.33] | Hyper | [1.11] | Hypo | [0.90] | Hypo | [0.29] |
| 50 y/o F | HA | Hyper | [1.16] | Hypo | [0.75] | Hyper | [1.73] | Hyper | [2.08] | Hyper | [1.18] | Hypo | [0.48] |
| 51 y/o F | HA* | Hyper Iso |
[1.32] [0.99] |
Iso Hyper |
[0.99] [1.07] |
Iso Hyper |
[0.96] [1.26] |
Hyper Hyper |
[1.57] [1.37] |
Hyper Hypo |
[1.06] [0.92] |
Hypo Hypo |
[0.43] [0.41] |
| 34 y/o F | FNH | Iso | [1.02] | Iso | [0.95] | Hyper | [1.64] | Hyper | [1.67] | Hyper | [1.33] | Hyper | [1.07] |
| 25 y/o F | FNH | Iso | [1.00] | Hyper | [1.17] | Iso | [1.02] | Hyper | [1.23] | Iso | [0.97] | Iso | [1.01] |
Hepatic adenomatosis: representative biopsied lesions. Dx = Diagnosis, Hyper = hyperintense, Iso = isointense, Hypo = hypointense.
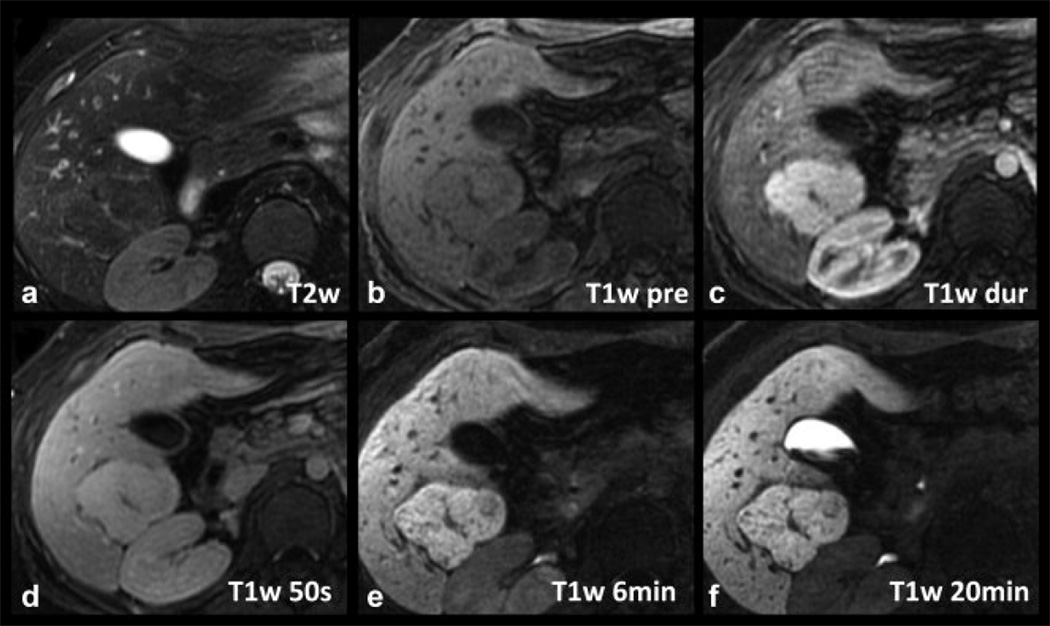
Figures 4–6 shows examples of FNH with three different patterns of delayed hepatobiliary enhancement, including a type 1 lesion (Figure 4), a type 2 lesion (Figure 5) and a type 3 lesion (Figure 6). In the type 1 lesion, the uptake is uniform throughout the lesion, and the complex morphology of the lesion, including the presence of a central scar, matches that seen in the late arterial phase T1w image. The type 2 and 3 lesions demonstrate a very intense rim, brighter than the adjacent liver or central core. The central core is much larger in extent than the central scar (if present) and has a substantially different uptake than the uniform uptake seen in type 1 FNHs. Type 2 FNHs demonstrated a relatively dark core, hypointense to both the rim and the adjacent liver, while the core of type 3 FNHs was hypointense relative to the rim, but iso- or hyperintense to the surrounding liver.
Figure 4.
Example of a radiologically diagnosed FNH with type 1 pattern of delayed enhancement on gadoxetic acid-enhanced MRI. The delayed uptake is overall uniform throughout the lesion, and the complex morphology of the lesion, including the presence of a central scar, matches that seen in the late arterial phase T1w image (C).
Figure 6.
Example of a radiologically proven FNH with type 3 pattern of delayed enhancement on gadoxetic acid-enhanced MRI. Note a very intense rim, brighter than the adjacent liver or central core. The central core is larger in extent than the central scar and is hypointense to the rim but iso- to hyperintense to the adjacent liver.
Figure 5.
Example of a radiologically proven FNH with type 2 pattern of delayed enhancement on gadoxetic acid-enhanced MRI. Note an intense rim, brighter than the adjacent liver or central core (D). The central core is larger in extent than the central scar and is hypointense to both the peripheral rim and surrounding liver.
Table 2 lists the imaging features of all radiologically and histologically proven FNH using gadoxetic acid-enhanced MRI. With T2w imaging, 21 of 34 (62%) of the FNHs were hyperintense and 7 of 34 (21%) were isointense, while 6 of 34 (17%) lesions were isointense and could not be identified at all on this sequence. On the arterial phase, all FNH lesions were hyperintense. On portal venous phase 23 of 34 (68%) lesions were slightly hyperintense (SIR=1.19 ± 0.46), 10 of 34 (29%) were isointense (SIR = 1.01 ± 0.03) and one (3%) was slightly hypointense (SIR = 0.94). On the delayed hepatobiliary phase, FNH lesions were either hyperintense (23 of 34, 68%) or isointense (11 of 34, 32%) when compared to surrounding liver signal intensity. No FNHs were hypointense relative to liver parenchyma.
Table 2.
Signal characteristics of 34 radiologically diagnosed FNH, two of which are also histologically diagnosed, with gadoxetic acid-enhanced MRI.
|
Signal Intensities |
Imaging Sequence | |||||||||||
|---|---|---|---|---|---|---|---|---|---|---|---|---|
|
T1w pre contrast |
Out of Phase / In Phase |
T2w |
T1w arterial |
T1w portal venous |
T1w delayed (20min) |
|||||||
| n (%) | SIR | n (%) | SIR | n (%) | SIR | n (%) | SIR | n (%) | SIR | n (%) | SIR | |
| Hyperintense | 5 (15%) | 1.29 ± 0.23 | 3 (9%) | 1.11 ± 0.05 | 21 (62%) | 1.48 ± 0.27 | 34 (100%) | 1.65 ± 0.46 | 23 (68%) | 1.19 ± 0.46 | 23 (68%) | 1.23 ± 0.12 |
| Isointense | 10 (29%) | 1.01 ± 0.03 | 15 (44%) | 1.00 ± 0.03 | 7 (21%) | 1.01 ±0.02 | 0 | n/a | 10 (29%) | 1.01 ±0.03 | 12 (32%) | 1.00 ± 0.02 |
| Hypointense | 18 (53%) | 0.85 ± 0.06 | 10 (29%) | 0.89 ± 0.05 | 0 | n/a | 0 | n/a | 1 (3%) | 0.94 | 0 | n/a |
| Total | 33* | 28** | 28*** | 34 | 34 | 34 | ||||||
SIR: signal intensity ratios
One lesion was not visible on pre-contrast T1w imaging.
Six lesions were not visible on in and out of phase imaging
Six lesions were not visible on T2 weighted imaging
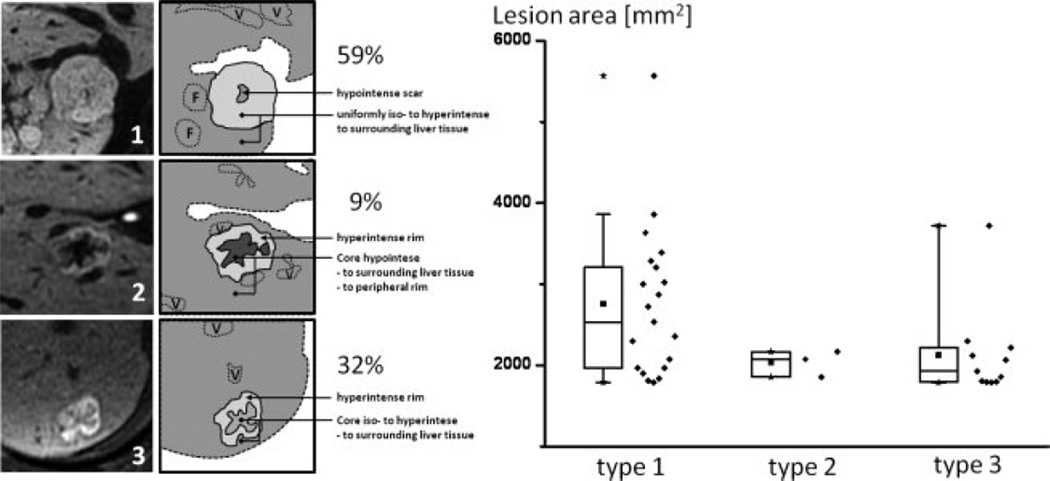
Figure 7 depicts the three types of enhancement pattern according to our proposed classification. The pattern of enhancement on delayed imaging was type 1 in 20 (59%), type 2 in three (9%) and type 3 in 11 (32%) of the FNH lesions. The average lesion area on the image with largest lesion diameters (AP × transverse dimensions) was 14.5 ± 13.0 cm2 (range: 1.0–54.0) for type 1 lesions, 4.4 ± 2.2 cm2 (range: 2.0–6.3) for type 2 lesions and 5.7 ± 7.8cm2 (range: 1.0–28.1) for type 3 lesions. Statistical comparison using an unpaired two-sided t-test revealed no statistical significance between lesions sizes and groups (type 1 vs. type 2: P = 0.202; type 2 vs. type 3: P = 0.705; type 1 vs. type 3: P = 0.051). Spearman Rank correlation test did not reveal a correlation between group and lesion diameter (r = −0.244).
Figure 7.
Left: Schematic representation of the three observed FNH patterns (1, 2, 3). F = additional FNH’s; V = vessel. Right: Box plots show the distribution of enhancement pattern types in comparison to approximate lesion area on the image with largest lesion diameters (mm2). No correlation of enhancement pattern type and maximum size was seen, although the larger lesions tended to demonstrate type 1 delayed enhancement. For detailed statistics, please refer to Results section. Solid cube = median, stars = minimum and maximum value; diamonds next to box plots show the data distribution.
We evaluated all FNH for presence of central scar, which was found in only 14/34 (41%) of lesions. All central scars demonstrated relative lack of enhancement on post contrast and delayed sequences, as expected with gadoxetic acid as recently described in detail by Karam et. al. (21).
DISCUSSION
In this study, we have reported the detailed imaging and enhancement characteristics of gadoxetic acid-enhanced MRI in 6 histologically diagnosed HA, and 34 radiologically diagnosed FNH, 2 of which had histological confirmation. In our study, all adenomas were hypointense on delayed hepatobiliary imaging, while FNH were iso- or hyperintense, relative to adjacent liver parenchyma. Further, these results report the first histologically confirmed cases of HA and FNH using 0.05mmol/kg of gadoxetic acid. These results are consistent with previously reported behavior of HA and FNH described with gadobenate dimeglumine (5).
The ability to make a confident diagnosis and differentiation of HA and FNH on imaging is of great importance, because HAs are prone to complications that include hemorrhage and potential for malignant transformation, and thus are often surgically resected. Given that these two lesions often occur in same patient population, and that the imaging characteristics of HA are variable, in many situations it may be difficult to distinguish HA from FNH using conventional MR imaging. Delayed hepatobiliary phase imaging with gadobenate dimeglumine has proven helpful in distinguishing HA from FNH (5, 8, 13). However, published data on imaging features of HA using delayed phase imaging with gadoxetic acid has been very limited and also variable. From the 3 HA that Huppertz et al. described in 2005, 2 were hyperintense on delayed imaging and one was hypointense (12). On the other hand, all three cases of adenomatosis described by Giovanoli et al. demonstrated hypointensity on delayed phase imaging (11). To our knowledge, these are the only two published studies describing the behavior of pathologically proven adenomas on delayed gadoxetic acid-enhanced imaging, demonstrating the paucity of published literature on this topic. The studies investigating imaging features of FNH on delayed gadoxetic acid-enhanced MRI, however, have invariably found that FNH are predominantly iso- or hyperintense. This is consistent with previous findings described with the use of gadobenate dimeglumine (12–13).
The mechanisms underlying the uptake or lack of uptake of liver specific contrast agents by FNH and HA are not well understood. FNH is believed to be caused by a congenital vascular disorder, leading to a hyperplastic response of surrounding liver parenchyma (22). Histologically, FNHs are characterized by normal hepatocytes, malformed biliary ducts and thick-walled vessels. It is reasonable to assume that the presence of malformed biliary ducts may lead to slower biliary excretion compared to surrounding liver parenchyma and retention of contrast within the lesion, leading to signal hyperintensity on delayed hepatobiliary phase imaging. Further, we speculate that malformed biliary morphology may contribute to the pattern of rim hyperintensity seen in many of the FNHs in this study, although we have no data to substantiate this supposition.
Conversely, HA are histologically characterized by large plates or cords of neoplastic cells of hepatocyte origin; these plates are separated by dilated sinusoids. Bile ductules are absent, which is a key feature that helps distinguish HA from FNH histologically (23). Grazioli et al. have suggested that absence of biliary ductules within the lesion may contribute to altered hepatocellular transport into the hepatocytes. This manifests as hypointensity relative to normal liver parenchyma in the delayed hepatobiliary phase. It has also been suggested that the altered cellular structure in HA leads to lack of contrast uptake by an abnormal cell membrane transport system (5).
Further, evaluation of expression and localization of hepatic transporters in HA and FNH has demonstrated that parenchymal expression of the uptake transporter organic anion transporting polypeptide 8 (OATP 8) is minimal or absent in HA, while there is strong and diffuse expression in FNH (24). A link between OATP and gadoxetic acid uptake has been established over the past years (25–28). This suggests that different uptake of gadoxetic acid by FNH and adenoma may also be explained, at least in part, by differences in different expression of OATP8 transporter mechanism.
There are some limitations to our study. First, the initial radiological diagnosis of FNH included the use of delayed hepatobiliary phase imaging in addition to conventional imaging in the initial diagnosis of FNH. Based on available regarding the enhancement characteristics of FNH on delayed phase imaging (ie. iso- or hyperintensity relative to adjacent liver), the interpreting radiologists made have a more confident initial diagnosis of FNH when those features were present. For this reasons, [SR2]it is possible that this may have led to the incorrect exclusion of an FNH with hypointensity on delayed hepatobiliary phase imaging. This may have potentially resulted in selection bias with regard to our radiologically diagnosed cases of FNH. Secondly, the relatively small number of adenomas described in this study may not be sufficient to definitively establish the behavior of HA on delayed phase imaging using gadoxetic acid. However, HAs are rare lesions with an incidence of only 0.1–0.13/100,000 in patients not using oral contraceptives and 3.4/100,000 in patients using oral contraceptives (29). This is in contrast to FNH, which is very common liver lesion with an approximate prevalence of 0.9% (30). Therefore, gathering a large study population to examine the imaging characteristics of HA with gadoxetic acid is challenging. Nevertheless, the 6 histologically proven HAs presented in our study would represent the largest published study to date, equaling the total number of HAs imaged with gadoxetic acid and described previously in the literature.
In this study, all imaging was performed using a dose of 0.05mmol/kg of gadoxetic acid. This dose is twice the recommended package insert dose (0.025mmol/kg) which is the approved dose based on data from delayed phase imaging. Recent data suggests that 0.025mmol/kg of gadoxetic acid yields inadequate dynamic phase enhancement compared to 0.1mmol/kg of gadobenate dimeglumine, and that the use of 0.05mmol/kg improves diagnostic accuracy (14–15). Anecdotally, the improved effectiveness of a higher dose has been observed at our institution and therefore we routinely use a weight based dose of 0.05mmol/kg in all patients. This dose is still half the dose of other gadolinium agents and it has two excretion pathways. Therefore possibility of predisposing patients to nephrogenic systemic fibrosis with 0.05 mmol/kg of gadoxetic acid seems unlikely. Also to date no case of NSF has been reported with the use of gadoxetic acid. A recently published paper demonstrates that even using 0.05 mmol/kg of gadoxetic acid provides lower SNR on dynamic contrast enhanced imaging when compared to 0.1 mmol/kg of gadobenate dimeglumine (19). This argues for considering even higher doses of gadoxetic acid for improved dynamic phase imaging.[MOB3] In any circumstance, extension of our results (using 0.05mmol/kg) to the characterization of lesions imaged using other dosing regimens (e.g., 0.025mmol/kg) should be done with caution.
A particular advantage of delayed hepatobiliary phase imaging is that the contrast is in a pseudo-steady-state, i.e., contrast levels in the tissue change very slowly over the scale of a few minutes, unlike dynamic phase imaging. This provides ample opportunity to acquire high spatial resolution images using free-breathing navigator-based methods (18). Limited spatial resolution and motion artifacts related to multiple rapid and successive breath-holds during the dynamic phase may negatively impact the detection and characterization of liver lesions. Delayed hepatobiliary phase imaging therefore provides a unique opportunity for more reliable and higher spatial resolution imaging than during the dynamic phase.
In conclusion, we have described the imaging characteristics of 6 histologically proven HA’s on gadoxetic acid enhanced imaging. This doubles the number of cases reported in the literature to date. We have also described the imaging characteristics of gadoxetic acid enhanced imaging in 34 radiologically diagnosed FNH, two of which also have a histological diagnosis of FNH. Differences in the imaging characteristics of HA and FNH, particularly on delayed hepatobiliary phase images appear to improve the specificity for characterization and differentiation of these two lesions. This is particularly important in lesions that may have atypical or inconclusive imaging characteristics on other imaging sequences. Additional studies are needed to increase the number of reported cases for further confidence in these findings.
ACKNOWLEDGEMENTS
Anonymized
REFERENCES
- 1.Lizardi-Cervera J, Cuellar-Gamboa L, Motola-Kuba D. Focal nodular hyperplasia and hepatic adenoma: a review. Ann Hepatol. 2006;5(3):206–211. [PubMed] [Google Scholar]
- 2.Maillette de Buy Wenniger L, Terpstra V, Beuers U. Focal nodular hyperplasia and hepatic adenoma: epidemiology and pathology. Dig Surg. 2010;27(1):24–31. doi: 10.1159/000268404. [DOI] [PubMed] [Google Scholar]
- 3.Deneve JL, Pawlik TM, Cunningham S, et al. Liver cell adenoma: a multicenter analysis of risk factors for rupture and malignancy. Ann Surg Oncol. 2009;16(3):640–648. doi: 10.1245/s10434-008-0275-6. [DOI] [PubMed] [Google Scholar]
- 4.Farges O, Dokmak S. Malignant transformation of liver adenoma: an analysis of the literature. Dig Surg. 2010;27(1):32–38. doi: 10.1159/000268405. [DOI] [PubMed] [Google Scholar]
- 5.Grazioli L, Morana G, Kirchin MA, Schneider G. Accurate differentiation of focal nodular hyperplasia from hepatic adenoma at gadobenate dimeglumineenhanced MR imaging: prospective study. Radiology. 2005;236(1):166–177. doi: 10.1148/radiol.2361040338. [DOI] [PubMed] [Google Scholar]
- 6.Nguyen BN, Flejou JF, Terris B, Belghiti J, Degott C. Focal nodular hyperplasia of the liver: a comprehensive pathologic study of 305 lesions and recognition of new histologic forms. Am J Surg Pathol. 1999;23(12):1441–1454. doi: 10.1097/00000478-199912000-00001. [DOI] [PubMed] [Google Scholar]
- 7.Grazioli L, Federle MP, Brancatelli G, Ichikawa T, Olivetti L, Blachar A. Hepatic adenomas: imaging and pathologic findings. Radiographics. 2001;21(4):877–892. doi: 10.1148/radiographics.21.4.g01jl04877. discussion 892-874. [DOI] [PubMed] [Google Scholar]
- 8.Morana G, Grazioli L, Kirchin MA, et al. Solid hypervascular liver lesions: accurate identification of true benign lesions on enhanced dynamic and hepatobiliary phase magnetic resonance imaging after gadobenate dimeglumine administration. Invest Radiol. 2011;46(4):225–239. doi: 10.1097/RLI.0b013e3181feee3a. [DOI] [PubMed] [Google Scholar]
- 9.Kirchin MA, Pirovano GP, Spinazzi A. Gadobenate dimeglumine (Gd-BOPTA). An overview. Invest Radiol. 1998;33(11):798–809. doi: 10.1097/00004424-199811000-00003. [DOI] [PubMed] [Google Scholar]
- 10.Hamm B, Staks T, Muhler A, et al. Phase I clinical evaluation of Gd-EOB-DTPA as a hepatobiliary MR contrast agent: safety, pharmacokinetics, and MR imaging. Radiology. 1995;195(3):785–792. doi: 10.1148/radiology.195.3.7754011. [DOI] [PubMed] [Google Scholar]
- 11.Giovanoli O, Heim M, Terracciano L, Bongartz G, Ledermann HP. MRI of hepatic adenomatosis: initial observations with gadoxetic acid contrast agent in three patients. AJR Am J Roentgenol. 2008;190(5):W290–W293. doi: 10.2214/AJR.07.3198. [DOI] [PubMed] [Google Scholar]
- 12.Huppertz A, Haraida S, Kraus A, et al. Enhancement of focal liver lesions at gadoxetic acid-enhanced MR imaging: correlation with histopathologic findings and spiral CT--initial observations. Radiology. 2005;234(2):468–478. doi: 10.1148/radiol.2342040278. [DOI] [PubMed] [Google Scholar]
- 13.Zech CJ, Grazioli L, Breuer J, Reiser MF, Schoenberg SO. Diagnostic performance and description of morphological features of focal nodular hyperplasia in Gd-EOB-DTPA-enhanced liver magnetic resonance imaging: results of a multicenter trial. Invest Radiol. 2008;43(7):504–511. doi: 10.1097/RLI.0b013e3181705cd1. [DOI] [PubMed] [Google Scholar]
- 14.Brismar TB, Dahlstrom N, Edsborg N, Persson A, Smedby O, Albiin N. Liver vessel enhancement by Gd-BOPTA and Gd-EOB-DTPA: a comparison in healthy volunteers. Acta Radiol. 2009;50(7):709–715. doi: 10.1080/02841850903055603. [DOI] [PubMed] [Google Scholar]
- 15.Motosugi U, Ichikawa T, Sano K, et al. Double-Dose Gadoxetic Acid-Enhanced Magnetic Resonance Imaging in Patients With Chronic Liver Disease. Invest Radiol. 2010;46(2):141–145. doi: 10.1097/RLI.0b013e3181f9c487. [DOI] [PubMed] [Google Scholar]
- 16.Feuerlein S, Boll DT, Gupta RT, Ringe KI, Marin D, Merkle EM. Gadoxetate disodium-enhanced hepatic MRI: dose-dependent contrast dynamics of hepatic parenchyma and portal vein. AJR Am J Roentgenol. 2011;196(1):W18–W24. doi: 10.2214/AJR.10.4387. [DOI] [PubMed] [Google Scholar]
- 17.Rofsky NM, Lee VS, Laub G, et al. Abdominal MR imaging with a volumetric interpolated breath-hold examination. Radiology. 1999;212(3):876–884. doi: 10.1148/radiology.212.3.r99se34876. [DOI] [PubMed] [Google Scholar]
- 18.Nagle SN, Busse RF, Brau AC, et al. High-Resolution Free-Breathing 3D T1 Weighted Hepatobiliary Imaging Optimized for Gd-EOB-DTPA. Proceedings of the Intl Soc Magn Reson Med. 2009;17:2076. [Google Scholar]
- 19.Frydrychowicz A, Nagle SN, D'Souza SL, Vigen KK, Reeder SB. Optimized High-Resolution Contrast-Enhanced Hepatobiliary Imaging at 3T: A Cross-over Comparison of Gadobenate Dimeglumine and Gadoxetic Acid. J Magn Reson Imaging. 2011 Jul 12; doi: 10.1002/jmri.22713. [Epub ahead of print] [DOI] [PMC free article] [PubMed] [Google Scholar]
- 20.Flejou JF, Barge J, Menu Y, et al. Liver adenomatosis. An entity distinct from liver adenoma? Gastroenterology. 1985;89(5):1132–1138. [PubMed] [Google Scholar]
- 21.Karam AR, Shankar S, Surapaneni P, Kim YH, Hussain S. Focal nodular hyperplasia: central scar enhancement pattern using Gadoxetate Disodium. J Magn Reson Imaging. 2010;32(2):341–344. doi: 10.1002/jmri.22262. [DOI] [PubMed] [Google Scholar]
- 22.Wanless IR, Mawdsley C, Adams R. On the pathogenesis of focal nodular hyperplasia of the liver. Hepatology. 1985;5(6):1194–1200. doi: 10.1002/hep.1840050622. [DOI] [PubMed] [Google Scholar]
- 23.Bioulac-Sage P, Balabaud C, Bedossa P, et al. Pathological diagnosis of liver cell adenoma and focal nodular hyperplasia: Bordeaux update. J Hepatol. 2007;46(3):521–527. doi: 10.1016/j.jhep.2006.12.007. [DOI] [PubMed] [Google Scholar]
- 24.Vander Borght S, Libbrecht L, Blokzijl H, et al. Diagnostic and pathogenetic implications of the expression of hepatic transporters in focal lesions occurring in normal liver. J Pathol. 2005;207(4):471–482. doi: 10.1002/path.1852. [DOI] [PubMed] [Google Scholar]
- 25.van Montfoort JE, Stieger B, Meijer DK, Weinmann HJ, Meier PJ, Fattinger KE. Hepatic uptake of the magnetic resonance imaging contrast agent gadoxetate by the organic anion transporting polypeptide Oatp1. J Pharmacol Exp Ther. 1999;290(1):153–157. [PubMed] [Google Scholar]
- 26.Filippone A, Blakeborough A, Breuer J, et al. Enhancement of liver parenchyma after injection of hepatocyte-specific MRI contrast media: a comparison of gadoxetic acid and gadobenate dimeglumine. J Magn Reson Imaging. 2010;31(2):356–364. doi: 10.1002/jmri.22054. [DOI] [PubMed] [Google Scholar]
- 27.Kitao A, Zen Y, Matsui O, et al. Hepatocellular carcinoma: signal intensity at gadoxetic acid-enhanced MR Imaging--correlation with molecular transporters and histopathologic features. Radiology. 2010;256(3):817–826. doi: 10.1148/radiol.10092214. [DOI] [PubMed] [Google Scholar]
- 28.Kitao A, Matsui O, Yoneda N, et al. The uptake transporter OATP8 expression decreases during multistep hepatocarcinogenesis: correlation with gadoxetic acid enhanced MR imaging. Eur Radiol. 2011 doi: 10.1007/s00330-011-2165-8. [Epub date 06/01/2001] [DOI] [PubMed] [Google Scholar]
- 29.Hussain SM. Liver MRI: Correlation with Other Imaging Modalities and Histopathology. Heidelberg: Springer Verlag; 2007. pp. 132–133. [Google Scholar]
- 30.Hussain SM. Liver MRI: Correlation with other Imaging Modalities and Histopathology. Heidelberg, Germany: Springer Verlag; 2007. pp. 116–117. [Google Scholar]


