Abstract
The nematode Caenorhabditis elegans is a versatile model organism for biomedical research because of its conservation of disease-related genes and pathways as well as its ease of cultivation. Several C. elegans disease models have been reported, including neurodegenerative disorders such as Parkinson's disease (PD), which involves the degeneration of dopaminergic (DA) neurons 1. Both transgenes and neurotoxic chemicals have been used to induce DA neurodegeneration and consequent movement defects in worms, allowing for investigations into the basis of neurodegeneration and screens for neuroprotective genes and compounds 2,3.
Screens in lower eukaryotes like C. elegans provide an efficient and economical means to identify compounds and genes affecting neuronal signaling. Conventional screens are typically performed manually and scored by visual inspection; consequently, they are time-consuming and prone to human errors. Additionally, most focus on cellular level analysis while ignoring locomotion, which is an especially important parameter for movement disorders.
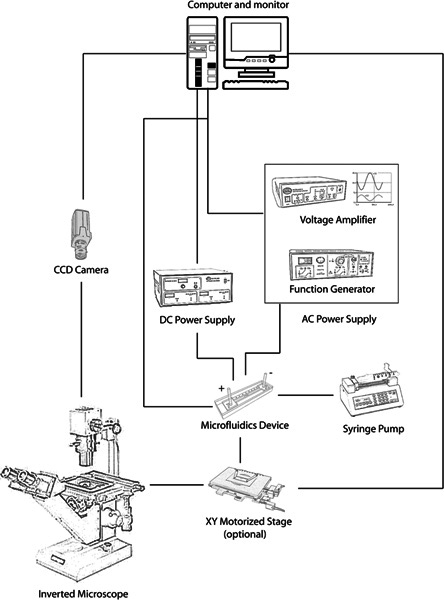
We have developed a novel microfluidic screening system (Figure 1) that controls and quantifies C. elegans' locomotion using electric field stimuli inside microchannels. We have shown that a Direct Current (DC) field can robustly induce on-demand locomotion towards the cathode ("electrotaxis") 4. Reversing the field's polarity causes the worm to quickly reverse its direction as well. We have also shown that defects in dopaminergic and other sensory neurons alter the swimming response 5. Therefore, abnormalities in neuronal signaling can be determined using locomotion as a read-out. The movement response can be accurately quantified using a range of parameters such as swimming speed, body bending frequency and reversal time.
Our work has revealed that the electrotactic response varies with age. Specifically, young adults respond to a lower range of electric fields and move faster compared to larvae 4. These findings led us to design a new microfluidic device to passively sort worms by age and phenotype 6.
We have also tested the response of worms to pulsed DC and Alternating Current (AC) electric fields. Pulsed DC fields of various duty cycles effectively generated electrotaxis in both C. elegans and its cousin C. briggsae 7. In another experiment, symmetrical AC fields with frequencies ranging from 1 Hz to 3 KHz immobilized worms inside the channel 8.
Implementation of the electric field in a microfluidic environment enables rapid and automated execution of the electrotaxis assay. This approach promises to facilitate high-throughput genetic and chemical screens for factors affecting neuronal function and viability.
Keywords: Bioengineering, Issue 75, Behavior, Molecular Biology, Cellular Biology, Neuroscience, Neurobiology, Biophysics, Mechanical Engineering, Microfluidics, Caenorhabditis elegans, C. elegans, Neurotoxicity Syndromes, Drug Toxicity, Neurotoxicity Syndromes, Biological Agents, High-Throughput Screening Assays, Toxicity Tests, Locomotion, Nervous System Diseases, electrotaxis, locomotion, swimming, movement, neurodegeneration, neuronal signaling, dopamine, neurons, animal model
Protocol
1. Photolithography for Master Mold Fabrication
Bathe a 3 in. silicon wafer in acetone for 30 sec and then methanol for 30 sec. Rinse with dH20 water for 5 min.
Dry the wafer's surface with a N2 blow gun. Heat the wafer on a hot plate at 140 °C for 2 min.
Plasma oxidize the surface of the silicon wafer (1 min, 50 W).
Spin-coat the wafer's surface with 3 ml SU-8 100 photoresist (40 sec; 1,750 rpm).
Pre-bake the coated wafer on a hot plate at 65 °C for 10 min, then ramp the temperature up to 95 °C over 2 min. Maintain this setting for an additional 1 hr.
Align a photomask containing the desired channel design. Expose the resist to 550-600 mJ/cm2 of UV light (350-400 nm). Photomasks can be designed in AutoCAD and printed on a transparency with high resolution printing.
Post-bake the wafer on a hot plate at 65 °C for 1 min and 95 °C for 10 min, ramping the temperature as before.
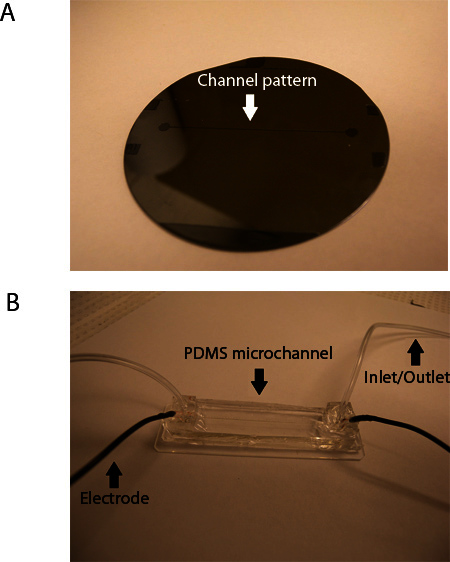
Immerse the wafer in SU-8 developer solution for 10-15 min. Check for completion of development by rinsing with isopropanol. If a white precipitate appears, continue developing. The master mold is shown in Figure 2A.
2. Soft Lithography for Microchannel Fabrication
Mix 35 ml polydimethylsiloxane (PDMS) elastomer base with 3.5 ml PDMS curing agent.
Place the fabricated master mold (pattern facing up) and a blank silicon wafer into Petri dishes lined with aluminum foil.
Pour 20 ml PDMS prepolymer into the master mold dish and 15 ml into the second dish. Eliminate air pockets underneath the wafers by gently pressing on them with a disposable wooden applicator.
Cover both dishes and set aside for a day to cure. Alternatively, for faster curing, remove air bubbles from the PDMS using a vacuum degasifier and then leave the dishes on a hot plate at 80 °C for 2 hr.
Remove the foil and peel the PDMS from the wafers.
Use the Harris Uni-Core (2.5 mm) to punch fluid access ports at both ends of the channel. Cut the channel and blank PDMS into similarly sized strips.
Load the channel, the blank PDMS strip and a glass slide (75×25 mm2) into a plasma oxidizer, likely located in a cleanroom. Expose to oxygen plasma for 40 sec at 40 W power.
Stick the channel piece and glass slide to opposite sides of the blank strip. Set aside for 2 hr to complete the bonding.
Place the assembly onto a hot plate at 120 °C. Attach plastic tubing (inner diameter 1/32", outer diameter 3/32"), each at least 6 in. long, to the punched reservoirs using PDMS prepolymer. Affix a fluidic plastic connector to one or both tubes to allow syringe attachment, or use commercially available fittings.
Allow the PDMS securing the tubing to cure. Insert 3" lengths of 22 gauge insulated copper wire into each reservoir, between the inlet tube and the channel, and secure with PDMS prepolymer. The finished product is shown in Figure 2B.
3. Electrotaxis Experiment
Place the microchannel on the stage (preferably XY-movable) of a microscope with a mounted camera connected to a monitor (Figure 1).
Connect the power supply or amplifier's output wires to the microchannel's electrodes. A simple DC power supply is sufficient if only a DC signal is desired, but an amplifier connected to a function generator allows application of pulsed DC and AC signals as well.
Attach the microchannel's output tube to a disposable syringe. Submerge the mouth of the inlet tube in M9 physiological buffer and gently aspire liquid into the channel by applying a negative pressure inside the syringe (either manually or using a syringe pump). When the inlet and outlet tubes are both filled with M9, disconnect the syringe from the tube. Level both tubes to the same height to prevent hydrostatically driven flow.
Apply a DC voltage to the channel and ensure that resistance (R= V/I) is around 0.6 MΩ (for a 50 mm long, 0.3 mm wide and ~0.1 mm deep microchannel).
If satisfied with the channel's integrity, follow the above steps to load worms from a diluted suspension into the channel.
Disconnect the syringe and hydrostatically manipulate the flow by adjusting the tubes' relative height. Use this method to place a worm in the center of the channel and then lay both tubes flat at the same elevation.
Set the power supply to the appropriate voltage: 4-12 V/cm for L3 stage animals, 4-10 V/cm for L4s, and 2-4 V/cm for young adults. Activate the electric signal and allow 1 min of pre-exposure for the worm to acclimatize to the field. The worm should begin moving towards the cathode. When the minute has passed, use the camera to begin recording.
For AC and pulsed DC experiments, the maximum responsive electric field can be adopted from above and frequency and duty cycle of the signal can be modulated as desired 7, 8.
When experiment is finished, remove all liquid (and worms) from the channel, rinse it with dH20, and leave the device on a hot plate at 125 °C to dry.
Extract locomotory data from recorded videos manually using NIH ImageJ (http://rsbweb.nih.gov/ij/) or custom MATLAB-based worm tracking software.
Representative Results
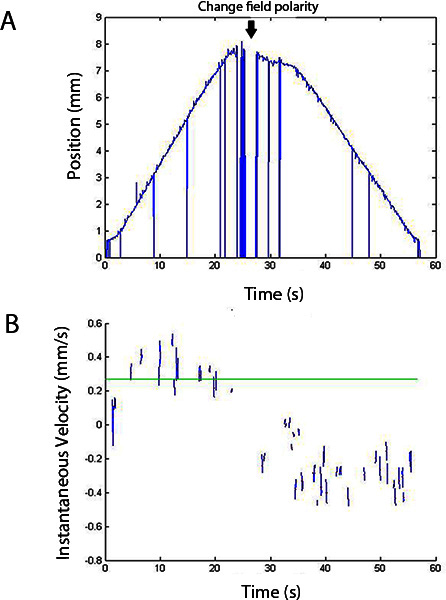
A representative video of a wild-type young adult nematode's electrotaxis and its position and velocity outputs from the worm tracking software are shown in Supplementary Video 1 and Figure 3. The movement analysis software itself does not recognize the direction of field polarity and the time of polarity reversal; rather, this information must be obtained from the source video. This could be done using an audio or visual cue in the video or writing down experimental conditions and manipulations.
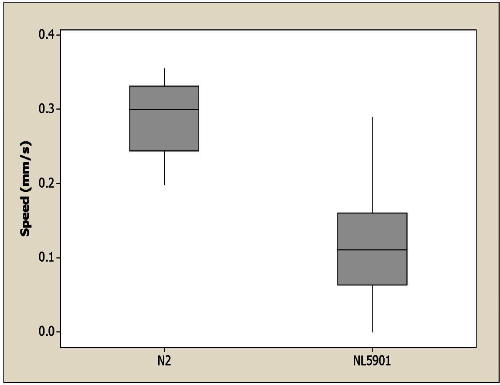
Electrotaxis speed data from a set of wild-type (N2) and transgenic animals (NL5901) are displayed in Figure 4. The NL5901 animals carry human α-synuclein gene under the control of unc-54 (myosin heavy chain gene) promoter. The expressed α-synuclein in body wall muscles aggregates 9 and our results show that it causes abnormalities in the electrotactic response. The speed of NL5901 worms is significantly slower than wild type. To plot the graph, we calculated the speed of individual worms and plotted results in a box plot using Minitab statistical software (http://www.minitab.com). In addition to speed, other parameters of movement, such as turning response (time taken to complete the reversal in response to electric field polarity change) and body bending frequency (average number of sine waves per second), can also be analyzed as described elsewhere 5.
The electrotaxis protocol works best with a synchronized population, which can be obtained via treatment with a bleach solution (sodium hypochlorite and 4 N sodium hydroxide in a 2:3 volume ratio) 10. All data presented here was obtained from synchronized populations to rule out age- and stage-dependent variation. While we have used young adults (69 hr post-L1 at 200C), other stages (L2 onwards) can also be tested.
 Figure 1. Schematic of microfluidic screening platform for nematode electrotaxis assay. Click here to view larger figure.
 Figure 2. Master mold (A) and fully assembled PDMS microchannel device (B).
 Figure 3. Position vs. time (A) and instantaneous velocity (B) outputs of custom worm tracking program. Source video is Supplementary Video 1 below. The program calculates the velocity curve from the position-time curve but disregards the spikes when calculating average speed.
 Figure 4. Electrotaxis speed of wild-type control N2 and transgenic NL5901 worms. NL5901 worms are significantly slower than control with p>0.0001. Significance is determined using the non-parametric Mann-Whitney test. n = 10 for N2 and n = 23 for NL5901.
Supplementary Video 1. Electrotactic behaviour of young adult nematode in a microfluidic channel. Video begins with cathode to the right. Appearance of glass pipette indicates impending polarity reversal; subsequent removal of the pipette signals moment of reversal. Click here to view movie.
Discussion
Taking advantage of the behavioural phenomenon first described by Gabel and colleagues and building on the dielectrophoretic manipulation work of Chuang and colleagues 11,12, our microfluidic-based electrotaxis assay provides an easy, robust and sensitive method to probe neuronal activity in worms using movement as an output. The analysis of movement parameters allows quantitative comparison between different genotypes. The precision of microchannel fabrication and electric field application together provide both a controllable environment and a means to communicate with the worm for locomotion control. Different electric signal wave shapes have different behavioural reflections in the worm and have been used to both stimulate and inhibit locomotion.
The single-channel design of the present microfluidic device requires that only a single worm be scored at a time. For this, worm solution must be sufficiently diluted with M9 buffer before attempting to load worms into the channel. It is important to point out that channel operations can be complicated by the presence of air bubbles and other irregularities affecting the hydrostatic pressure. This could be eliminated by flushing the channel with M9 and manipulating the elevation of the inlet and outlet tubes.
The assay described here can be improved further. A multi-channel microfluidic chip could accelerate worm screening, although it will require integration of other control mechanisms such as worm loading, positioning and tracking. Further automation of the electrotaxis protocol, especially computer-controlled flow management, will increase efficiency. These enhancements are currently under development in our laboratory.
Extraction of locomotion data from electrotaxis videos was originally performed manually using ImageJ, which is a slow and tedious process. To increase efficiency and eliminate human error, we have begun to use a worm tracking program adapted from an original MATLAB-based package developed at California Institute of Technology 13. The software currently processes single-worm videos. The latest version is suitable for a wide range of assays including chemically-treated worms and neuronal and muscle mutants. One of its limitations is that spontaneous reversals, observed in certain neuronal mutants (e.g., osm-5) 5, are not interpreted correctly. Such worms must be analyzed manually.
Limitations notwithstanding, microfluidic electrotaxis can be applied in myriad contexts, including drug discovery assays with worm models of movement-related disorders. Considering its amenability to parallelization, electrotaxis is particularly well suited for high-throughput screening applications. Genetic and age-dependent analysis of electrotactic behaviour and neuronal degeneration may also be studied with this system. Additionally, worms may be sorted by age or phenotype to form synchronized samples or to identify new mutants for forward genetic screens 6,14.
Disclosures
The microfluidic electrotaxis assay technology has been filed for patent in the United States of America and Canada.
Acknowledgments
The authors would like to thank the Natural Sciences and Engineering Research Council of Canada, Canada Research Chairs Program, Canadian Institutes of Health Research, and Ontario Ministry of Research and Innovation through their Early Researchers Award Program for financial support.
References
- Kuwahara T, Koyama A, et al. Familial Parkinson mutant α-synuclein causes dopamine neuron dysfunction in transgenic Caenorhabditis elegans. J. Biol. Chem. 2006;281(1):334–340. doi: 10.1074/jbc.M504860200. [DOI] [PubMed] [Google Scholar]
- Kuwahara T, Koyama A, et al. A systematic RNAi screen reveals involvement of endocytic pathway in neuronal dysfunction in a-synuclein transgenic. 2008;17(19):2997–3009. doi: 10.1093/hmg/ddn198. [DOI] [PubMed] [Google Scholar]
- Su LJ, Auluck PK, et al. Compounds from an unbiased chemical screen reverse both ER-to-Golgi trafficking defects and mitochondrial dysfunction in Parkinson's disease models. Dis. Model Mech. 2010;3(3-4):194–208. doi: 10.1242/dmm.004267. [DOI] [PMC free article] [PubMed] [Google Scholar]
- Rezai P, Siddiqui A, Selvaganapathy PR, Gupta BP. Electrotaxis of Caenorhabditis elegans in a microfluidic environment. Lab Chip. 2010;10(2):220–226. doi: 10.1039/b917486a. [DOI] [PubMed] [Google Scholar]
- Salam S, Ansari A, et al. A microfluidics set up to study neuronal degeneration and identification of neuroprotective compounds in C. elegans. 2013. Submitted.
- Rezai P, Salam S, Selvaganapathy PR, Gupta BP. Electrical sorting of Caenorhabditis elegans. Lab Chip. 2012;12(10):1831–1840. doi: 10.1039/c2lc20967e. [DOI] [PubMed] [Google Scholar]
- Rezai P, Salam S, Selvaganapathy PR, Gupta BP. Effect of pulse direct current signals on electrotactic movement of nematodes Caenorhabditis elegans and Caenorhabditis briggsae. Biomicrofluidics. 2011;5(4):044116. doi: 10.1063/1.3665224. [DOI] [PMC free article] [PubMed] [Google Scholar]
- Rezai P, Siddiqui A, Selvaganapathy PR, Gupta BP. Behavior of Caenorhabditis elegans in alternating electric field and its application to their localization and control. Appl. Phys. Lett. 2010;96(15):153702. [Google Scholar]
- van Ham TJ, Thijssen KL, Breitling R, Hofstra RM, Plasterk RH, Nollen EA. C. elegans model identifies genetic modifiers of alpha-synuclein inclusion formation during aging. PLoS Genet. 2008;4:e1000027. doi: 10.1371/journal.pgen.1000027. [DOI] [PMC free article] [PubMed] [Google Scholar]
- Brenner S. The genetics of Caenorhabditis elegans. Genetics. 1974;77(1):71–94. doi: 10.1093/genetics/77.1.71. [DOI] [PMC free article] [PubMed] [Google Scholar]
- Gabel CV, Gabel H, Pavlichin D, Kao A, Clark DA, Samuel AD. Neural circuits mediate electrosensory behavior in Caenorhabditis elegans. J. Neurosci. 2007;27(28):7586–7596. doi: 10.1523/JNEUROSCI.0775-07.2007. [DOI] [PMC free article] [PubMed] [Google Scholar]
- Chuang H-S, Raizen DM, Lamb A, Dabbish N, Bau HH. Dielectrophoresis of Caenorhabditis elegans. Lab Chip. 2011;11(4):599–604. doi: 10.1039/c0lc00532k. [DOI] [PMC free article] [PubMed] [Google Scholar]
- Cronin CJ, Mendel JE, Mukhtar S, Kim Y-M, Stirbl RC, Bruck J, Sternberg PW. An automated system for measuring parameters of nematode sinusoidal movement. BMC Genet. 2005;6:5. doi: 10.1186/1471-2156-6-5. [DOI] [PMC free article] [PubMed] [Google Scholar]
- Manière X, Lebois F, Matic I, Ladoux B, Meglio J-MDi, Hersen P. Running worms: C. elegans self-sorting by electrotaxis. PLoS One. 2011;6(2):e16637. doi: 10.1371/journal.pone.0016637. [DOI] [PMC free article] [PubMed] [Google Scholar]


