

Abstract
We report the performance of capillary zone electrophoresis coupled with an electrokinetically pumped electrospray interface and an Orbitrap-Velos mass spectrometer for high sensitivity protein analysis. We first investigated the system for quantitation of the tryptic digest of bovine serum albumin (BSA). The system produced outstanding linearity with respect to peak height, number of peptide IDs, and spectral counts across the range of 12 nM to 750 nM (60 amol to 3.5 fmol) of BSA injected. One peptide produced a detection limit of 0.3 nM (1.5 amol) injected. We also analyzed 700 pg of a tryptic digest prepared from a RAW264.7 cell lysate; 10 proteins were identified in triplicate analyses after filtering the data with peptide confidence value as high. This sample size corresponds to the protein content of ~10 eukaryotic cells.
Keywords: Electrokinetically driven sheath flow interface, CZE-ESI-MS/MS, Protein digests
1. Introduction
Capillary zone electrophoresis (CZE) provides rapid and efficient separations of biological molecules [1–3]. CZE-electrospray ionization-tandem mass spectrometry (CZE-ESI-MS/MS) is an interesting tool for protein analysis [4]. Its advantages include shorter analysis time and much lower sample and solvent consumption compared with widely used reversed phase liquid chromatography (RPLC)-ESI-MS/MS.
The performance of CSE-MS is dominated by the electrospray interface. The interfaces can be divided into sheath-flow and sheathless designs [4]. Sheath-flow interfaces use a sheath fluid that mixes with the electrophoretic stream at the exit of the separation capillary [5–14]. The sheath liquid helps stabilize the electrospray, provides electrical contact with the distal end of the separation capillary, and allows dilution of the separation buffer to make it more compatible with ESI detection [14]. However, a typical sheath flow rate is 1~2 μL/min, which is much higher than the electro-osmotic flow in the separation capillary. This high flow rate produces significant sample dilution and loss of sensitivity.
Sheathless interfaces do not employ a sheath liquid, which eliminates sample dilution and can produce higher sensitivity [15]. Establishment of the electrical contact at the distal end of the separation capillary is the main challenge in sheathless interfaces. In one approach, the distal tip of the separation capillary is etched to a few micrometer thickness with hydrofluoric acid, which results in sufficient electrical conductivity contact to generate the electrospray [16–18]. The sheathless interfaces suffer from several disadvantages [19]. Most critically, the separation buffer must also support electrospray, which limits the composition of separation buffers.
Recently, our group reported a sheath-flow electrospray interface where the sheath fluid is pumped by electrokinetic forces [20]. The electrokinetically pumped interface has several advantages, including reduced sample dilution due to a very low flow rate of sheath liquid, elimination of mechanical pumps, use of a wide range of separation buffers, and stable operation in the nanospray regime. We have demonstrated the interface in a two-dimensional CZE-ESI-MS system for protein separation, online digestion, and peptide separation and identification [21]. We also used the interface with an LTQ-Orbitrap Velos instrument for analysis of standard protein digests [19]. Finally, we have used the interface for the first example of CZE-MS analysis of a proteome, the secretome of M. marinum, a model of tuberculosis [22].
We extend our earlier work by evaluating the CZE-ESI-MS/MS system for quantitative analysis of a tryptic digest of bovine serum albumin. We also evaluated the potential of the system for trace proteomics by analysis of a highly dilute RAW 264.7 cell lysate digest.
2 Materials and methods
2.1 Chemicals and reagents
Bovine pancreas TPCK-treated trypsin, bovine serum albumin (BSA), equine myoglobin, urea, ammonium bicarbonate (NH4HCO3), dithiothreitol (DTT), and iodoacetamide (IAA) were purchased from Sigma–Aldrich (St. Louis, MO, USA). Acetonitrile (ACN) and formic acid (FA) were purchased from Fisher Scientific (Pittsburgh, PA, USA). Methanol was purchased from Honeywell Burdick & Jackson (Wicklow, IE, USA). Water was deionized by a Nano Pure system from Thermo scientific (Marietta, OH, USA). Fused capillaries (50 μm i.d. × 150 μm o.d.) were purchased from Polymicro Technologies (Phoenix, AZ, USA). ZipTip C18 (ZTC18S096) was purchased from Millipore (Bedford, MA, USA).
Dulbecco’s Modified Eagle’s Medium (DMEM) with L-glutamine and fetal bovine serum (FBS) were purchased from ATCC (Manassas, VA, USA). Mammalian Cell-PE LBTM Buffer for cell lysis was purchased from G-Biosciences (St. Louis, MO, USA). Complete, mini protease inhibitor cocktail (provided in EASYpacks) was purchased from Roche (Indianapolis, IN, USA).
2.2 Sample preparation
Bovine serum albumin (BSA, 1 mg/mL) dissolved in 100 mM NH4HCO3 (pH 8.0) was denatured at 90 °C for 15 min, followed by standard reduction and alkylation with DTT and IAA. The resulting protein solution was diluted to 0.5 mg/mL with 100 mM NH4HCO3. A 20-μL aliquot of 0.5 mg/mL BSA was digested with 200 μg of trypsin immobilized on magnetic microspheres prepared using the method of reference [23] at room temperature for 1 min under rotation. The digest was collected for CZE-ESI-MS/MS and nanoLC-ESI-MS/MS analysis.
Myoglobin (5 mg/mL) dissolved in 8 M urea and 100 mM NH4HCO3 (pH 8.0) was denatured at 52 °C for 1 h, followed by standard reduction and alkylation with DTT and IAA. The resulting protein solution was diluted with 100 mM NH4HCO3 to 0.1 mg/mL with urea concentration at ~0.16 M. A 20-μL aliquot of 0.1 mg/mL myoglobin was also digested with 200 μg magnetic microspheres based immobilized trypsin [23] at room temperature for 1 min under rotation. The digest was collected, desalted with ZipTip C18 and dried, followed by CZE-ESI-MS/MS analysis.
The procedure for RAW 264.7 cell lysate preparation was same as in reference [23]. RAW 264.7 cells were cultured in a T25 flask at 37 °C and 5% CO2 in DMEM with L-glutamine and 10% FBS. After washing with cold PBS buffer twice, 1 mL mammalian cell-PE LB™ buffer (pH 7.5) supplemented with complete protease inhibitor was added to the flask, and the flask was shaken gently for 10 min on ice. The cell lysate was transferred to a 1.5 mL Eppendorf tube and incubated on ice for 15 min. Subsequently, the cell lysate was centrifuged at 18,000 g for 15 min, and the supernatant was collected for measurement of protein concentration with the BCA method. After that, 300 μL cell lysate (~54 μg proteins) was denatured at 90 °C for 20 min, followed by reduction with DTT (3.3 mM) at 65 for 1 h and alkylation with IAA (8.3 mM) at room temperature for 30 min in dark. Then, 1.2 mL cold acetone was added to the protein solution and incubated at −20 °C for 12 h, followed by centrifugation at 18,000 g for 15 min. The protein pellet was washed with cold acetone again, and dried at room temperature. Finally, the protein pellet was redissolved in 100 μL 1 M urea and 100 mM NH4HCO3 buffer (pH 8.0). A 40-μL protein aliquot was digested with 400 μg magnetic microspheres based immobilized trypsin [23] at room temperature for 10 min under rotation. A 10-μL aliquot of protein digests was desalted with ZipTip C18 and dried, followed by CZE-ESI-MS/MS analysis.
2.3 CZE-ESI-MS/MS analysis
The CZE-ESI-MS/MS system was assembled from components as reported previously [19–22], Fig. 1. High voltage was supplied by two Spellman CZE 1000R power supplies. The separation capillary was coupled to an LTQ-Orbitrap Velos instrument (Thermo Fisher Scientific) with an electrokinetically driven sheath-flow electrospray interface [20]. The emitter was pulled in a Sutter pipette puller to an ~8 μm ID. Voltage programming was controlled by LabView software.
Figure 1.
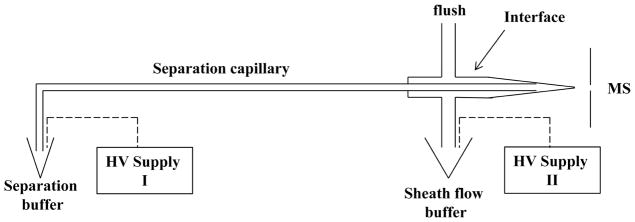
Schematic diagram of the CZE-ESI-MS/MS system. The sheath liquid is pumped by electrokinetic flow driven by HV supply II. The separation is driven by the potential difference between the inlet (HV supply I) and outlet (HV supply II) of the separation capillary.
Protein digests were dissolved in 10 mM NH4HCO3 (pH 8.0), and injected onto the separation capillary (50 μm i.d. × 150 μm o.d., 30 cm) at 5 kV for 2 s. For CZE separation, 8.2 kV was applied at the injection end of the 30 cm separation capillary and 1.2 kV was applied at the electrospray interface. The separation buffer was 10 mM NH4HCO3 (pH 8.0), and the sheath liquid was 50% (v/v) methanol and 0.05% (v/v) FA.
For ESI-MS/MS analysis, the ion transfer tube temperature was 300 °C, and the mass spectrometer was programmed in a data dependent mode. Full MS scans were acquired in the Orbitrap mass analyzer over 395–1900 m/z range with resolution 60,000. The ten most intense peaks were selected for sequencing and fragmented in the ion trap with normalized collision energy of 35%, activation q = 0.25, activation time of 20 ms, and one microscan. For all sequencing events, dynamic exclusion was turned off.
2.4 NanoLC-ESI-MS/MS analysis
A nanoACQUITY UltraPerformance LC® (UPLC®) system (Waters) was use for separation of the protein digests. Buffer A (0.1% FA in water) and buffer B (0.1% FA in ACN) were used as mobile phases for gradient separation. Protein digest dissolved in 0.1% FA was automatically loaded onto a C18 reversed phase column (75 μm×80 mm) packed with 2.6 μm particle (Kinetex, 100 Å, Phenomenex) with 2% buffer B for 15 min at a flow rate of 0.5 μL/min, followed by 3-step gradient separation, 2 min from 2% B to 10% B, 17 min to 40% B, 1 min to 85% B, and maintained for 10 min. The column was equilibrated for 14 min with 2% buffer B prior to the next analysis. The eluted peptides from the C18 column were pumped through a manually pulled capillary tip for electrospray, and analyzed by LTQ-Orbitrap Velos instrument. The electrospray voltage was 2.0 kV, and other parameters were same as CZE-ESI-MS/MS. Protein digest was analyzed in triplicates and injection volume was 1 μL for each run.
2.5 Data analysis
Database searching of raw files was performed in Proteome Discoverer 1.2 with the SEQUEST search engine against ipi.bovin.v3.68.fasta (for BSA), equine.fasta (for myoglobin), and ipi.mouse.v3.85.fasta (for RAW 264.7 cell lysate). Database searching against the corresponding decoy database was also performed to evaluate the false discovery rate (FDR) of peptide identification. The database searching parameters included up to two missed cleavages allowed for full tryptic digestion, precursor mass tolerance 50 ppm, fragment mass tolerance 1.0 Da, cysteine carbamidomethylation as a fixed modification, and oxidation of methionine as variable modification. For myoglobin, acetylation of lysine was also set as variable modification. The database searching results were filtered with the peptide confidence value as high. Mass spectra were imported into Matlab for further analysis.
3 Results and Discussion
3.1 Quantitative analysis using the CZE-ESI-MS/MS system
There have been a number of approaches used to estimate protein abundance in mass spectrometry analysis, including the peak height of the parent ion, number of peptide IDs, spectral counts, and coverage. We used the CZE-ESI-MS/MS system to analyte in triplicate a BSA digest that was diluted to 12 nM, 25 nM, 75 nM, 150 nM, 370 nM, and 750 nM (850 ng/mL to 50 μg/mL; injection amount ranged from 60 amole to 3.5 fmole).
One peptide (LKEccDKPLLEK) was identified by MS/MS across the concentration range, S-Fig 1. The peptide’s MS peak height was used to generate a calibration curve, Fig 2A. The calibration curve was linear across the concentration range of 12 nM to 750 nM ( , d.f. = 4). The relative standard deviation in peak height was less than 20% for all concentration samples, Table 1. The lowest concentration sample (12 nM; 60 amol of BSA digest injected) generated an 8% relative standard deviation in peak height. The detection limit (3 σ) was estimated using the relative standard deviation in the first 100 data points of the lowest concentration sample as noise and the peak height estimated from fitting a Gaussian function as signal; the concentration detection limit was 20 ng/mL and the mass detection limit was 1.5 amol. This detection limit is slightly superior to a value we reported for a slightly more complex sample [19].
Figure 2.
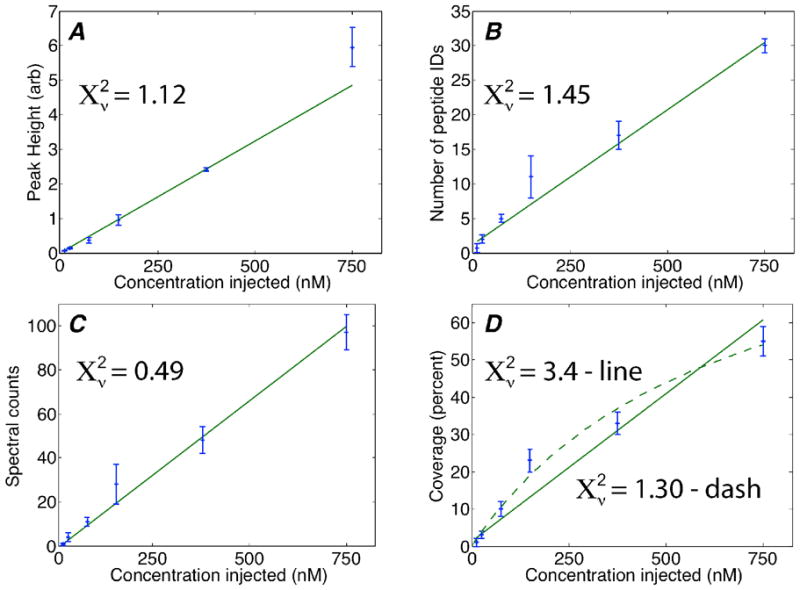
Calibration curves based on Peak Height (Fig 2A), Number of Peptide IDs (Fig 2B), Spectral Counts (Fig 2C), and Sequence Coverage (Fig 2D), versus the concentration of a BSA tryptic digest taken for analysis by CZE-ESI-MS/MS. In each case, the line is the weighted least squares fit to a straight line. For Fig 2D, the dashed curve is a fit using a saturation equation. Error bars are the standard deviation of the mean of triplicate measurements.
Table 1.
Intensity of the peptide (LKEccDKPLLEK, +2, m/z 766.8929) identified from different injection amount of BSA digest after analyzed by CZE-ESI-MS/MS in triplicates.
| Injection amount | Run1 | Run2 | Run3 | Average | Standard deviation | RSD (%) |
|---|---|---|---|---|---|---|
| 750 nM (3500 amol) | 6.36 × 10⁵ | 6.20 × 10⁵ | 5.30 × 10⁵ | 5.95 × 10⁵ | 5.7 × 10⁴ | 10 |
| 370 nM (1700 amol) | 2.35 × 10⁵ | 2.46 × 10⁵ | 2.41 × 10⁵ | 2.41 × 10⁵ | 5.5 × 10³ | 2 |
| 150 nM (700 amol) | 9.75 × 10⁴ | 1.10 × 10⁴ | 8.02 × 10⁴ | 9.59 × 10⁴ | 1.5 × 10⁴ | 15 |
| 75 nM (350 amol) | 3.85 × 10⁴ | 2.92E+04 | 4.37 × 10⁴ | 3.71E+04 | 7.3 × 10³ | 20 |
| 25 nM (120 amol) | 1.40 × 10⁴ | 1.57 × 10³ | 1.28 × 10⁴ | 1.42E+04 | 1.5 × 10³ | 10 |
| 12 nM (60 amol) | 6.28 × 10³ | 6.49 × 10³ | 7.25 × 10³ | 6.67 × 10³ | 5.1 × 10² | 8 |
Three other calibration curves were generated based on the number of peptide IDs, the sequence coverage, and the protein spectral count, Fig 2b–d and S-Table 1. In each case, the calibration curve was linear (Number of Peptide IDs ; Coverage ; Spectral counts . In all cases, d.f. = 4). We also fit the a Coverage data to a saturation curve ( ); this fit is shown as the dashed curve in Fig. 2D with , which suggests that the saturation model better describes the Coverage data than a simple linear relationship.
The relative standard deviation in the peptide number, sequence coverage, and spectral counts was poor (>30%) for the two lowest concentration samples (12 nM and 25 nM). Precision improved dramatically for the higher concentration samples (370 nM and 750 nM), where the RSD was ~10%.
We also determined linearity of peak height for three other BSA peptides, S-Fig 2. Excellent linearity was obtained for all 4 peptides ( ) for digest concentrations from 12 nM to 370 nM (60 amol to 1.7 fmol injected). Similar results were obtained for a myoglobin digest, S-Fig 3.
3.2 Migration time precision
Another important parameter, peptide migration time, was also used to evaluate the system. Fig 3 presents the extracted spectra of one peptide (LKEccDKPLLEK, +2, m/z 766.8929) identified from 750 nM (3,600 amole) (A) and 12 nM (60 amole) (B) BSA digest after triplicate analysis by CZE-ESI-MS/MS. A nonlinear regression analysis was used to fit a Gaussian function to the peaks. The mean migration time was 208.0 ± 2.4 sec for Fig 3A and 213.8 ± 1.2 for Fig 3B. The uncertainty in migration time was dominated by the peak width (2.4 ± 0.1 s for Fig 3A and 2.2 ± 0.1 s for Fig 3B).
Figure 3.
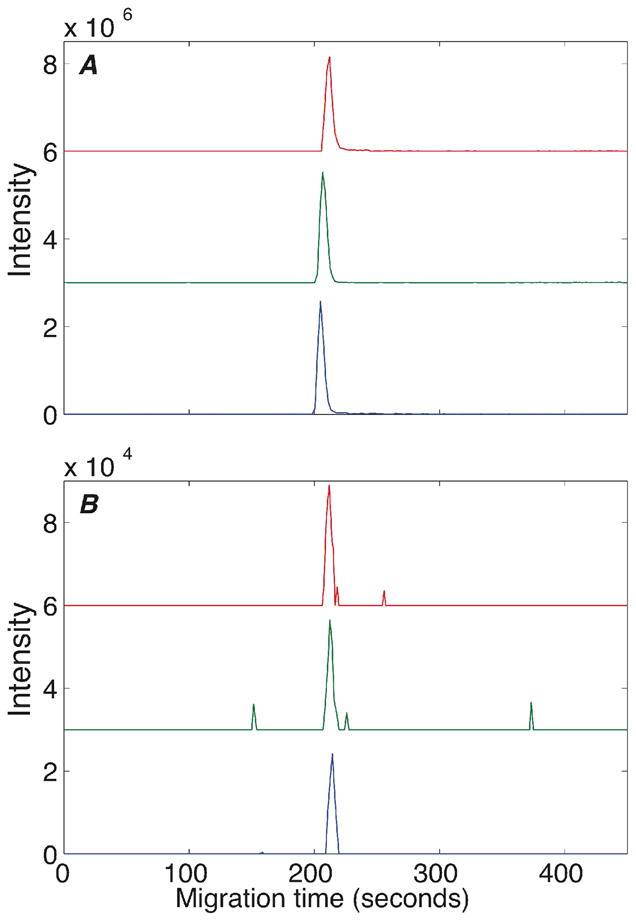
Triplicate extracted ion electropherograms of a peptide (LKEccDKPLLEK, +2, m/z 766.8733 766.9170) identified from 3,500 amole (A) and 60 amole (B).
3.3 MS/MS identification limit of BSA digest
We also investigated the linearity of the peak height of two fragment ions (y6+ and b6+) generated from the peptide (LKEccDKPLLEK, +2, m/z 766.8929), Fig 4. We observed reasonable linearity between the injection amount of BSA digest and intensity of the two fragment ions for sample concentrations from 12 nM to 370 nM (60 amol to 1.7 fmol injected). These results indicate that both peptide intensity and fragment ion intensity can be used as parameters for relative protein quantitation with the CZE-ESI-MS/MS system.
Figure 4.

Relationship between injection amounts of BSA digest and intensity of two fragment ions (y6+ and b6+) from the peptide (LKEccDKPLLEK, +2, m/z 766.8929). Error bars are ± 1 standard deviation of the mean.
The peptide’s MS/MS spectrum is shown in S-Fig 4. Almost all of the high intensity peaks in the tandem spectrum have good matches with b or y ions of the peptide. The identification limit of the BSA digest with the CZE-ESI-MS/MS system is 12 nM or better (60 amol injected).
We also compared the MS/MS identification limits of CZE-ESI-MS/MS to nanoLC-ESI-MS/MS for BSA digest analysis, S-Figure 5. For same injection amount (60 amole to 3.5 fmol BSA digest), CZE-ESI-MS/MS could produce more peptides and higher spectral count than nanoLC-ESI-MS/MS, S-Figure 5A. This might be due to ~200 times lower injection volume of CZE-ESI-MS/MS than nanoLC-ESI-MS/MS (5 nLvs.1 μL), leading to higher sample concentration. However, for the same concentration of BSA digest (12 nM-750 nM), more peptides and higher spectral count could be obtained by nanoLC-ESI-MS/MS system due to ~200 times larger injection volume (1 μL vs.5 nL), S-Figure 5B. Interestingly, although evident higher spectral count was obtained by nanoLC-ESI-MS/MS than CZE-ESI-MS/MS for 0.05 mg/mL BSA digest, comparable peptide IDs were identified, which might be because dynamic exclusion was turned off for the experiments. Results demonstrate that CZE-ESI-MS/MS can generate better identifications than nanoLC-ESI-MS/MS for the same injection amount of BSA digest (from 60 amol to 3.5 fmol), but the concentration identification limit of CZE-ESI-MS/MS is still limited due to lower injection volume than nanoLC-ESI-MS/MS.
Figure 5.

Extracted ion electropherograms of peptides identified from triplicate 700 pg injections of RAW 264.7 cell lysate digests. Peptides with confidence value as high were considered to be positive hits, and their extraction ion electropherograms are presented in the figure.
3.4 Analysis of trace RAW 264.7 cell lysate digests
RAW 264.7 cell lysate digests were dissolved in 10 mM NH4HCO3 (pH 8.0) with 0.15 mg/mL, followed by triplicate CZE-ESI-MS/MS. The injection amount for each run was ~700 pg, which is roughly the protein content of ten somatic cells [24]. Ten proteins were identified from triplicates analysis after SEQUEST database searching with peptide confidence value as high. Six proteins were identified after filtered with peptide confidence value as high and peptide mass tolerance less than 10 ppm. Figure 5 shows the extracted ion spectra of eight peptides.
4. Conclusions
We have demonstrated that CZE-ESI-MS/MS with an electrokinetically-pumped electrospray interface allows MS/MS identification of a handful of proteins from subnanogram amounts of a tryptic cell lysate digest. The amount of protein taken for analysis is roughly equal to the protein content of ten typical somatic cells [24]. An order of magnitude improved sensitivity will allow the analysis of the protein content of a single cell, which will have intriguing applications in a number of fields, including cancer prognosis [25].
A number of technical hurdles must be addressed to enable single cell proteomics by use of CZE-ESI-MS/MS. These include improved sensitivity, the injection and lysis of a single cell, and on-column digestion. The use of accurate mass tags or multiple reaction monitoring should provide an order of magnitude improved sensitivity [26–27]. Single cell injection and lysis have been addressed for single cell protein analysis by laser-induced fluorescence [25, 28], and on-column protein digestion has been demonstrated with both monolithic and magnetic-bead reactors [21, 29–30]. The combination of these technologies has the potential to provide exciting opportunities in high sensitivity protein analysis.
Acknowledgments
We thank Dr. William Boggess in the Notre Dame Mass Spectrometry and Proteomics Facility for his help with this project. This project was supported by a grant from the National Institutes of Health (R01GM096767).
References
- 1.Krylov SN, Dovichi NJ. Capillary electrophoresis for the analysis of biopolymers. Anal Chem. 2000;72:111R–128R. doi: 10.1021/a1000014c. [DOI] [PubMed] [Google Scholar]
- 2.Geiger M, Hogerton AL, Bowser MT. Capillary electrophoresis. Anal Chem. 2012;84:577–596. doi: 10.1021/ac203205a. [DOI] [PubMed] [Google Scholar]
- 3.Jorgenson JW, Lukacs KD. Capillary zone electrophoresis. Science. 1983;222:266–272. doi: 10.1126/science.6623076. [DOI] [PubMed] [Google Scholar]
- 4.Maxwell EJ, Chen DD. Twenty years of interface development for capillary electrophoresis-electrospray ionization-mass spectrometry. Anal Chim Acta. 2008;627:25–33. doi: 10.1016/j.aca.2008.06.034. [DOI] [PubMed] [Google Scholar]
- 5.Chen YR, Tseng MC, Her GR. Design and performance of a low-flow capillary electrophoresis-electrospray-mass spectrometry interface using an emitter with dual beveled edge. Electrophoresis. 2005;26:1376–1382. doi: 10.1002/elps.200410159. [DOI] [PubMed] [Google Scholar]
- 6.Liu CC, Zhang J, Dovichi NJ. A sheath-flow nanospray interface for capillary electrophoresis/mass spectrometry. Rapid Commun Mass Spectrom. 2005;19:187–192. doi: 10.1002/rcm.1769. [DOI] [PubMed] [Google Scholar]
- 7.Tseng MC, Chen YR, Her GR. A low-makeup beveled tip capillary electrophoresis/electrospray ionization mass spectrometry interface for micellar electrokinetic chromatography and nonvolatile buffer capillary electrophoresis. Anal Chem. 2004;76:6306–6312. doi: 10.1021/ac049330i. [DOI] [PubMed] [Google Scholar]
- 8.Yang Y, Boysen RI, Hearn MT. Optimization of field-amplified sample injection for analysis of peptides by capillary electrophoresis-mass spectrometry. Anal Chem. 2006;78:4752–4758. doi: 10.1021/ac051735v. [DOI] [PubMed] [Google Scholar]
- 9.Lewis KC, Opiteck GJ, Jorgenson JW, Sheeley DM. Comprehensive online RPLC-CZE-MS of peptides. J Am Soc Mass Spectrom. 1997;8:495–500. [Google Scholar]
- 10.Su S, Yu Y. Online preconcentration of recombinant Arg-Gly-Asp-hirudin using dynamic pH junction for analysis in human urine samples by capillary electrophoresis-mass spectrometry. J Chromatogr A. 2009;1216:1490–1495. doi: 10.1016/j.chroma.2008.12.050. [DOI] [PubMed] [Google Scholar]
- 11.Good DM, Zürbig P, Argilés A, Bauer HW, et al. Naturally occurring human urinary peptides for use in diagnosis of chronic kidney disease. Mol Cell Proteomics. 2010;9:2424–2437. doi: 10.1074/mcp.M110.001917. [DOI] [PMC free article] [PubMed] [Google Scholar]
- 12.Zhong X, Maxwell EJ, Ratnayake C, Mack S, Chen DD. Flow-through microvial facilitating interface of capillary isoelectric focusing and electrospray ionization mass spectrometry. Anal Chem. 2011;83:8748–8755. doi: 10.1021/ac202130f. [DOI] [PubMed] [Google Scholar]
- 13.Smith RD, Barinaga CJ, Udseth HR. Improved electrospray ionization interface for capillary zone electrophoresis - mass-spectrometry. Anal Chem. 1988;60:1948–1952. [Google Scholar]
- 14.Maxwell EJ, Zhong X, Zhang H, van Zeijl N, Chen DD. Decoupling CZE and ESI for a more robust interface with MS. Electrophoresis. 2010;31:1130–1137. doi: 10.1002/elps.200900517. [DOI] [PubMed] [Google Scholar]
- 15.Kelly JF, Ramaley L, Thibault P. Capillary zone electrophoresis-electrospray mass spectrometry at submicroliter flow rates: Practical considerations and analytical performance. Anal Chem. 1997;69:51–60. [Google Scholar]
- 16.Moini M. Simplifying CE-MS operation. 2. Interfacing low-flow separation techniques to mass spectrometry using a porous tip. Anal Chem. 2007;79:4241–4246. doi: 10.1021/ac0704560. [DOI] [PubMed] [Google Scholar]
- 17.Haselberg R, Ratnayake CK, de Jong GJ, Somsen GW. Performance of a sheathless porous tip sprayer for capillary electrophoresis-electrospray ionization-mass spectrometry of intact proteins. J Chromatogr A. 2010;1217:7605–7611. doi: 10.1016/j.chroma.2010.10.006. [DOI] [PubMed] [Google Scholar]
- 18.Faserl K, Sarg B, Kremser L, Lindner H. Optimization and evaluation of a sheathless capillary electrophoresis-electrospray ionization mass spectrometry platform for peptide analysis: comparison to liquid chromatography-electrospray ionization mass spectrometry. Anal Chem. 2011;83:7297–7305. doi: 10.1021/ac2010372. [DOI] [PubMed] [Google Scholar]
- 19.Wojcik R, Li Y, Maccoss MJ, Dovichi NJ. Capillary electrophoresis with Orbitrap-Velos mass spectrometry detection. Talanta. 2012;88:324–329. doi: 10.1016/j.talanta.2011.10.048. [DOI] [PMC free article] [PubMed] [Google Scholar]
- 20.Wojcik R, Dada OO, Sadilek M, Dovichi NJ. Simplified capillary electrophoresis nanospray sheath-flow interface for high efficiency and sensitive peptide analysis. Rapid Commun Mass Spectrom. 2010;24:2554–2560. doi: 10.1002/rcm.4672. [DOI] [PubMed] [Google Scholar]
- 21.Li Y, Wojcik R, Dovichi NJ. A replaceable microreactor for on-line protein digestion in a two-dimensional capillary electrophoresis system with tandem mass spectrometry detection. J Chromatogr A. 2011;1218:2007–2011. doi: 10.1016/j.chroma.2010.10.013. [DOI] [PMC free article] [PubMed] [Google Scholar]
- 22.Li Y, Champion MM, Sun L, Champion PA, Wojcik R, Dovichi NJ. Capillary zone electrophoresis-electrospray ionization-tandem mass spectrometry as an alternative proteomics platform to ultraperformance liquid chromatography-electrospray ionization-tandem mass spectrometry for samples of intermediate complexity. Anal Chem. 2012;84:1617–1622. doi: 10.1021/ac202899p. [DOI] [PMC free article] [PubMed] [Google Scholar]
- 23.Sun L, Li Y, Yang P, Zhu G, Dovichi NJ. High efficiency and quantitatively reproducible protein digestion by trypsin-immobilized magnetic microspheres. J Chromatogr A. 2012;1220:68–74. doi: 10.1016/j.chroma.2011.11.050. [DOI] [PMC free article] [PubMed] [Google Scholar]
- 24.Cohen D, Dickerson JA, Whitmore CD, Turner EH, Palcic MM, Hindsgaul O, Dovichi NJ. Chemical cytometry: fluorescence-based single-cell analysis. Annu Rev Anal Chem (Palo Alto Calif) 2008;1:165–190. doi: 10.1146/annurev.anchem.1.031207.113104. [DOI] [PubMed] [Google Scholar]
- 25.Hu S, Le Z, Krylov S, Dovichi NJ. Cell cycle-dependent protein fingerprint from a single cancer cell: image cytometry coupled with single-cell capillary sieving electrophoresis. Anal Chem. 2003;75:3495–3501. doi: 10.1021/ac034153r. [DOI] [PubMed] [Google Scholar]
- 26.Smith RD, Anderson GA, Lipton MS, Pasa-Tolic L, Shen Y, Conrads TP, Veenstra TD, Udseth HR. An accurate mass tag strategy for quantitative and high-throughput proteome measurements. Proteomics. 2002;2:513–523. doi: 10.1002/1615-9861(200205)2:5<513::AID-PROT513>3.0.CO;2-W. [DOI] [PubMed] [Google Scholar]
- 27.Gerber SA, Rush J, Stemman O, Kirschner MW, Gygi SP. Absolute quantification of proteins and phosphoproteins from cell lysates by tandem MS. Proc Natl Acad Sci US A. 2003;100:6940–6945. doi: 10.1073/pnas.0832254100. [DOI] [PMC free article] [PubMed] [Google Scholar]
- 28.Krylov SN, Zhang Z, Chan NW, Arriaga E, Palcic MM, Dovichi NJ. Correlating cell cycle with metabolism in single cells: combination of image and metabolic cytometry. Cytometry. 1999;37:14–20. doi: 10.1002/(sici)1097-0320(19990901)37:1<14::aid-cyto2>3.0.co;2-j. [DOI] [PubMed] [Google Scholar]
- 29.Schoenherr RM, Ye M, Vannatta M, Dovichi NJ. CE-microreactor-CE-MS/MS for protein analysis. Anal Chem. 2007;79:2230–2238. doi: 10.1021/ac061638h. [DOI] [PMC free article] [PubMed] [Google Scholar]
- 30.Ye M, Hu S, Schoenherr RM, Dovichi NJ. On-line protein digestion and peptide mapping by capillary electrophoresis with post-column labeling for laser-induced fluorescence detection. Electrophoresis. 2004;25:1319–1326. doi: 10.1002/elps.200305841. [DOI] [PubMed] [Google Scholar]