

Abstract
Background
Fetal alcohol syndrome and related disorders (commonly referred to as Fetal Alcohol Spectrum Disorder, or FASD) cause significant hardships to the individuals affected. Previously, histological studies in animals have characterized developmental cerebral cortical abnormalities that result from prenatal ethanol exposure. Additionally, magnetic resonance imaging (MRI) studies have identified abnormalities associated with fetal ethanol exposure in the cerebral cortices of human children and adolescents. However, there is still a need to bridge the gap between human MRI studies and animal histological studies. The goal of the research presented here was to perform postmortem MRI experiments on rodents, during time periods relative to late human gestation through adulthood, to characterize of anomalies associated with FASD throughout development. Additionally, by determining how histologically-identified abnormalities are manifest in MRI measurements specifically during the critical early time points, neuroimaging-based biomarkers of FASD can potentially be identified at much earlier ages in humans, thus reducing the impact of these disorders.
Methods
Cerebral cortical volume, thickness and surface area were characterized by ex vivo MRI in Long-Evans rat pups born from dams that were ethanol-treated, maltose/dextrin-treated or untreated throughout gestation at 6 developmental time points (postnatal day (P)0, P3, P6, P11, P19 and P60).
Results
Brain volume, isocortical volume, isocortical thickness and isocortical surface area were all demonstrated to be reduced following prenatal exposure to ethanol. Significant differences among the treatment groups were observed throughout the range of time points studied, allowing for a comprehensive view of FASD influenced MRI outcomes throughout development. Isocortical surface area and isocortical thickness results contributed independent information important to interpreting effects of prenatal ethanol exposure on cerebral cortical development. Additionally, regional patterns in cortical thickness differences suggested primary sensory areas were particularly vulnerable to gestational ethanol exposure.
Conclusions
Structural MRI measurements were in accordance with previous histological studies performed in animal models of FASD. In addition to establishing a summary of MRI outcomes throughout development in FASD, this research suggests that MRI techniques are sufficiently sensitive to detect neuroanatomical effects of fetal ethanol exposure on development of the cerebral cortex during the period of time corresponding to late gestation in humans. Importantly, this research provides a link between animal histological data and human MRI data.
Keywords: Fetal Alcohol Spectrum Disorder (FASD), Magnetic Resonance Imaging (MRI), Cerebral Cortical Development
Introduction
Fetal Alcohol Syndrome (FAS) and the more broad designation of Fetal Alcohol Spectrum Disorders (FASD) describe a set of conditions that result from prenatal alcohol exposure. These disorders cause significant physical, mental and financial hardships in the children and families affected. The main criteria currently used to diagnose FASD include facial dysmorphology, growth deficits and central nervous system problems (Fetal Alcohol Syndrome: Guidelines for Referral and Diagnosis; National Center on Birth Defects and Developmental Disabilities, 2004). While these criteria are reliable, they only allow for diagnosis late in childhood; studies have reported that the average age of diagnosis of FAS and FASD ranges from 3 to 10 years of age (Elliott et al., 2008; Streissguth et al., 2004). Early diagnosis is extremely important, as this allows for therapeutic intervention at critical time points, potentially reducing the severity of adverse outcomes of these disorders (Olson et al., 2007; Streissguth et al., 2004). In response to the need for earlier diagnoses and interventions, a great deal of research has gone into determining what the effects of alcohol are on the developing brain.
A large literature exists based on research using animal subjects and employing histological methods, that documents susceptibility of the developing cerebral cortex to the teratogenic effects of fetal ethanol exposure. Specifically, altered neuronal generation, differentiation and columnar organization in the developing cerebral cortex have been observed in response to gestational ethanol exposure (Burke et al., 2009; Dunty et al., 2001; Granato, 2006; Margret et al., 2005; 2006; Medina et al., 2005; Miller, 1986; 1988; 1996; 2007; Miller and Potempa, 1990). Additionally, regional patterns in cerebral cortical cell number reductions and altered dendritic morphology indicate that primary sensory areas are particularly sensitive to prenatal ethanol exposure (Granato, 2006; Margret et al., 2005; 2006; Miller, 2007).
While work continues on characterizing the effects of ethanol exposure on early brain development, a challenge now lies in detecting these abnormalities using non-invasive neuroimaging techniques in vivo. Magnetic resonance imaging (MRI) has emerged as such a method, and has been used to identify cerebral cortical abnormalities associated with functional deficits in FASD. Structural MRI studies have revealed significantly reduced brain and cortical volumes in children and adolescents with FASD (Astley et al., 2009; Nardelli et al., 2011). Additionally, reduced cortical thickness has been demonstrated in children and adolescents (Zhou et al., 2011), and regional variability has been suggested throughout the cortex (Sowell et al., 2001; 2008; Yang et al., 2011; Zhou et al., 2011), although not all studies are in agreement regarding effects and affected areas. MRI outcomes have also been related to behavior in children, adolescents and adults prenatally exposed to alcohol (Bjorkquist et al., 2010; Coles et al., 2011; Sowell et al., 2008). While this information adds to our knowledge of the effects of alcohol during gestation, there is still a need to bridge the gap between histological studies done in animals, and human MRI measurements. By performing MRI studies at early stages in the rodent, we can relate rodent histological studies directly to MRI measurements, relate rodent MRI data to human MRI data, and importantly, differentiate between normal and abnormal development during critical early time periods.
Recent applications of MRI to the study of rodent models of FASD (Godin et al., 2010; O’Leary-Moore et al., 2010; Parnell et al., 2009) have demonstrated the potential of this technique to enhance the translational value of previous histological studies. Mice exposed to ethanol on gestational days 7, 8 or 10, and observed approximately 7 to 10 days later exhibited effects consistent with previous histology-based reports including reduced body size, brain volume and cortical volume relative to controls. The research presented here expands on this information by studying the effects of ethanol exposure throughout gestation on structural MRI outcomes throughout development in a rodent model of FASD. By examining the effects of ethanol at specific time points throughout isocortical development (relative to late human gestation throughout adulthood), a cross-sectional timeline of the effects of prenatal exposure to ethanol can be created distinguishing normal and abnormal development.
Given the concurrent incidence of reductions in observed cell number and cortical area in histological experiments and observations of reduced cortical thickness and volume in animals via MRI at specific time points, it was expected that measurements of brain mass, brain volume, isocortical volume, isocortical thickness and isocortical surface area would be lower in animals prenatally exposed to ethanol versus control animals. It was also expected that these differences would be observed throughout the time period corresponding to late gestation in humans, and potentially persist into adulthood. The period of time relative to late human gestation is critical to studying FASD, as detection during early brain development could enable early intervention, which, in turn, could potentially reduce the severity of these disorders. Additionally, by studying time points relative to adolescence and adulthood, information about the long-terms effects of prenatal exposure to ethanol and how these effects relate to human research can be gained.
Materials and Methods
Animal Care
Long-Evans rats were purchased from Harlan Laboratories (Livermore, CA), and were delivered to the Department of Comparative Medicine at Oregon Health & Science University. Virgin female dams (N=18) were ages 9 – 10 weeks and body masses were approximately 200 – 224 g. Proven breeder males (N=4) were ages 14 – 15 weeks, and body masses were approximately 325 – 349 g. All animals were given at least one week to acclimate to housing and light handling. All animals received standard chow, and participated in approximately one week of handling before experimental procedures began. All possible measures were taken to minimize animal pain or discomfort. All experiments were carried out in accordance with the NIH “Guide for the Care and Use of Laboratory Animals” (NIH publication no. 86-23, revised 1987).
Breeding
Each male was assigned to 3 to 6 dams. Vaginal lavages were taken twice daily (once in the morning and once in the afternoon), and examined for day of estrous cycle and presence of sperm. The dam that was nearest to estrus was placed in the same cage as the male. Males and females would share the same cage for up to one full cycle (typically 4-5 days). If, after one cycle, no sperm was detected, then the male and female were separated and the male was bred with another female (although an additional attempt to breed would be made at a later date). Gestational day (G) 1 was defined as the same day a morning lavage was found positive for sperm or the day after an afternoon lavage was found positive for sperm. Pregnant dams were assigned to one of three treatment groups: Ethanol-treated (E; n=7), Maltose/Dextrin-treated (M/D; n=5) or untreated (C; n=6).
Ethanol administration
Following procedures similar to that of Margret and colleagues (Margret et al., 2005; 2006), E and M/D dams were administered 4.5 g/kg of a 25% (w/v) ethanol solution or a calorie matched maltose/dextrin solution, respectively (ethanol has 7 kCal/g, maltose/dextrin has 3.8 kCal/g). Solutions were administered daily from G1 through G20 via intragastric gavage (birth typically occurred at G23). C dams received no treatment and minimal handling, limited to morning weights and removal for cage cleanings. C and E dams received food ad libitum throughout gestation. Each M/D dam received food that was matched in mass to food that one other E dam received. For E and M/D dams, food was removed in the morning, and gavages were administered 5 hours after food was removed. Gavages were administered in two equal portions, one hour apart, in order to minimize the volume of solution in the stomachs of the dams. Body masses of rat dams were measured each morning for all three groups.
Blood Ethanol Concentration
On G13 and G20, blood samples were collected from E dams via a saphenous vein. Approximately 20 μl were taken at one and four hours after the last gavage on G13 and G20. Blood was only collected from dams treated with ethanol as it was thought the procedures would be relatively more stressful for the un-intoxicated M/D and C animals, thus introducing a potential confound to the data. Blood ethanol concentrations were calculated via a gas chromatograph/mass spectrometer.
Tissue Collection
At 6 postnatal time points (P0, P3, P6, P11, P19 and P60), pups from the dams were sacrificed, and their brains collected for analysis (n = 4 – 6 /age/group; For E P6 and E P11, n = 6, for all other treatment groups at all other ages, n = 4; There were equal numbers of males and females in each treatment group at each age). Pups were given an i.p. injection of approximately 0.5 mL euthasol (pentobarbital sodium and phenytoin sodium; Butler-Schein Animal Health Supply, Dublin, OH). Heparin (0.01 mL/10 mL), with phosphate buffered saline (1× PBS), was injected into the left cardiac ventricle until the fluid of the right cardiac atrium was clear. Paraformaldehyde (2%, approximately 40 mL) was then injected into the left cardiac ventricle. Brains were removed from skulls prior to MRI in this experiment (rather than performing MRI before brain extraction) in order to obtain brain masses, and because tissue from the left and right hemispheres of the brains were used for separate sets of experiments involving histological procedures. The brains were extracted and placed in paraformaldehyde (2%, approximately 40 mL) for 24 hours. Samples were then transferred to 1X PBS at 4°C. After at least 48 hours in 1X PBS at 4°C, olfactory bulbs were removed from the brains at the lateral olfactory tract, the tissue was severed between the C1 dorsal root of the spinal cord and the medulla, and brain masses were measured. In order to maximize the sensitivity of the experiments by minimizing the size of the radio frequency (RF) coil used, left and right hemispheres were separated. Left hemispheres of each brain were utilized for all subsequent procedures (with the exception of one right hemisphere P19 E brain, due to a damaged left hemisphere from brain extraction procedures – orientation was flipped where appropriate when analyzing MRI images, and this tissue was otherwise treated as if it was a left hemisphere).
MRI procedures
Hemispheres were placed in a modified 5 mL conical tube filled with 1X PBS, and allowed to equilibrate to room temperature. Samples were placed into a one-turn solenoid RF coil manufactured in the laboratory (transmit/receive, tuned and matched to 500MHz), and the entire apparatus was placed in the isocenter of an 11.7 Tesla magnet (Bruker, Germany) interfaced with a 9 cm inner-diameter magnetic field gradient coil insert (maximum gradient strength of 70 G/cm per x, y and z axis). Whole-hemisphere images were acquired. A T2-weighted imaging sequence was employed (TR = 4000 – 5000, TE = 42.7 ms, FOV = 5.20 × 1.28 cm, Matrix = 250 × 64, Voxel size = 0.2 mm3, Averages = 6, Scan time = 4 hours). In some cases, diffusion tensor imaging (DTI) data were used to help define the boundaries between gray and white matter in the brain. DTI data were collected for a separate experiment.
Structural analyses
Anatomical images were analyzed using ITK-SNAP (Yushkevich et al. 2006) where the cerebellar area was masked from individual images. Total hemisphere volume was calculated based on the number of voxels within these images, not including the cerebellar region. Masks of the isocortex were made on individual images. Although data were collected throughout the entire cerebral cortex, allocortical regions do not undergo the same sequence of cellular differentiation throughout development as the isocortex (Sidman and Rakic 1973; 1982). Therefore, only data from the isocortex were used for analysis. The isocortex/allocortex boundary was defined rostrally by the lateral olfactory tract. The medial boundary of the isocortex was identified at the junction with the corpus callosum. Hemispheric isocortical volumes were calculated based on the number of voxels in the isocortical masks. Both brain and isocortical volume for the whole brain was estimated by multiplying hemispheric values by a factor of 2. This was done to more closely compare volumes estimated here to brain masses. In order to calculate isocortical thickness, outer and inner boundaries were defined on the isocortical mask (based upon the junction with the pial surface and the white matter, respectively). Mean isocortical thickness values were calculated based on a technique developed by Lerch and colleagues, which involved iteratively solving Laplace’s equation using the Jacobi method, and computing streamlines between the inner and outer boundaries using Euler’s method (Lerch et al., 2008).
In order to calculate surface area of the cortex, as well as perform regional cortical thickness analyses, a target surface model was created from the MRI data of a representative subject. Currently, a rat brain atlas relevant to the age range used in this study is not available; therefore, the most representative subject was determined by FSL-FLIRT (Smith et al., 2004; Woolrich et al., 2009) linear registration procedures. Transformation matrices generated from linear registration procedures were created for the registration of every subject to all other subjects. The most representative subject was chosen based on the subject requiring the smallest deformation to be registered to every other subject, as implemented by the FSL-FLIRT tool “fsl_reg”. The target surface model (created from a boundary half-way between the pial surface and gray-white matter boundary as determined by the technique described by Lerch et al., 2008) was created to most accurately calculate the isocortical surface area, as it was thought that a surface model created from the pial surface or the gray-white matter boundary would either over- or underestimate the true cortical surface area. This was accomplished using standard functions in the CARET software package (Van Essen et al., 2001, www.brainvis.wustl.edu/caret, St. Louis, MO). New transformation matrices, created from linearly registering MRI data from each individual to MRI data from the target subject, were applied to the target surface model to create individual surface models for each subject.
Surface area corresponding to the isocortex of each subject was calculated within the CARET software program, utilizing “Region of Interest Operations”. Surface area measurements are presented for the left hemisphere only.
The CARET implementation of Threshold Free Cluster Enhancement (TFCE; Smith and Nichols, 2009) was used to define regions on cortical surface models where mean cortical thickness differences between groups were significantly different. Cluster-based methods of MRI analysis were developed to deal with the problem of multiple voxel- or node-based comparisons. These methods of analyzing regional differences in MRI data between groups use neighborhood information around a particular voxel (or in the case of surface analyses as used here, around a particular node) to identify “clusters” of voxels or nodes that are significantly different. TFCE is a similar method that was developed to eliminate issues associated with traditional cluster-based methods known to reduce sensitivity, most notably the need for an initial, arbitrary threshold used to define the “clusters”. Our alpha was set at 0.05 for these analyses. Registration of the MRI data among the different ages was not performed, as there are drastic surface area changes across ages, and reliable landmarks are difficult to identify making this an error-prone process. Therefore, regional differences among the groups were identified at each age. Additionally, one goal of these experiments was to investigate developmental patterns of MRI outcomes. Therefore, our a priori hypothesis was that information gathered at each time point would contribute important independent information. TFCE was performed using all three combinations of group pairs (E versus C, E versus M/D and C versus M/D).
Statistics
A one-way ANOVA (analysis of variance) was used to determine the effect of group on maternal body mass at the beginning and end of the treatment period. A two-way mixed effects ANOVA model was used to determine effects of the independent variables, treatment group (E, C and M/D) and age group (P0, P3, P6, P11, P19 and P60), on dependent variables: brain mass, brain volume, isocortical volume, overall isocortical thickness and isocortical surface area. As mentioned earlier, TFCE analyses were used to determine significant regional patterns of cortical thickness among the treatment groups at each age. Uncorrected alpha was set at p=0.05 for all analyses. Statistics were implemented in Statview [SAS, Cary, NC]).
Results
Maternal Body Mass
Mean mass values at the beginning and end of the 20-day period in which gavages were administered (or G1 vs. G20 for the control group) did not differ significantly among treatment groups, nor did the body masses gained throughout pregnancy (data not shown).
Blood Ethanol Concentrations
The average blood ethanol concentration, calculated from blood samples taken 1 hour after the last gavage on G13 and G20, was 1.7 mg/ml (se = 0.185). The average blood ethanol concentration, calculated from blood samples taken 4 hours after the last gavage on G13 and G20, was 1.2 mg/ml (se = 0.186). These levels are in accordance with other studies of alcohol administration throughout gestation (e.g. Maciejewski-Lenoir, 1993). Alcohol administration was sufficient to elicit altered behavior (slow movement and altered motor coordination; qualitative examinations) in pregnant rat dams. Additionally, the ethanol dosing procedure used produced intoxication (>0.8 mg/ml) over an extended period of time (at least several hours per day).
Summary of Main Effects of Ethanol on Brain Mass, Brain Volume, Isocortical Volume, Isocortical Thickness and Isocortical Surface Area
As shown in Table 1, two-way mixed effects ANOVA revealed similar patterns for all dependent variables. Main effects of age and treatment group were significant for brain mass, brain volume, isocortical volume, isocortical thickness and isocortical surface area. Brain mass, brain volume, and isocortical volume results are shown in Figure 2; and isocortical surface area and thickness results are shown in Figure 3. As expected, all dependent variables increase with age. Additionally, as hypothesized, mean values of all outcomes associated with brain and cerebral cortical size were lowest in the E group. Further, all dependent variables were highest in M/D brains.
Table 1.
Statistical results for two-way mixed effects ANOVAs examining main effects of age and treatment group on all dependent variables.
| Dependent Variable | Age | Group | Age X Group | |||
|---|---|---|---|---|---|---|
| F(5,58) | p | F(2,58) | p | F(10, 58) | p | |
| Brain Mass | 1060 | <0.0001 | 55.7 | <0.0001 | 1.73 | 0.10 |
| Brain Volume | 643 | <0.0001 | 32.0 | <0.0001 | 1.03 | 0.43 |
| Isocortex Volume | 794 | <0.0001 | 38.1 | <0.0001 | 1.03 | 0.43 |
| Isocortex Thickness | 316 | <0.0001 | 20.9 | <0.0001 | .669 | 0.75 |
| Isocortex Surface Area | 1060 | <0.0001 | 38.7 | <0.0001 | 1.08 | 0.39 |
Age = Postnatal Day (P)0, P3, P6, P11, P19, P60. Treatment Groups = Maltose/Dextrin (M/D), Control (C), Ethanol (E).
Figure 2.
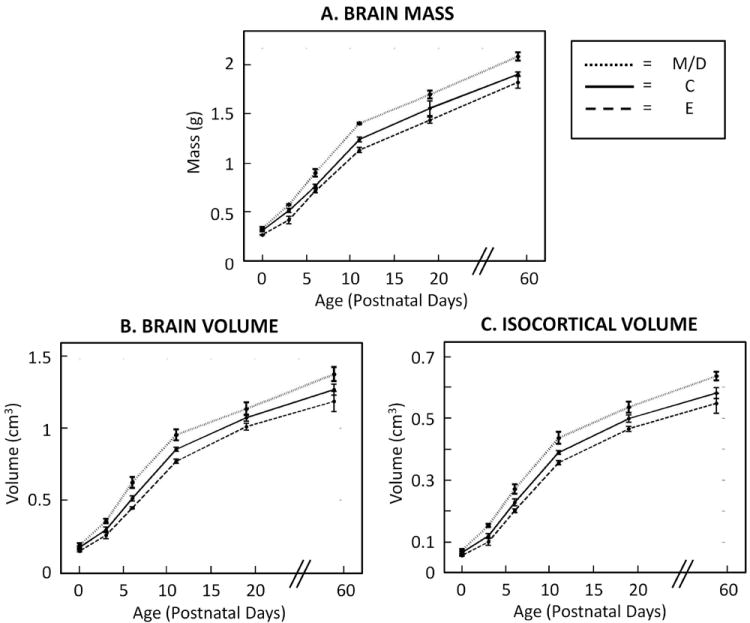
Rat brain masses (A), brain volumes (B) and isocortical volumes (C) in all treatment groups increased significantly with age (N = 4 – 6/age/group). Additionally, across age groups, the maltose/dextrin (M/D) had the highest mean brain mass, brain volume and isocortical volumes, while the ethanol (E) group had the lowest means (compared to the control (C) group). The dotted lines indicate M/D values, the solid lines indicate C values, and the dashed lines indicate E values. Statistical analyses revealed a main effect of age group and a main effect of treatment group on all dependent variables (p-values < 0.0001). There was no interaction between age group and treatment group (suggesting that the pattern of age group differences was statistically similar among treatment groups and that the pattern of treatment group differences was statistically similar among age groups).
Figure 3.
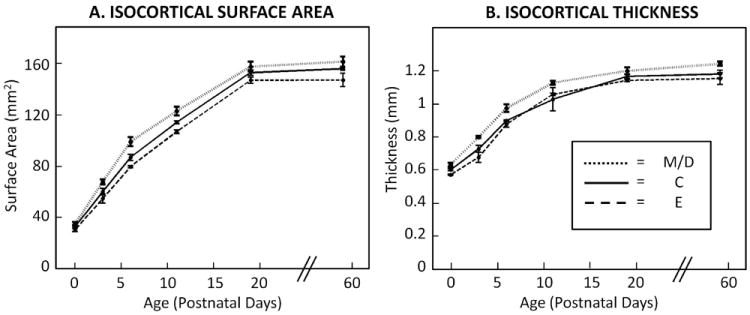
Rat isocortical surface area (A) and isocortical thickness (B) in all treatment groups increased significantly with age (N = 4 – 6/age/group). Additionally, across age groups, the maltose/dextrin (M/D) had the highest mean isocortical thickness and isocortical surface area, while the ethanol (E) group had the lowest means (compared to the control (C) group). The dotted lines indicate M/D values, the solid lines indicate C values, and the dashed lines indicate E values. Statistical analyses revealed a main effect of age group and a main effect of treatment group on all dependent variables (p-values < 0.0001). There was no interaction between age group and treatment group (suggesting that the pattern of age group differences was statistically similar among treatment groups, and that the pattern of treatment group differences was statistically similar among age groups).
Our analysis revealed no significant interactions between age and treatment group on any of the dependent measures. This implies that prenatal ethanol exposure affects mass, volume, surface area and thickness at all of the ages studied, and further, our data do not provide evidence that these effects scale linearly with age. Means and standard errors for each dependent measure are given in Table 2 to help interpret the magnitude of treatment group differences at each age.
Table 2.
Means and standard errors (in parentheses) for each dependent variable at each age for each treatment group.
| Brain Weight (g) | Brain Volume (cm3) | Isocortex Volume (cm3) | Isocortex Surface Area (mm2) | Isocortex Thickness (mm) | ||
|---|---|---|---|---|---|---|
| P0 | M/D | .334 (.015) | .187 (.013) | .074 (.004) | 35.0 (1.72) | .633 (.012) |
| C | .313 (.014) | .172 (.010) | .067 (.003) | 33.0 (1.34) | .603 (.006) | |
| E | .269 (.003) | .147 (.006) | .057 (.002) | 30.4 (1.32) | .573 (.005) | |
| P3 | M/D | .576 (.006) | .354 (.016) | .153 (.005) | 61.2 (1.96) | .801 (.006) |
| C | .516 (.021) | .294 (.019) | .120 (.007) | 60.5 (2.44) | .729 (.021) | |
| E | .420 (.038) | .256 (.025) | .101 (.011) | 55.1 (3.66) | .678 (.031) | |
| P6 | M/D | .901 (.039) | .622 (.038) | .271 (.015) | 99.3 (3.46) | .975 (.023) |
| C | .766 (.017) | .512 (.018) | .228 (.011) | 87.1 (2.37) | .901 (.003) | |
| E | .716 (.021) | .446 (.007) | .201 (.006) | 79.9 (.768) | .878 (.018) | |
| P11 | M/D | 1.40 (.008) | .952 (.038) | .436 (.019) | 123 (3.34) | 1.13 (.012) |
| C | 1.24 (.024) | .852 (.015) | .389 (.006) | 114 (1.21) | 1.03 (.070) | |
| E | 1.13 (.027) | .769 (.035) | .356 (.007) | 107 (1.31) | 1.06 (.008) | |
| P19 | M/D | 1.70 (.041) | 1.13 (.044) | .535 (.036) | 158 (3.76) | 1.20 (.020) |
| C | 1.56 (.075) | 1.07 (.024) | .498 (.012) | 153 (2.14) | 1.17 (.014) | |
| E | 1.44 (.033) | 1.01 (.024) | .465 (.017) | 147 (2.33) | 1.14 (.006) | |
| P60 | M/D | 2.09 (.042) | 1.37 (.049) | .635 (.014) | 162 (3.95) | 1.25 (.013) |
| C | 1.91 (.024) | 1.27 (.038) | .580 (.018) | 156 (1.45) | 1.18 (.023) | |
| E | 1.82 (.062) | 1.18 (.071) | .547 (.032) | 147 (5.15) | 1.16 (.036) | |
Note: Brain Volume and Isocortex Volume are estimated for the whole brain for comparison to Brain Weight, while Isocortex Surface Area and Isocortex Thickness are for one hemisphere only.
Age = Postnatal Day (P)0, P3, P6, P11, P19, P60. Treatment Groups = Maltose/Dextrin (M/D), Control (C), Ethanol (E).
Regional Patterns in Cortical Thickness
The common pattern of effects of ethanol exposure on all measured outcomes associated with brain development (Table 1, Figures 2, 3) indicates that ethanol affects a broad range of CNS developmental processes. However, previous literature has indicated that prenatal ethanol may have differential effects on particular areas of the cerebral cortex (Granato, 2006; Margret et al., 2005; 2006; Miller, 2007; Sowell et al., 2001; 2008; Yang et al., 2011; Zhou et al., 2011). Specifically, cerebral cortical cell numbers and morphology in primary sensory areas have been demonstrated to exhibit heightened sensitivity to prenatal ethanol (Granato, 2006; Margret et al., 2005; 2006; Miller, 2007). To investigate whether neuroimaging outcomes reflect regional variation in sensitivity, a TFCE analysis (Smith and Nichols, 2009) was conducted on the isocortical thickness results. Specific regions of the isocortex that exhibited differences in isocortical thickness between groups were found. As shown in Figure 4, regional thickness differences were observed between the E and M/D groups at all ages, between the C and M/D groups at P3 and P6, and between the E and C groups at P0 and P11.
Figure 4.
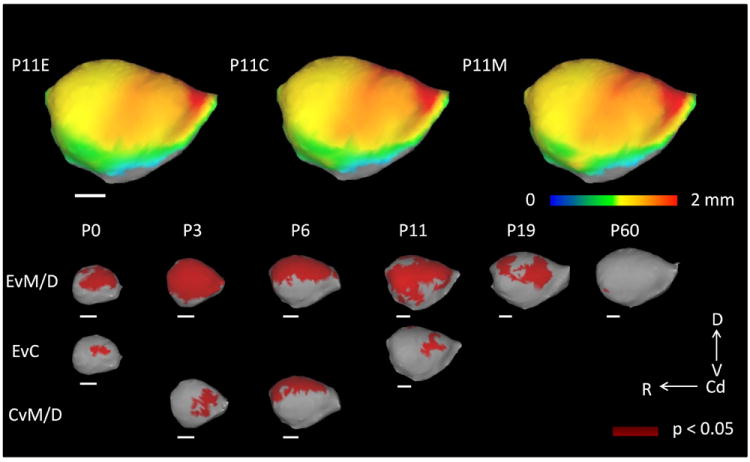
Results of the Threshold Free Cluster Enhancement (TFCE) analysis. On the top row, mean cortical thickness at postnatal day (P)11 for each group in the rat (n = 4 – 6/age/group) are projected onto target cortical surfaces. TFCE results are pictured in dark red in the last three rows representing regions, in which mean cortical thickness between groups is significantly different (p < 0.05). Specific regional differences, centered on primary sensory areas, were found among ethanol (E) and maltose/dextrin (M/D) groups at all ages. Regions of significant difference were also found in comparisons between E and control (C) groups at P0 and P11, and between C and M/D groups at P3 and P6. Scale bars (in white) represent 2 mm. D = Dorsal, V = Ventral, Cd = Caudal, R = Rostral.
In the top panel of Figure 4, color maps of mean cortical thickness at P11 for each treatment group are displayed. In all three treatment groups, it is apparent that the cortex is thickest (red) in frontal areas, and thinnest in occipital and temporal areas (yellow and green). However, as seen in the treatment group comparisons at each age, there are specific areas that show the greatest difference between groups (dark red in the bottom panel of Figure 4 represents areas in which differences between groups are statistically significant at the level of p < 0.05). Comparing the E and M/D groups, it is evident that the M/D group is generally, relatively thicker in all of the primary sensory areas than the E group (Figure 4 bottom panel, first row). However, when comparing the E group with the C group, differences are focused in the parietal and frontal-parietal regions of the cortex or somatosensory and motor locations (located dorsally, mid-way between the rostral and caudal extent of the lateral surface; Figure 4 bottom panel, second row), which is congruent with histological evidence of reduced cell numbers in the somatosensory-motor cortices in the macaque following prenatal ethanol exposure (Miller, 2007). Finally, in the C versus MD comparison differences are located primarily in the frontal and parietal (P3) and parietal and occipital (P6) areas (Figure 4 bottom panel, third row).
Discussion
Overall, the E group displayed the lowest values on all of the measures presented here, which was expected. This finding is consistent with histological studies of gray matter reduction (Miller, 2007) as well as MRI studies of reduced brain and cortical volume (O’Leary-Moore et al., 2010; Parnell et al., 2009). Additionally, these data extend previous findings in terms of suggesting specific developmental abnormalities in cortical thickness and surface area, and define the time period during which these cortical abnormalities can be seen. Some histological studies of cell production and proliferation have suggested that prenatal ethanol exposure may cause a delay in development (e.g. Margret et al., 2006; Miller, 1988) versus permanent deficits. However, given the lack of a statistical interaction between treatment and age groups, as well as the visually consistent pattern of differences among the treatment groups at the later ages, our results indicate that abnormal MRI measurements of the brain and cerebral cortex are seen at very early stages of development and persist into adulthood. Importantly, these data present the first neuroimaging-based demonstration of developmental patterns in reduced brain volumes, cortical volumes, cortical thickness and cortical surface corresponding to mid to late gestation, as well as adolescence and adulthood in humans.
Recent research suggests that cortical thickness and surface area provide independent information about the development of the cerebral cortex (Raznahan et al., 2011). Both of these variables, in addition to cerebral cortical volume are important outcomes for characterizing cerebral cortical development. Although an interaction between age and treatment group was not statistically significant in regard to any of the experimental variables, cortical thickness differences among groups appear to be largest at earlier ages (P0 through P3), while surface area differences among groups appear to be largest relatively later (P3 through P11). An interaction between cortical thickness and cortical surface area supports the finding that isocortical volume is uniformly reduced across the ages examined herein.
Isocortical thickness and surface area are also thought to be affected by cell number and cortical organization. Histological studies providing evidence of reduced cell numbers and altered neuronal orientation and organization with prenatal ethanol exposure (Dunty et al., 2001; Miller 1988), specifically around the time of birth in rats (Miller, 1988), also support the differences in isocortical volume, thickness and surface area seen here. Overall, the research presented here supports the concept that volume, thickness and surface area can provide important, independent information, and suggests that both thickness and surface area measures should be considered in relation to cortical volume.
In an attempt to determine the areas of the cortex most affected by prenatal exposure to ethanol, statistical differences in isocortical thickness across the isocortex were compared between groups using a TFCE analysis. The fact that the largest cortical thickness differences were seen specifically in primary sensory areas is important in terms of interpreting symptoms of FASD. These areas are vital for the processing of environmental information, and specific abnormalities in these areas during cortical formation could lead to symptoms commonly associated with FASD. Additionally, previous structural MRI studies have related neuroimaging outcomes to behavior (Coles et al., 2011; Willoughby et al., 2008). While these studies did not focus specifically on the cerebral cortex, and were performed in human children and adults, results from these studies suggest that the MRI outcomes caused by prenatal exposure to ethanol presented here could potentially be related to future behavioral abnormalities.
The regional patterns presented here are consistent with histological data suggesting specific deficits in cortical formation in primary sensory cortical areas (Granato, 2006; Margret et al., 2005; 2006) caused by prenatal exposure to ethanol. Additionally, these data expand upon previous work by suggesting specific insult to the primary motor and somatosensory cortices caused by prenatal ethanol exposure. It is important to note that not all MRI studies examining the effects of gestational alcohol exposure are in consensus in terms of specific regional patterns of cortical thickness. For instance, while some research in humans has shown decreases in cortical thickness in particular brain areas, such as the left precentral gyrus, left lateral temporal lobe and right inferior occipital lobe (Zhou et al., 2011), other studies in children and adolescents have suggested that the parietal cortex might be relatively thicker than other areas of the brain relative to total brain size in individuals prenatally exposed to alcohol (i.e. Sowell et al., 2008; Yang et al., 2011). The research presented herein suggests that the primary sensory areas show specific cortical thinning in response to prenatal ethanol exposure. However, this discrepancy might also partly be due to the varying amounts and doses of ethanol consumed during human pregnancy.
Methodological considerations that may have an effect on the results presented here include sex differences, hemispheric differences and body weight differences. Equal numbers of males and females were used in the experiment to control for any sex differences. While the numbers were considered too low to reach sufficient power for an analysis of sex effects, no one sex appeared to be driving any of the significant differences observed among the groups for any of the dependent variables. Regarding hemispheric differences, as explained above, hemispheres were separated both in order to enable multiple histological tests on this tissue in the future as well as to optimize the MRI images. No differences between the hemispheres were expected, and ethanol was not expected to have a differential effect on the hemispheres. Lastly, in an attempt to disturb the litter as little as possible, pups were not individually identified or followed longitudinally, and body weight differences were not recorded. Additionally, our study design made it difficult to look at body weights across time, as the majority of pups were sacrificed within approximately the first postnatal week (body weight data would necessarily be recorded from decreasing numbers of pups with each time point). However, it is recognized that examining body weight data in the future might help interpret the developmental patterns revealed here.
In the research presented here, prenatal exposure to maltose/dextrin (administered as a caloric control for ethanol) was associated with increased brain mass, brain volume, isocortical volume, isocortical thickness and isocortical surface area relative to C or E groups. While these differences were not expected, and have not been demonstrated previously, it is possible that nutritional effects of administering maltose/dextrin to these animals may have been present. It is difficult to determine a consensus among studies of FASD in terms of effects of control treatments, as not all studies employ isocaloric controls, and several differing approaches have been taken in those studies that do. In addition to the different time periods of exposure, the actual solution often differs (sucrose versus maltose/dextrin), some studies use only a sucrose control (and do not include an untreated control; e.g. Miller et al., 1999), some studies use liquid diets only (in comparison to liquid diet with chow supplementation; e.g. Hammer and Scheibel, 1981) and in a number of studies, the control groups are combined (e.g. Cui et al., 2010). Previous research also does not document the effects of maltose/dextrin on isocortical volume, thickness and surface area as measured here, and is inconsistent in terms of effects of isocaloric controls on brain mass. It is important to note that the effects of the maltose/dextrin diet reported here do not necessarily reflect a benefit. However, these results emphasize the importance of including a calorie-matched control in experiments investigating prenatal exposure to alcohol, and suggest that further experimentation may be needed to explore the specific effect of maltose/dextrin administration.
Overall, this research corresponds to histological evidence, suggesting that MRI could be used to detect cortical abnormalities caused by prenatal exposure to ethanol. Additionally, by using MRI in a rodent model of FASD over a range of time points corresponding to late human gestation throughout adulthood, this research links human MRI data to rodent histological data. The data presented here suggest that MRI is as sensitive to cortical abnormalities during early cortical development as during time periods corresponding to human childhood through adulthood. Thus, MRI is introduced as a potential tool for early diagnosis of FASD.
Figure 1.
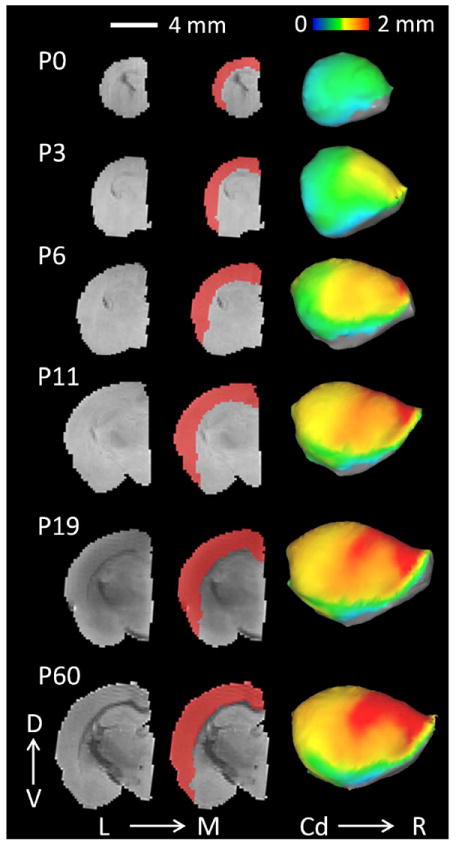
The left panel displays a raw, T2-weighted, mid-coronal image of one female control subject for each age group. The middle panel shows cortical masks (red) used to delineate the isocortex. The right panel displays the average isocortical thickness for the control (C) group projected onto lateral cortical surface models for each age group. Age = Postnatal Day (P)0, P3, P6, P11, P19, P60. Scale bar (in white) represents 4 mm. D = Dorsal, V = Ventral, L = Lateral, M = Medial, Cd = Caudal, R = Rostral.
Acknowledgments
This research was supported by the following:
Oregon Health & Science University Division of Neuroscience, NIH R01 NS070022, NIH P51 RR000163, ABMRF/The Foundation for Alcohol Research, T32 AA007468, The W.M. Keck Foundation, T32AG023477
The authors would like to acknowledge Dr. Kathleen A. Grant for her help in the design of this experiment.
References
- Astley SJ, Aylward EH, Carmichael-Olson H, Kerns K, Brooks A, Coggins TE, Davies J, Dorn S, Gendler B, Jirikowic T, Kraegel P, Maravilla K, Richards T. Functional Magnetic Resonance Imaging Outcomes From a Comprehensive Magnetic Resonance Study of Children With Fetal Alcohol Spectrum Disorders. J Neurodev Disord. 2009;1:61–80. doi: 10.1007/s11689-009-9004-0. [DOI] [PMC free article] [PubMed] [Google Scholar]
- Bjorkquist OA, Fryer SL, Reiss AL, Mattson SN, Riley EP. Cingulate Gyrus Morphology in Children and Adolescents with Fetal Alcohol Spectrum Disorders. Psychiatry Res. 2010;181:101–107. doi: 10.1016/j.pscychresns.2009.10.004. [DOI] [PMC free article] [PubMed] [Google Scholar]
- Burke MW, Palmour RM, Ervin FR, Ptito M. Neuronal Reduction in Frontal Cortex of Primates After Prenatal Alcohol Exposure. Neuroreport. 2009;20:13–17. doi: 10.1097/WNR.0b013e32831b449c. [DOI] [PubMed] [Google Scholar]
- Coles CD, Goldstein FC, Lynch ME, Chen X, Kable JA, Johnson KC, Hu X. Memory and Brain Volume in Adults Prenatally Exposed to Alcohol. Brain Cogn. 2011;75:67–77. doi: 10.1016/j.bandc.2010.08.013. [DOI] [PMC free article] [PubMed] [Google Scholar]
- Cui Z, Zhao K, Zhao H, Yu D, Niu Y, Zhang J, Deng J. Prenatal Alcohol Exposure Induces Long-Term Changes in Dendritic Spines and Synapses in the Mouse Visual Cortex. Alcohol Alcohol. 2010;45:312–319. doi: 10.1093/alcalc/agq036. [DOI] [PubMed] [Google Scholar]
- Dunty WCJ, Chen S, Zucker RM, Dehart DB, Sulik KK. Selective Vulnerability of Embryonic Cell Populations to Ethanol-Induced Apoptosis: Implications for Alcohol-Related Birth Defects and Neurodevelopmental Disorder. Alcohol Clin Exp Res. 2001;25:1523–1535. [PubMed] [Google Scholar]
- Elliott EJ, Payne J, Morris A, Haan E, Bower C. Fetal Alcohol Syndrome: A Prospective National Surveillance Study. Arch Dis Child. 2008;93:732–737. doi: 10.1136/adc.2007.120220. [DOI] [PubMed] [Google Scholar]
- Godin EA, O’leary-Moore SK, Khan AA, Parnell SE, Ament JJ, Dehart DB, Johnson BW, Johnson GA, Styner MA, Sulik KK. Magnetic Resonance Microscopy Defines Ethanol-Induced Brain Abnormalities in Prenatal Mice: Effects of Acute Insult on Gestational Day 7. Alcohol Clin Exp Res. 2010;34:98–111. doi: 10.1111/j.1530-0277.2009.01071.x. [DOI] [PMC free article] [PubMed] [Google Scholar]
- Granato A. Altered Organization of Cortical Interneurons in Rats Exposed to Ethanol During Neonatal Life. Brain Res. 2006;1069:23–30. doi: 10.1016/j.brainres.2005.11.024. [DOI] [PubMed] [Google Scholar]
- Hammer RP, Jr, Scheibel AB. Morphologic Evidence For a Delay of Neuronal Maturation in Fetal Alcohol Exposure. Exp Neurol. 1981;74:587–596. doi: 10.1016/0014-4886(81)90193-x. [DOI] [PubMed] [Google Scholar]
- Kroenke CD, Taber EN, Leigland LA, Knutsen AK, Bayly PV. Regional Patterns of Cerebral Cortical Differentiation Determined By Diffusion Tensor MRI. Cereb Cortex. 2009;19:2916–2929. doi: 10.1093/cercor/bhp061. [DOI] [PMC free article] [PubMed] [Google Scholar]
- Lerch JP, Carroll JB, Dorr A, Spring S, Evans AC, Hayden MR, Sled JG, Henkelman RM. Cortical Thickness Measured From MRI in the YAC128 Mouse Model of Huntington’s Disease. Neuroimage. 2008;41:243–251. doi: 10.1016/j.neuroimage.2008.02.019. [DOI] [PubMed] [Google Scholar]
- Maciejewski-Lenoir D. Chronic Prenatal Ethanol Exposure Does Not Affect the Expression of Selected Genes in Rat Brain Development. Alcohol Alcohol. 1993;28:401–412. [PubMed] [Google Scholar]
- Margret CP, Li CX, Chappell TD, Elberger AJ, Matta SG, Waters RS. Prenatal Alcohol Exposure Delays the Development of the Cortical Barrel Field in Neonatal Rats. Exp Brain Res. 2006;1722:1–13. doi: 10.1007/s00221-005-0319-0. [DOI] [PubMed] [Google Scholar]
- Margret CP, Li CX, Elberger AJ, Matta SG, Chappell TD, Waters RS. Prenatal Alcohol Exposure Alters the Size, But Not the Pattern, of the Whisker Representation in Neonatal Rat Barrel Cortex. Exp Brain Res. 2005;165:167–178. doi: 10.1007/s00221-005-2287-9. [DOI] [PubMed] [Google Scholar]
- Medina AE, Krahe TE, Ramoa AS. Early Alcohol Exposure Induces Persistent Alteration of Cortical Columnar Organization and Reduced Orientation Selectivity in the Visual Cortex. J Neurophysiol. 2005;93:1317–1325. doi: 10.1152/jn.00714.2004. [DOI] [PubMed] [Google Scholar]
- Miller MW. Effects of Alcohol on the Generation and Migration of Cerebral Cortical Neurons. Science. 1986;233:1308–1311. doi: 10.1126/science.3749878. [DOI] [PubMed] [Google Scholar]
- Miller MW. Effect of Prenatal Exposure to Ethanol on the Development of Cerebral Cortex: I. Neuronal Generation. Alcohol Clin Exp Res. 1988;12:440–449. doi: 10.1111/j.1530-0277.1988.tb00223.x. [DOI] [PubMed] [Google Scholar]
- Miller MW. Limited Ethanol Exposure Selectively Alters the Proliferation of Precursor Cells in the Cerebral Cortex. Alcohol Clin Exp Res. 1996;20:139–144. doi: 10.1111/j.1530-0277.1996.tb01056.x. [DOI] [PubMed] [Google Scholar]
- Miller MW. Exposure to Ethanol During Gastrulation Alters Somatosensory-Motor Cortices and the Underlying White Matter in the Macaque. Cereb Cortex. 2007;17:2961–2971. doi: 10.1093/cercor/bhm024. [DOI] [PubMed] [Google Scholar]
- Miller MW, Astley S, Clarren SK. Number of Axons in the Corpus Callosum of the Mature Macaca Nemestrina: Increases Caused by Prenatal Exposure to Ethanol. J Comp Neurol. 1999;412:123–131. [PubMed] [Google Scholar]
- Miller MW, Potempa G. Numbers of Neurons and Glia in Mature Rat Somatosensory Cortex: Effects of Prenatal Exposure to Ethanol. J Comp Neurol. 1990;293:92–102. doi: 10.1002/cne.902930108. [DOI] [PubMed] [Google Scholar]
- Nardelli A, Lebel C, Rasmussen C, Andrew G, Beaulieu C. Extensive Deep Gray Matter Volume Reductions in Children and Adolescents With Fetal Alcohol Spectrum Disorders. Alcohol Clin Exp Res. 2011;35:1404–1417. doi: 10.1111/j.1530-0277.2011.01476.x. [DOI] [PubMed] [Google Scholar]
- O’leary-Moore SK, Parnell SE, Godin EA, Dehart DB, Ament JJ, Khan AA, Johnson GA, Styner MA, Sulik KK. Magnetic Resonance Microscopy-Based Analyses of the Brains of Normal and Ethanol-Exposed Fetal Mice. Birth Defects Res A Clin Mol Teratol. 2010;88:953–964. doi: 10.1002/bdra.20719. [DOI] [PMC free article] [PubMed] [Google Scholar]
- Olson HG, Jirikowic T, Kartin D, Astley S. Responding to the Challenge of Early Intervention for Fetal Alcohol Spectrum Disorders. Infant Young Child. 2007;20:172–189. [Google Scholar]
- Parnell SE, O’leary-Moore SK, Godin EA, Dehart DB, Johnson BW, Johnson GA, Styner MA, Sulik KK. Magnetic Resonance Microscopy Defines Ethanol-Induced Brain Abnormalities in Prenatal Mice: Effects of Acute Insult on Gestational Day 8. Alcohol Clin Exp Res. 2009;33:1001–1011. doi: 10.1111/j.1530-0277.2009.00921.x. [DOI] [PMC free article] [PubMed] [Google Scholar]
- Raznahan A, Shaw P, Lalonde F, Stockman M, Wallace GL, Greenstein D, Clasen L, Gogtay N, Giedd JN. How Does Your Cortex Grow? J Neurosci. 2011;31:7174–7177. doi: 10.1523/JNEUROSCI.0054-11.2011. [DOI] [PMC free article] [PubMed] [Google Scholar]
- Sidman RL, Rakic P. Neuronal Migration, with Special Reference to Developing Human Brain: A review. Brain Res. 1973;62:1–35. doi: 10.1016/0006-8993(73)90617-3. [DOI] [PubMed] [Google Scholar]
- Sidman RL, Rakic P. In: Development of the Human Central Nervous System, in Histology and Histopathology of the Nervous System. Haymaker W, Adams RD, editors. C.C. Thomas; Springfield, IL: 1982. pp. 3–145. [Google Scholar]
- Smith SM, Jenkinson M, Woolrich MW, Beckmann CF, Behrens TEJ, Johansen-Berg H, Bannister PR, De Luca M, Drobnjak I, Flitney DE, Niazy R, Saunders J, Vickers J, Zhang Y, De Stefano N, Brady JM, Matthews PM. Advances in Functional and Structural MR Image Analysis and Implementation as FSL. Neuroimage. 2004;23:S208–219. doi: 10.1016/j.neuroimage.2004.07.051. [DOI] [PubMed] [Google Scholar]
- Smith SM, Nichols TE. Threshold-Free Cluster Enhancement: Addressing Problems of Smoothing, Threshold Dependence and Localisation in Cluster Inference. Neuroimage. 2009;44:83–98. doi: 10.1016/j.neuroimage.2008.03.061. [DOI] [PubMed] [Google Scholar]
- Sowell ER, Mattson SN, Kan E, Thompson PM, Riley EP, Toga AW. Abnormal Cortical Thickness and Brain-Behavior Correlation Patterns in Individuals With Heavy Prenatal Alcohol Exposure. Cereb Cortex. 2008;18:136–144. doi: 10.1093/cercor/bhm039. [DOI] [PMC free article] [PubMed] [Google Scholar]
- Sowell ER, Thompson PM, Mattson SN, Tessner KD, Jernigan TL, Riley EP, Toga AW. Voxel-Based Morphometric Analyses of the Brain in Children and Adolescents Prenatally Exposed to Alcohol. Neuroreport. 2001;12:515–523. doi: 10.1097/00001756-200103050-00018. [DOI] [PubMed] [Google Scholar]
- Streissguth AP, Bookstein FL, Barr HM, Sampson PD, O’malley K, Young JK. Risk Factors for Adverse Life Outcomes in Fetal Alcohol Syndrome and Fetal Alcohol Effects. J Dev Behav Pediatr. 2004;25:228–238. doi: 10.1097/00004703-200408000-00002. [DOI] [PubMed] [Google Scholar]
- Van Essen DC, Dickson J, Harwell J, Hanlon D, Anderson CH, Drury HA. An Integrated Software System for Surface-Based Analysis of Cerebral Cortex. J Am Med Inform Assoc. 2001;41:1359–1378. [Google Scholar]
- Willoughby KA, Sheard ED, Nash K, Rovet J. Effects of Prenatal Alcohol Exposure on Hippocampal Volume, Verbal Learning, and Verbal and Spatial Recall in Late Childhood. J Int Neuropsychol Soc. 2008;14:1022–103. doi: 10.1017/S1355617708081368. [DOI] [PubMed] [Google Scholar]
- Woolrich MW, Jbabdi S, Patenaude B, Chappell M, Makni S, Behrens T, Beckmann C, Jenkinson M, Smith SM. Bayesian Analysis of Neuroimaging Data in FSL. Neuroimage. 2009;45:S173–S186. doi: 10.1016/j.neuroimage.2008.10.055. [DOI] [PubMed] [Google Scholar]
- Yang Y, Roussotte F, Kan E, Sulik KK, Mattson SN, Riley EP, Jones KL, Adnams CM, May PA, O’Connor MJ, Narr KL, Sowell ER. Abnormal Cortical Thickness Alterations in Fetal Alcohol Spectrum Disorders and Their Relationships With Facial Dysmorphology. Cerebral Cortex. 2011;22:1170–1179. doi: 10.1093/cercor/bhr193. [DOI] [PMC free article] [PubMed] [Google Scholar]
- Yushkevich PA, Piven J, Hazlett HC, Smith RG, Ho S, Gee JC, Gerig G. User-Guided 3D Active Contour Segmentation of Anatomical Structures: Significantly Improved Efficiency and Reliability. Neuroimage. 2006;31:1116–1128. doi: 10.1016/j.neuroimage.2006.01.015. [DOI] [PubMed] [Google Scholar]
- Zhou D, Lebel C, Lepage C, Rasmussen C, Evans A, Wyper K, Pei J, Andrew G, Massey A, Massey D, Beaulieu C. Developmental Cortical Thinning in Fetal Alcohol Spectrum Disorders. Neuroimage. 2011;58:16–25. doi: 10.1016/j.neuroimage.2011.06.026. [DOI] [PubMed] [Google Scholar]