



Abstract
Fetal Alz-50 clone 1 (FAC1) is a novel, developmentally regulated gene that exhibits changes in protein expression and subcellular localization during neuronal development and neurodegeneration. To understand the functional implications of altered subcellular localization, we have established a normal cellular function of FAC1. The FAC1 amino acid sequence contains regional homology to transcriptional regulators. Using the polymerase chain reaction-assisted binding site selection assay, we have identified a DNA sequence recognized by recombinant FAC1. Mutation of any 2 adjacent base pairs in the identified binding site dramatically reduced the binding preference of FAC1, demonstrating that the binding is specific for the identified site. Nuclear extracts from neural and non-neural cell lines contained a DNA-binding activity with similar specificity and nucleotide requirements as the recombinant FAC1 protein. This DNA-binding activity can be attributed to FAC1 since it is dependent upon the presence of FAC1 and behaves identically on a nondenaturing polyacrylamide gel as transiently transfected FAC1. In NIH3T3 cells, luciferase reporter plasmids containing the identified binding site (CACAACAC) were repressed by cotransfected FAC1 whether the binding site was proximal or distal to the transcription initiation site. This study indicates that FAC1 is a DNA-binding protein that functions as a transcription factor when localized to the nucleus.
The fetal Alz-50 clone 1 (FAC1)1 protein is a novel member of the plant homeodomain/leukemia-associated protein (PHD/ LAP) zinc finger family (1–3). This new class of zinc finger proteins contains a unique combination of cysteine and histidine residues that form two zinc-binding clusters composed of Cys4-His-Cys3. This family of proteins contains several classic transcription factors such as the Drosophila trithorax protein brahma and the PHD proteins HOX1.A and HAT3.1 (3). Other members of this class of zinc fingers such as the Drosophila polycomb gene group appear to play a role in chromatin reorganization (3). Apart from the common zinc finger motif, these proteins diverge greatly, containing chromodomains, bromodomains, and even other DNA-binding motifs. Although the PHD/ LAP finger has been shown to bind zinc and DNA (4, 5), it also acts as an interface for protein-protein interactions linking family members that bind DNA to family members that alter chromatin structure (6, 7). In most cases, characterized PHD/ LAP family members function to regulate gene expression (2, 3).
In addition to the PHD/LAP zinc finger motif, FAC1 also contains two putative nuclear localization signals, a putative nuclear export signal, two putative retinoblastoma susceptibility binding motifs, and an acidic domain (1). These domains are often present in proteins that regulate gene expression. FAC1 expression patterns also suggest a role in regulating gene expression specifically during neuronal development and degeneration. In adult cortex, FAC1 is expressed at low levels and exhibits punctate nuclear staining excluding the nucleolus (8). However, during cortical development or neurodegeneration associated with Alzheimer’s disease or amyotrophic lateral sclerosis, FAC1 is expressed at high levels and is localized throughout the nucleus, cell body, and neurites (8, 9). The significance of altering FAC1 subcellular distribution is observed during cortical development. In less differentiated neurons located in the outer cortical layers, FAC1 is present in the cell body and extending neurites (8). In the more mature inner cortical layers where neurons have established synaptic connections, FAC1 is present in the nucleus and appears to localize to specific regions within the nucleus, similar to the pattern seen in adult cortex. The presence of FAC1 in the nucleus is consistent with a role for FAC1 in regulating gene expression. Furthermore, the ability of FAC1 to alter gene expression may be regulated by removing FAC1 from the nucleus in response to specific stimuli.
We hypothesize that FAC1 functions to regulate gene expression. In this study, we demonstrate that FAC1 binds a unique DNA sequence. This sequence has been identified and shown to be specifically recognized by both recombinant and cellular FAC1 proteins. The identified FAC1-binding element (FBE) is present in a number of endogenous promoters, including the amyloid precursor protein (APP), a gene product implicated in neuronal development and neurodegeneration during Alzheimer’s disease. Furthermore, when the FBE is included in a heterologous, transcriptionally active promoter, FAC1 represses transcription. These data indicate that FAC1 functions as a transcriptional regulator and that its target genes are likely important players in neuronal development and neuro-degenerative diseases.
EXPERIMENTAL PROCEDURES
Degenerate Double-stranded Oligonucleotides for the PCR-assisted Binding Site Selection Assay
To produce a degenerate double-stranded nucleotide, a template was synthesized containing 15 degenerate nucleotides flanked on each side by an 18-base constant region (synthesized by Life Technologies, Inc.) (10). The template sequence was 5′-GGATGGATCCTGCAGTAC(N15)AGCTGAGCGAATTCGGTC-3′. Two 18-mer oligonucleotides were synthesized for amplification from this template: a 5′-primer (5′-GGATGGATCCTGCAGTAC-3′) and a 3′-primer (5′-GACCGAATTCGCTCAGCT-3′). The complementary strand (3′-primer) was also used to prime the synthesis of the second strand of the template using Taq DNA polymerase (11). PCR amplification was as described by Ausubel et al. (11). The 5′-BamHI and 3′-EcoRI restriction sites were used to clone the PCR-amplified product into pBluescript II KS+ (Stratagene).
Recombinant Protein Production and Purification
For DNA binding studies, the human FAC1 protein was purified using the glutathione S-transferase (GST) fusion system from Amersham Pharmacia Biotech as described previously (12). Human FAC1 cDNA was directionally cloned into pGEX5X-1 via the EcoRI-SalI cloning sites using PCR amplification. GST-FAC1 protein was purified by the specific interaction between GST and glutathione immobilized on Sepharose beads (Amersham Pharmacia Biotech). At this point, the protein was used as a FAC1 affinity column (for the PCR-assisted binding site selection assay); or the purified protein was eluted from the Sepharose column by addition of 10 mM glutathione in EMSA buffer (20 mM HEPES (pH 7.9), 20% glycerol, 200 mM KCl, 0.2 mM EDTA, 0.2 mM phenylmethylsulfonyl fluoride, and 0.5 mM dithiothreitol) followed by dialysis in EMSA buffer to remove the glutathione and was used for EMSA.
EMSA
For purified fusion protein, ~50 ng of protein was incubated with 0.5 ng of 32P-end-labeled double-stranded oligonucleotides in 20 μl of EMSA buffer for 20 min at room temperature (11, 13). When using cell extracts, 20–30 μg of protein was preincubated with salmon sperm DNA as a nonspecific competitor (1 μg of competitor/10 μg of protein) in EMSA buffer prior to addition of labeled probe to reduce nonspecific DNA-protein interactions. For competition reactions, unlabeled competitive molecules were preincubated with the protein for 5 min on ice prior to addition of labeled probe. The reaction mixture was loaded onto a prerun 4% nondenaturing polyacrylamide gel (11, 13) and electrophoresed at 100 V in a low ionic strength buffer (6.8 mM Tris (pH 8.0), 1 mM EDTA (pH 8.0), and 3.3 mM NaOAc). After 1.5 h, the polyacrylamide gel was removed from the apparatus, dried, and exposed to autoradiography film. Exposure time varied depending on the abundance of FAC1 protein present in the extract. Each EMSA was repeated at least three times to demonstrate reproducibility, and a representative autoradiograph was chosen for the figures.
Cellular Protein Extracts for EMSA and Immunoblotting
Protein extracts were prepared by detergent lysis on ice (0.1% Nonidet P-40, 10 mM Tris (pH 8.0), 10 mM MgCl2, 15 mM NaCl, 0.5 mM phenylmethyl-sulfonyl fluoride, 2 μg/ml pepstatin A, and 1 μg/ml leupeptin) (14). The nuclei were collected by low speed centrifugation at 800 × g for 5 min. The supernatant was saved as the “cytosolic extract,” and the pellet containing the nuclei was further extracted with high salt buffer (0.42 M NaCl, 20 mM HEPES (pH 7.9), 20% glycerol, 0.5 mM phenylmethyl-sulfonyl fluoride, 2 μg/ml pepstatin A, and 1 μg/ml leupeptin) on ice for 10 min. Residual insoluble material was removed by centrifugation at 14,000 × g for 5 min. The supernatant fraction was collected and termed the “nuclear extract.” Protein concentrations were determined by the Bio-Rad protein assay.
For immunoblotting, nuclear and cytosolic extracts were fractionated by electrophoresis on an 8% SDS-polyacrylamide gel. The proteins were transferred to nitrocellulose by electrophoresis and blocked in 5% non-fat milk and Tris-buffered saline (10 mM Tris (pH 8.0) and 150 mM NaCl). Monoclonal anti-FAC1 antibody FA-2, which recognizes primate and rodent FAC1 proteins, was used at a 1:10 dilution in 0.5% milk overnight at 4 °C. The blot was washed three times in Tris-buffered saline for 15 min. An isotype-specific secondary antibody was used to detect FA-2 (horseradish peroxidase-conjugated goat anti-mouse IgG1 (1:500 dilution), Jackson ImmunoResearch Laboratories, Inc.). The secondary antibody was washed extensively in Tris-buffered saline (three times for 20 min). The antibody was then visualized using enhanced chemiluminescence (ECL; Renaissance, NEN Life Science Products)
Cell Culture and Transient Transfection via Calcium Phosphate
NIH3T3 fibroblasts and COS cells were cultured in Dulbecco’s modified essential medium containing 10% bovine serum. MSN-2 cells were cultured in 15% fetal bovine serum in RPMI 1640 medium. PC12 cells were cultured in 5% fetal bovine serum and 10% horse serum in RPMI 1640 medium on collagen I-coated plates. PT67 cells were cultured in 10% fetal bovine serum in Dulbecco’s modified essential medium. For all cells, the medium was changed every 3 days, and the cells were split 1:5 once they came in contact with each other. Cells were plated at a density of 25,000 cells/ml. Transient transfections were initiated on tissue culture dishes that were 20–50% confluent (12).
Transfection DNA was resuspended in a 250 mM CaCl2 solution that was added dropwise to a 2× HEPES-buffered saline solution (Promega). The resulting mixture was allowed to precipitate for 20 min prior to addition to cells. 4 h after addition of DNA, the NIH3T3 cells were glycerol-shocked for 2 min with 10% glycerol in Dulbecco’s modified essential medium. Plates were washed three times in phosphate-buffered saline, and fresh medium was added. The transfection medium was changed 24 h after transfection of PT67 cells, which was found to produce the highest transfection efficiency.
Cells were harvested 48 h after transfection. Photinus luciferase production was assayed by scraping cells in luciferase assay lysis buffer, vortexing, removing the cellular debris by centrifugation, and collecting the supernatant. 20 μl of supernatant solution was added to 75 μl of luciferase reagent (Promega) and measured in a luminometer (Berthold Lumomat LB9501). Luminescence values were normalized to protein concentration as determined by the Bio-Rad protein assay. Each transfection was performed a total of six times. Three times with no reporter was used to control for transfection efficiency, and three times with a second reporter (pRL-TK; dual reporter luciferase assay, Promega) containing the Renilla luciferase gene under the control of the thymidine kinase promoter was used to normalize for transfection efficiency. Whether the transfection efficiency control was included or not, we saw the same relative values of Photinus luciferase activity in response to the presence of FAC1. This suggested that the transfection efficiencies were the same. The values shown are an average of all six transfection experiments.
RESULTS
Identifying the FBE
The primary amino acid sequence of FAC1 contains a PHD/LAP zinc finger and a region rich in basic amino acids adjacent to a highly acidic amino-terminal domain. Since DNA-binding proteins often contain regions with this amino acid consistency, we hypothesized that FAC1 functions as a site-specific DNA-binding protein and proposed to identify the consensus FBE using the PCR-assisted binding site selection assay (10, 11). The first 398 amino acids of FAC1 were chosen for use in this assay because the zinc finger, basic region, and acidic region are present in this protein fragment. A FAC1-(1–398) affinity column was made by producing a fusion between FAC1-(1–398) and GST, which binds glutathi-one conjugated to Sepharose beads (see “Experimental Procedures”). Double-stranded oligonucleotides with 15 degenerate sites flanked by 18 base pairs of known sequence were incubated with immobilized GST-FAC1-(1–398). Unbound DNA was washed away, and bound DNA was extracted and amplified by PCR with primers complementary to the 18-base pair flanking sequence. This enriched pool of oligonucleotides was incubated with column-immobilized GST-FAC1-(1–398), and the process was repeated four times. After the final DNA extraction, the population of oligonucleotides enriched for the FBE was amplified by PCR in the presence of [α-32P]dCTP and [α-32P]dATP for use as a probe in an EMSA with GST-FAC1-(1–398). The DNA sequence in complex with FAC1 migrated more slowly on the nondenaturing gel than DNA alone and was excised, amplified by PCR, and used again as a probe in a second EMSA. The DNA contained in the shifted complex from the second EMSA was excised, amplified by PCR, and cloned into pBluescript II KS+ (Stratagene). Twenty-four clones were isolated, sequenced, and compared for a FAC1-binding consensus sequence (Fig. 1). Pairwise comparison of the sequences revealed that the consensus sequence was likely CACAACAC, as one-third of the clones contained this site with no more than a single base change. No more than three nonconsecutive single base changes were contained in the majority of the clones. Several of the identified sites were tested for FAC1 binding (data not shown), but none bound FAC1 as well as the identified consensus sequence (Fig. 1), which is referred to as the FBE. Comparison of the identified FBE sequences suggests that certain residues are more important for binding. Specifically, the central AACA sequence is present most often in the identified sites. When this sequence is compared with a DNA-binding site data base (15), the core sequence is found in the binding sites of several unrelated transcription factors. The E-box element, which is bound by the myogenic factors E2A and myogenin (16–19), and the cognate binding site for the Forkhead family of transcription factors (20, 21) both have an AACA sequence within their consensus binding sites. Also, the transcriptional intermediary factor-2 (TIF-2)-binding site (MRAACA), which is important for thyroid gene regulation, also contains the core sequence (22). All of these proteins belong to distinct classes of DNA-binding proteins and share no homology with FAC1, but their recognition of a similar sequence suggests that they may compete for binding to the FBE.
Fig. 1. Alignment of representative DNA sequences obtained in the PCR-assisted binding site selection assay showing the identified consensus sequence.

The identified consensus site is listed at the top with the alignment of representative sequences listed underneath. The percentage of the 24 isolated clones containing a specific nucleotide is listed above the indicated consensus base. A core sequence of AACA is present in the majority of identified sequences.
FAC1 Specifically Recognizes the FBE in an EMSA
To confirm that the FBE was bound by FAC1 in a specific manner, 24-base pair double-stranded oligonucleotides were synthesized containing the FBE (Table I) for use as probes in competitive EMSA. Purified GST-FAC1-(1–398) was incubated with the labeled FBE by itself or with increasing concentrations of unlabeled specific competitor (30 and 100 ng of FBE) (Fig. 2A, lanes 2–4). The observed complexes were due to the presence of FAC1, as GST alone did not produce any specific complexes (data not shown). The presence of multiple bands was due to breakdown of the fusion protein. To further demonstrate specificity, FAC1 was incubated with a nonspecific DNA competitor. Although 30 ng of unlabeled FBE was able to compete for binding with the probe (Fig. 2A, compare lane 2 with lanes 3 and 4), an unrelated sequence (Table I) failed to compete for binding even with 300 ng of competitor (compare lane 2 with lanes 5 and 6). This demonstrates that FAC1 specifically recognizes the DNA sequence contained in the identified FBE.
Table I. Oligonucleotides used for EMSA and cloning.
Shown are the sequences of the oligonucleotide pairs annealed to form double-stranded DNA probes and competitor molecules for EMSA. Nucleotides mutated from the wild-type sequence are shown in boldface. The FBE site is underlined. The 3×FBE and 3×MTFBE oligonucleotides were annealed and cloned into the pGL-2 expression vector using appropriate restrictions sites that are present in the sequence or produced as overhangs when oligonucleotides are annealed (see “Experimental Procedures”).
| FBE-Fa | 5′-GGGGATCCACAACACGGATCCGG-3′ |
| FBE-R | 5′-CCGGATCCGTGTTGTGGATCCCC-3′ |
| MT1-F | 5′-GGGATCCGGAACACAGATCTGG-3′ |
| MT1-R | 5′-CCAGATCTGTGTTCCGGATCCCC-3′ |
| MT2-F | 5′-GGGGATCCACGGCACAGATCTGG-3′ |
| MT2-R | 5′-CCAGATCTGTGCCGTGGATCCCC-3′ |
| MT3-F | 5′-GGGGATCCACAAGGCAGATCTGG-3′ |
| MT3-R | 5′-CCAGATCTGCCTTGTGGATCCCC-3′ |
| APP-FBE-F | 5′-AAAAAGACACAGACAAGGCAGAACACTTTAGAG-3′ |
| APP-FBE-R | 5′-CTCTAAAGTGTTCTGCCTTGTCTGTGTCTTTTT-3′ |
| UNRELATED-F | 5′-GATCATTCAGGTCATGACCTGA-3′ |
| UNRELATED-R | 5′-GATCTCAGGTCATGACCTGAAT-3′ |
| 3×FBE-F | 5′-GATCGCACAACACGGCACAACACGGCACAACACGGATCCGTCGACC-3′ |
| 3×FBE-R | 5′-TCGAGGTCGACGGATCCGTGTTGTGCCGTGTTGTGCCGTGTTGTGC-3′ |
| 3×MTFBE-F | 5′-GATCGCGGAACACGGCGGAACACGGCGGAACACGGATCCGTCGACCGTAC-3′ |
| 3×MTFBE-R | 5′-GGTCGACGGATCCGTGTTCCGCCGTGTTCCGCCGTGTTCCGC-3′ |
F, forward; R, reverse; MT, mutant.
Fig. 2. Recombinant FAC1 specifically recognizes the identified FBE.

A, representative EMSA using 32P-labeled FBE oligonucleotides as probes and incubated with the FBE probe alone (lane 1), affinity-purified GST-FAC1-(1–398) (lane 2), GST-FAC1-(1–398) and unlabeled FBE competitor (30 ng excess) (lane 3), GST-FAC1-(1–398) and unlabeled FBE competitor (100 ng excess) (lane 4), GST-FAC1-(1–398) and unlabeled unrelated (Unrel.) competitor (100 ng excess) (lane 5), and GST-FAC1-(1–398) and unlabeled unrelated competitor (300 ng excess) (lane 6). FBE WT, wild-type FBE. B, mutation of the FBE results in decreased binding affinity. Shown is a representative EMSA using the FBE probe (lane 1) and affinity-purified GST-FAC1-(1–398) (lane 2), which compete for binding with three mutant FBE sites (mutants 1–3 (MT1–MT3)) (Table I) at 30, 100, and 300 ng of unlabeled oligonucleotide added (lanes 3–11). C, quantitation of mutant FAC1 competitors. The amount of unlabeled competitor is shown on the x axis and is plotted against the amount of DNA-protein complex at that concentration of competitor. The y axis values are presented as a percentage of DNA-FAC1 complex when no competitor is added. The values shown are an average of three experiments quantified by NIH Image Version 1.5.8 software. Wild-type competitor (open squares), mutant 1 (open diamonds), mutant 2 (open circles), mutant 3 (open triangles), and unrelated competitor (hatched squares) are shown.
To determine which base pairs contributed to specific DNA recognition, double-stranded oligonucleotides with point mutations introduced pairwise throughout the FBE (Table I) were synthesized and used as unlabeled competitor in an EMSA (a representative gel is shown in Fig. 2B). None of the mutants competed for DNA binding as well as the wild-type FBE. However, mutant 2 (an AA → GG change at base pairs 4 and 5) required 100-fold more competitor to compete away 42% of the DNA-binding activity as compared with the wild-type competitor (Fig. 2, B, lanes 6–8; and C, open circles). This is interesting because the middle two adenine residues were present in 94% of the identified sites, further implicating their requirement for FAC1 recognition (Fig. 1). Mutant 1 did not efficiently compete for >50% DNA binding even at 300 ng of competitor (Fig. 2, B, lanes 3–5; and C, open diamonds). Mutant 3 required 10-fold more DNA than the wild type to compete for 50% of the DNA binding, which was about the same as the unrelated sequence (Fig. 2, B, lanes 9–11; and C, open triangles). These studies demonstrate that the identified site is bound specifically by FAC1 and that the nucleotides identified are essential for optimal DNA-protein complex formation.
Cellular FAC1 Recognizes the FBE
Next, we wanted to demonstrate that endogenous, full-length FAC1 also recognized the identified FBE. By Western analysis, we found that FAC1 was present at various levels in a number of cell lines tested (Fig. 3A). FAC1 expression was highest in nuclear extracts from the human neuroblastoma cell line MSN-2. It was also present in nuclear extracts from rodent pheochromocytoma PC12 cells and green monkey kidney COS cells (Fig. 3A). However, no expression was detected in either nuclear or cytosolic extracts from murine NIH3T3 fibroblasts. The abundance of FAC1 seen in nuclear extracts was reflected in the amount of DNA-protein complex formed in an EMSA (Fig. 3B). MSN-2 nuclear extracts produced the most FBE-binding activity, whereas PC12 nuclear extracts had reduced amounts of FBE complex. NIH3T3 nuclear extracts produced no observable DNA-protein complex (Fig. 3B). These data suggest that the observed FBE-protein complex is in the same relative abundance as FAC1. Fig. 3 also demonstrates that rodent FAC1 migrated slightly faster in an EMSA, which is likely due to the slight difference in size and amino acid composition of rodent FAC1 (Fig. 3B).2 To demonstrate that the observed FBE-protein complex has the same binding specificity as recombinant FAC1, nuclear extracts from all the cell lines expressing FAC1 were used in competition EMSAs. A single DNA-protein complex was observed in all the cell lines tested (Fig. 3, C and D). The wild-type FBE competed at 30 ng of unlabeled DNA in PC12, MSN-2, and COS cells (Fig. 3, C and D). Mutants 1–3 competed for binding in the observed complex only when 300 ng of competitor was added to PC12 nuclear extracts (Fig. 3C). The FBE-binding protein from COS and MSN-2 extracts exhibited the same binding specificity as demonstrated for PC12 cell extracts (data not shown). This suggests that the cellular protein contained in the observed complex has the same binding specificity as recombinant FAC1.
Fig. 3. Endogenous FAC1 specifically recognizes the identified FBE.

A, immunoblot for FAC1 in cytosolic (cyto) and nuclear (nuc) extracts from the indicated cell lines. B, EMSA with 30 μg of MSN-2 (lane 2), PC12 (lane 3), and NIH3T3 (lane 4) nuclear extracts, each with 3 μg of salmon sperm DNA. Lane 1 is probe alone. C, representative EMSA using the FBE as a probe (lane 1) and 12 μg of PC12 nuclear extracts plus 1 μg of salmon sperm DNA (lanes 2 and 12). The indicated unlabeled competitors were added at 30, 100, and 300 ng. MT1–MT3, mutants 1–3. D, representative EMSA using the FBE as a probe with nuclear extracts from MSN-2 cells (left panel, lane 1) and COS cells (right panel, lane 1). Wild-type competitors (WT) were added at 30 and 100 ng (lanes 2 and 3 in each panel). The autoradiographs shown in C and D were exposed for different lengths of time so as not to exceed the linear range of the film and demonstrate that the binding specificity is the same in all the cell lines. They are not meant to reflect the relative quantities of FAC1 present in each of the cell lines, and each experiment was performed at least three times.
To further establish that the protein recognizing the FBE in these cell lines is indeed FAC1, we transfected NIH3T3 fibro-blasts (which do not express FAC1 by Western analysis or EMSA) with a human FAC1 expression vector. By immunoblotting, FAC1-transfected NIH3T3 cells expressed FAC1 in the nuclear fraction similar to MSN-2 cells (data not shown). Nuclear extracts from FAC1-transfected NIH3T3 cells produced a DNA-protein complex in an EMSA not seen in untransfected NIH3T3 cells (Fig. 4A, lanes 2 and 3). The new complex observed in the FAC1-transfected NIH3T3 extracts was dependent upon FAC1 expression and is likely to contain FAC1. When analyzed on the same gel alongside MSN-2 nuclear extracts, the complex from FAC1-transfected NIH3T3 cell extracts migrated with the same characteristics as the complex observed in MSN-2 cells (Fig. 4A, lanes 1 and 3). This suggests that the complex characterized in MSN-2 cells behaves the same as the FBE complex from FAC1-transfected cells, providing indirect evidence that the FBE-protein complex contains FAC1. PT67 cells transfected with FAC1 exhibited far more DNA-binding activity than mock-transfected PT67 cells (Fig. 4B, lanes 2 and 3). Transfected FAC1 behaved the same as endogenous FAC1 in these cells as it was competed by the wild-type FBE, but not by an unrelated sequence (Fig. 4B, lanes 4 and 5). This further suggests that the binding activity observed in these cells is a direct result of FAC1 expression and that the FBE complex contains FAC1. Since our current antibodies do not recognize native FAC1 protein, we were unable to perform a supershift assay; however, these data highly suggest that the FBE-binding activity in the various cell lines is a direct result of FAC1-FBE interaction.
Fig. 4. DNA-protein complexes contain a protein with the same properties as FAC1.

A, EMSA with 30 μg of nuclear extracts (nuc) from MSN-2 cells (lane 1), NIH3T3 cells (lane 2), and NIH3T3 cells transfected with a FAC1 expression vector (lane 3). B, EMSA with 30 μg of nuclear extracts from PT67 cells (lane 2) compared with PT67 cells transfected with a FAC1 expression vector (lanes 3–5). 100 ng each of unlabeled wild-type (WT) and unrelated (Unrel.) competitors was added.
FAC1 Is a Transcriptional Regulator
To determine if FAC1 is able to alter transcription when bound to the identified FBE, we cloned three FBEs at 10-base pair intervals (3×FBE) upstream of the luciferase reporter gene. 3×FBE was cloned proximal to the transcription initiation site (promoter) in the context of the SV40 promoter and enhancer elements to test if FAC1 can repress transcription of an active promoter through the FBE site (Fig. 5A, FBE-P). The site was also cloned distal to the transcription initiation site (enhancer region) to determine if FAC1 can repress transcription at a distance from the transcription initiation site (Fig. 5A, FBE-E). Each of these reporter plasmids was cotransfected into NIH3T3 cells with and without a FAC1 expression vector. When FAC1 was co-transfected into NIH3T3 cells with an FBE-containing reporter plasmid, there was a dramatic decrease in transcriptional activity from both promoter and enhancer constructs (Fig. 5B). When FBE sites in the promoter or enhancer region were changed to correspond to mutant 1 (Table I) sequences (MT-P and MT-E, respectively), there was only a 3-fold reduction in activity as opposed to the 30-fold reduction seen with wild-type FBE sites (Fig. 5B). This is consistent with the 10-fold reduction in binding affinity for this site as shown by EMSA (Fig. 2, B and C). Taken together, these data suggest that FAC1 acts as a potent repressor of the SV40 promoter in NIH3T3 cells and that this repression occurs through FAC1 interaction with the FBE.
Fig. 5. FAC1 represses transcription through the FBE.

A, shown are the SV40 reporter constructs used in the cotransfection experiments. bp, base pairs. B, NIH3T3 cells were transfected with 4 μg of reporter plasmid: SV40 control (SV40), 3×FBE in the promoter (FBE-P), 3×FBE in the enhancer (FBE-E), 3×MTFBE in the promoter (MT-P), and 3×MTFBE in the enhancer (MT-E). Each reporter was cotransfected with 0.3 μg of FAC1 expression vector or control expression vector. The results shown are each reporter construct cotransfected with FAC1 and represent an average of six separate experiments. The results are presented as a percent ratio of reporter without FAC1. S.D. is indicated by the error bars.
DISCUSSION
FAC1 represents a novel member of the PHD/LAP zinc finger family that is developmentally regulated in human brain and that changes localization between the nucleus and cytoplasm of cells. To functionally characterize FAC1, we have identified the DNA sequence recognized by the amino terminus of FAC1. The identified sequence (CACAACAC) is not recognized as the consensus site for any other characterized transcription factor. However, the core sequence (AACA) is present in the consensus site for several unrelated DNA-binding proteins. This suggests that FAC1 may compete with other transcription factors for binding to its consensus site. Pairwise mutations of the 6 central base pairs reduced the ability of FAC1 to recognize the FBE, confirming that the identified site is indeed the FAC1-binding element. Using nuclear extracts from both neuronal and non-neuronal FAC1-expressing cell lines, we have demonstrated that FAC1 produced in mammalian cells forms a specific complex with the FBE. Therefore, the identified site is preferentially recognized by FAC1 over other proteins present in the nucleus.
Since the majority of the FAC1 amino acid sequence has minimal homology to other known proteins, its DNA-binding motif will likely be novel. The presence of the PHD/LAP zinc finger, a motif seen in many proteins known to regulate gene expression, implicates FAC1 in regulation of gene expression. Several members of the PHD/LAP zinc finger family contain domains necessary for interaction with and reorganization of heterochromatin (2, 3), suggesting an ability to alter gene expression by physically altering the chromatin structure. The PHD/LAP zinc finger domain has been suggested to act as a protein-protein interaction domain. We propose that this family of proteins, which diverges significantly outside of the common zinc finger motif, forms large multiprotein complexes that modulate gene expression. Genes modulated by this complex would depend on family members that contain DNA-binding domains to direct complex formation to specific regions of chromatin. Specific PHD/LAP family members would be responsible for rearranging chromatin structure or interacting with the basal transcription machinery, ultimately altering target gene expression. The ability of FAC1 to specifically bind DNA and its unique expression pattern in development, specifically in the central nervous system, suggest that it may be responsible for recruiting the chromatin-reorganizing complex to promoters specific for neuronal differentiation.
FAC1 transcriptional regulation through the identified DNA-binding site was demonstrated by cotransfection of FAC1 and reporter plasmids containing the FBE in NIH3T3 cells. Multiple FBEs upstream of a reporter gene renders the promoter FAC1-responsive. In response to FAC1, transcription from an FBE-containing promoter is repressed dramatically. This repression is seen whether the cognate binding site is proximal or distal to the transcription initiation site. These data suggest that FAC1 can regulate transcriptional activity over a distance from the transcription start site. We have identified the presence of multiple FBEs in the transcriptional regulatory regions of several genes implicated in neuronal development and degeneration. Two proteins implicated in Alzheimer’s disease, APP and the presenilin-1 gene, contain several FBE sites in their distal enhancer regions (Fig. 6) (23).3 The dopamine D2 receptor and Cu2+, Zn2+-superoxide dis-mutase-1 genes also contain FBE sites in their regulatory regions (Fig. 6) (25, 26).4 This site is not present in all promoters. FBE promoter selectivity is demonstrated by its presence only in the dopamine D2 receptor regulatory region, but not other dopamine receptor family members. Since these elements are usually found 1–3 kilobase pairs from the transcription initiation site, they are likely enhancer elements. This suggests that FAC1 may potentially regulate expression of subsets of genes that are important for neuronal development, survival, and degeneration.
Fig. 6. Several endogenous promoters contain FAC1-binding elements.
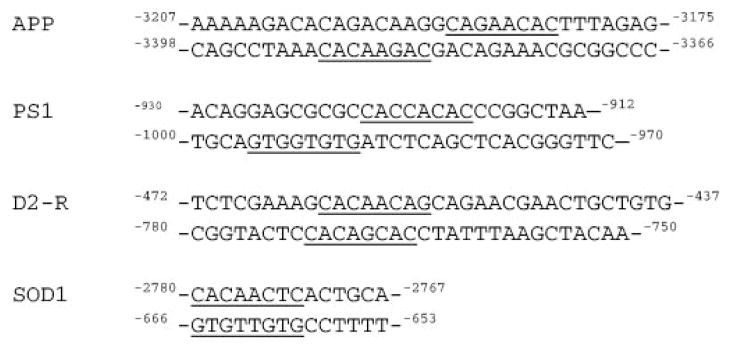
Shown are DNA sequences containing potential FAC1-binding sites from regulatory regions of the APP gene, presenilin-1 (PS1), the dopamine receptor (D2-R), and Cu2+, Zn2+-superoxide dis-D2 mutase-1 (SOD1). The potential FAC1-binding site is underlined, and the nucleotide positions are indicated.
FAC1 DNA-binding activity is phosphorylation-dependent (27), suggesting that FAC1 transcriptional regulatory activity is modulated by cellular kinases and phosphatases. When FAC1 is phosphorylated and in the nucleus, it binds DNA and down-regulates expression of target genes. However, in response to neuronal injury, FAC1 localizes to the cytoplasm, where it is no longer in contact with DNA. Removal of FAC1 from the nucleus would alleviate its target promoters of its regulatory effects. Since FAC1 is also present in the cytoplasm of neurons during development, it is possible that alleviation of FAC1 regulatory activity results in changes in expression of genes needed for neurite elongation and neuronal differentiation. There is evidence that the APP gene product contributes to neurite elongation, cell survival, and neurodegeneration (28–30). APP is required for neurite guidance during development (28). When correctly processed, soluble APP protects neurons from death (29). However, during Alzheimer’s disease, APP is alternatively processed to the β-amyloid peptide that forms an insoluble, extracellular aggregate (30). β-Amyloid deposition leads to the formation of amyloid plaques and neuronal degeneration. FAC1 is localized to the dystrophic neurites and neuritic components within β-amyloid-containing plaques (24). In these degenerating neurons, FAC1 is no longer in the nucleus and therefore no longer alters expression of target genes potentially including APP. Our data suggest the following model. Translocation of FAC1 to the cytoplasm will alleviate FAC1 repression from promoters containing FBEs, which may include the APP promoter, causing local changes in APP expression. If APP expression is increased and incorrectly processed to β-amyloid, further amyloid deposition would occur.
The identification of FAC1 as a site-specific DNA-binding protein that regulates transcription provides a starting point to study the involvement of this novel protein in neuronal development and disease. Much work remains to define the pathways leading to changes in FAC1 localization and whether protein redistribution results in changes in gene expression. Since several of the promoters that contain FAC1-binding sites are implicated in development and Alzheimer’s disease, it will be interesting to study the effect FAC1 has on their expression in the context of the other transcriptional regulators, especially during neurodegeneration. We will continue to characterize the role of FAC1 in transcriptional regulation by looking at its effect on endogenous promoters and by determining the specific amino acids required for DNA-binding activity and transcriptional regulation.
Acknowledgments
We thank Drs. David J. Hall and Joseph Locker for sage advice and critical review of this manuscript. We thank John Caltagarone for technical support.
Footnotes
This work was supported by National Institutes of Health Grants AG13208, NS10572, and AG05133.
The abbreviations used are: FAC1, fetal Alz-50 clone 1; PHD/LAP, plant homeodomain/leukemia-associated protein; FBE, FAC1-binding element; APP, amyloid precursor protein; PCR, polymerase chain reaction; GST, glutathione S-transferase; EMSA, electrophoretic mobility shift assay.
K. L. Jordan-Sciutto, J. M. Dragich, J. L. Rhodes, and R. Bowser, unpublished observations.
Mitsuda, N., Boteva, K., Gilbert, J., Roses, A., and Vitek, M. (1997) GenBank™/EBI accession number AF029701.
References
- 1.Zhu P, Bowser R. Biochim Biophys Acta. 1996;1309:5–8. doi: 10.1016/s0167-4781(96)00127-3. [DOI] [PubMed] [Google Scholar]
- 2.Saha V, Chaplin T, Gregorini A, Ayton P, Young B. Proc Natl Acad Sci U S A. 1995;92:9737–9741. doi: 10.1073/pnas.92.21.9737. [DOI] [PMC free article] [PubMed] [Google Scholar]
- 3.Aasland R, Gibson TJ, Stewart AF. Trends Biol Sci. 1995;20:56–59. doi: 10.1016/s0968-0004(00)88957-4. [DOI] [PubMed] [Google Scholar]
- 4.Mazo A, Huang D, Mozer B, Dawid I. Proc Natl Acad Sci U S A. 1990;87:2112–2116. doi: 10.1073/pnas.87.6.2112. [DOI] [PMC free article] [PubMed] [Google Scholar]
- 5.Schindler U, Beckman H, Cashmore A. Plant J. 1993;4:137–150. doi: 10.1046/j.1365-313x.1993.04010137.x. [DOI] [PubMed] [Google Scholar]
- 6.Peterson C, Dingwall A, Scott M. Proc Natl Acad Sci U S A. 1994;91:2905–2908. doi: 10.1073/pnas.91.8.2905. [DOI] [PMC free article] [PubMed] [Google Scholar]
- 7.Franke A, DeCamillis M, Zinc D, Cheng N, Brock HW, Paro R. EMBO J. 1992;11:2941–2950. doi: 10.1002/j.1460-2075.1992.tb05364.x. [DOI] [PMC free article] [PubMed] [Google Scholar]
- 8.Bowser R, Giambrone A, Davies P. Dev Neurosci. 1995;17:20–37. doi: 10.1159/000111270. [DOI] [PubMed] [Google Scholar]
- 9.Mu X, Springer JE, Bowser R. Exp Neurol. 1997;146:17–24. doi: 10.1006/exnr.1997.6508. [DOI] [PubMed] [Google Scholar]
- 10.Xiang M, Zhou L, Macke JP, Yoshioka T, Hendry SH, Eddy RL, Shows TB, Nathans J. J Neurosci. 1995;15:4762–4785. doi: 10.1523/JNEUROSCI.15-07-04762.1995. [DOI] [PMC free article] [PubMed] [Google Scholar]
- 11.Ausubel FM, Brent R, Kingston RE, Moore DD, Seidman JG, Smith JA, Struhl K. In: Current Protocols in Molecular Biology. Janssen K, editor. Vol. 2. John Wiley & Sons, Inc; New York: 1994. pp. 12.11.1–12.11.8. [Google Scholar]
- 12.Jordan KL, Evans DL, Steelman S, Hall DJ. Biochemistry. 1996;35:12320–12328. doi: 10.1021/bi9611927. [DOI] [PubMed] [Google Scholar]
- 13.Jordan KL, Haas AR, Logan TJ, Hall DJ. Oncogene. 1994;9:1177–1185. [PubMed] [Google Scholar]
- 14.Logan T, Jordan K, Evans D, Hall D. J Cell Biochem. 1997;64:1–12. [PubMed] [Google Scholar]
- 15.Locker J. In: Essential Data Series: Transcription Factors. Rickwood D, Hames BD, editors. John Wiley & Sons Ltd; Chichester, West Sussex, United Kingdom: 1996. pp. 12–55. [Google Scholar]
- 16.Jacobs Y, Vierra C, Nelson C. Mol Cell Biol. 1993;13:7321–7333. doi: 10.1128/mcb.13.12.7321-7333.1993. [DOI] [PMC free article] [PubMed] [Google Scholar]
- 17.Voronova A, Lee F. Proc Natl Acad Sci U S A. 1991;91:5952–5956. doi: 10.1073/pnas.91.13.5952. [DOI] [PMC free article] [PubMed] [Google Scholar]
- 18.Edmondson D, Olsen E. J Biol Chem. 1993;268:755–758. [PubMed] [Google Scholar]
- 19.Weintraub H. Cell. 1993;75:1241–1244. doi: 10.1016/0092-8674(93)90610-3. [DOI] [PubMed] [Google Scholar]
- 20.Overdier D, Porcella A, Costa R. Mol Cell Biol. 1994;14:2755–2766. doi: 10.1128/mcb.14.4.2755-2766.1994. [DOI] [PMC free article] [PubMed] [Google Scholar]
- 21.Kaufmann E, Hoch M, Jackle H. Eur J Biochem. 1994;223:329–337. doi: 10.1111/j.1432-1033.1994.tb18998.x. [DOI] [PubMed] [Google Scholar]
- 22.Zollman S, Godt D, Prive G, Couderc J, Laski F. Proc Natl Acad Sci U S A. 1994;91:10717–10721. doi: 10.1073/pnas.91.22.10717. [DOI] [PMC free article] [PubMed] [Google Scholar]
- 23.Salbaum J, Weidemann A, Lemaire H, Masters C, Beyreuther K. EMBO J. 1988;7:2807–2813. doi: 10.1002/j.1460-2075.1988.tb03136.x. [DOI] [PMC free article] [PubMed] [Google Scholar]
- 24.Schoonover S, Davies P, Bowser R. J Neuropathol Exp Neurol. 1996;55:444–455. doi: 10.1097/00005072-199604000-00007. [DOI] [PubMed] [Google Scholar]
- 25.Minowa T, Minowa M, Mouradian M. Biochemistry. 1992;31:8389–8396. doi: 10.1021/bi00151a001. [DOI] [PubMed] [Google Scholar]
- 26.Kim H, Kim Y, Nam J, Lee H, Rho H, Jung G. Biochem Biophys Res Commun. 1994;201:1526–1533. doi: 10.1006/bbrc.1994.1877. [DOI] [PubMed] [Google Scholar]
- 27.Jordan-Sciutto K, Dragich J, Bowser R. Biochem Biophys Res Commun. 1999;260:785–789. doi: 10.1006/bbrc.1999.0986. [DOI] [PubMed] [Google Scholar]
- 28.Pierce JES, Trojanowski JQ, Graham DI, Smith DH, McIntosh TK. J Neurosci. 1996;16:1083–1090. doi: 10.1523/JNEUROSCI.16-03-01083.1996. [DOI] [PMC free article] [PubMed] [Google Scholar]
- 29.Goodman Y, Mattson MP. Exp Neurol. 1994;128:1–12. doi: 10.1006/exnr.1994.1107. [DOI] [PubMed] [Google Scholar]
- 30.Roberson MR, Harrell LE. Brain Res Rev. 1997;25:50–69. doi: 10.1016/s0165-0173(97)00016-7. [DOI] [PubMed] [Google Scholar]