
Fig. 8. Neutrophil chemotactic protein expression after induction LPS tolerance.
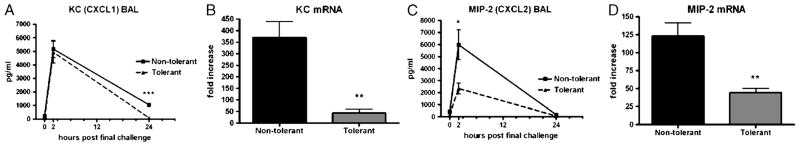
A, Bronchoalveolar lavage KC (CXCL1) concentrations at the indicated time points post–final challenge and (B) lung tissue KC (CXCL1) mRNA expression 1 h post–final challenge. C, Bronchoalveolar lavage MIP-2 (CXCL2) concentrations at the indicated time points post–final challenge and lung tissue MIP-2 (CXCL2) mRNA expression (D) 1 h post–final challenge. Zero-hour samples were harvested immediately before the final LPS challenge. mRNA data are expressed as fold increase above naïve mice and are represented as mean ± SEM (n = 6–10 mice per group). *P < 0.05 and **P < 0.01 compared with the nontolerant group.