Abstract
Drying characteristics of sour cherries were determined using microwave vacuum drier at various microwave powers (360, 600, 840, 1200 W) and absolute pressures (200, 400, 600, 800 mbars). In addition, using the artificial neural networks (ANN), trained by standard Back-Propagation algorithm, the effects of microwave power, pressure and drying time on moisture ratio (MR) and drying rate (DR) were investigated Based on the evaluation of experimental data fitting with semi-theoretical and empirical models, the Midilli et al. model was selected as the most appropriate one. Furthermore, the ANN model was able to predict the moisture ratio and drying rate quite well with determination coefficients (R2) of 0.9996, 0.9961 and 0.9958 for training, validation and testing, respectively. The prediction Mean Square Error of ANN was about 0.0003, 0.0071 and 0.0053 for training, validation and testing, respectively. This parameter signifies the difference between the desired outputs (as measured values) and the simulated values by the model. The good agreement between the experimental data and ANN model leads to the conclusion that the model adequately describes the drying behavior of sour cherries, in the range of operating conditions tested.
Keywords: Microwave–vacuum dryer, Sour cherry, Artificial neural networks
Introduction
Sour cherries occupy the Cerasus subgenus within Prunus, being fairly distinct from plums, apricots, peaches and almonds. They are members of the Rosaceae family. Sour cherries are found in Asia, Europe and North America and may be consumed fresh or as dried fruit (Doymaz 2005). Drying of fruits, allows long-term storage as well as diversification of flavours and texture available for the consumer to choose for example rapeseed (Kumar et al. 2010), pepper (Olumuyiwa and Oyedele 2010) and aonla (Prajapati et al.2010).
In microwave dryers, electromagnetic energy is directly converted to kinetic energy of water molecules. Therefore, heat is produced within the product, and energy transfer is not affected by transfer impediments especially in viscous materials. As microwaves can penetrate into the material and save energy, in this method heat can be produced in the whole volume of the material, the rely increasing drying rate (Krulis et al.2005).
The use of vacuum in drying can be a good approach to improve the quality of the product due to facilitating moisture removal. The reduction in pressure causes the expansion and escape of gas occluded into pores (Sagar and Suresh Kumar 2010). Vacuum application or pressure decrease can reduce drying temperature and therefore improve the qualitative features of food (Kompany et al.1993; Jaya and Das 2003).
Amongst the major concerns about non-uniform heating by microwaves, the possibility of tissue destruction and limits of microwaves penetration into the internal structure of foodstuffs can be noted (Zhang et al.2006), while one of the advantages of using microwave energy is the ability to combine several drying methods. Microwave can be combined with vacuum drying (Schubert and Regier 2005: Abbasi and Azari 2009). This combined approach has the benefits of both vacuum and microwave drying methods, and can improve energy efficiency and product quality (Li et al.2007; Abbasi and Azari 2009). Lack of oxygen in the environment and reduction of unwanted reactions in food is another advantage of this method (Drouzas and Schubert 1996).
Microwave-vacuum drying is a relatively new technique for the conservation of fruits and vegetables, resulting in products with improved texture and color (Kaensup et al. 2002). In this regard, the researchers have conducted a number of researches on strawberry (Kaensup et al. 2002), carrot slice (Zheng-Wei et al. 2004a, b), mint leaves (Therdthai and Zhou 2009), button mushroom (Giri and Suresh 2007), garlic cloves (Figiel 2009; 2010), potatoes (Bondaruk et al. 2007), onions (Abbasi and Azari 2009). Drying characteristics and energy requirement for drying of cornelian cherry fruits has already reported (Koyuncu et al. 2007). Furthermore, it has been reported that microwave-vacuum drying significantly reduced the total time of drying and decreased drying shrinkage in comparison with convective method (Figiel 2009; 2010).
Artificial neural networks (ANN) as a novel approach has been successfully used to solve a wide variety of problems in science and engineering, particularly for some areas where the conventional modeling methods fail. A well-trained ANN can be used as a predictive model for a specific application, which is a data-processing system inspired by biological neural system (Hertz et al.1991). Neural networks as an approximation approach has been also used for the prediction of microwave-vacuum for Tomato Slices (Poonnoy et al.2007) and hot air dryer pomegranate arils (Motevali et al. 2010) tomato drying (Movagharnejad and Nikzad 2007). Therefore, the objectives of this study were as follows:
Investigation of the drying behavior of sour cherries
Comparison of artificial neural network and mathematical model for describing the drying behavior of sour cherries
Determination of energy consumption and specific energy consumption for drying sour cherries
Material and methods
Materials
A batch of fresh sour cherry was purchased from local market (Tehran-Iran). Before drying, the fruit weight was determined by means of an electronic balance (Tecator, model 610, France) with accuracy of 0.0001. Initial moisture content of sour cherries was determined using oven drying method. For doing so, some 20 g of sour cherries were kept in an electric oven at 105 ± 1 °C for about 8 h until no significant difference occurred between two consecutive weightings (Motevali et al. 2010). All the tests were replicated 5 times. The mean value of initial moisture content of sour cherries was about 72.98% on the wet basis.
Experimental microwave–vacuum drying
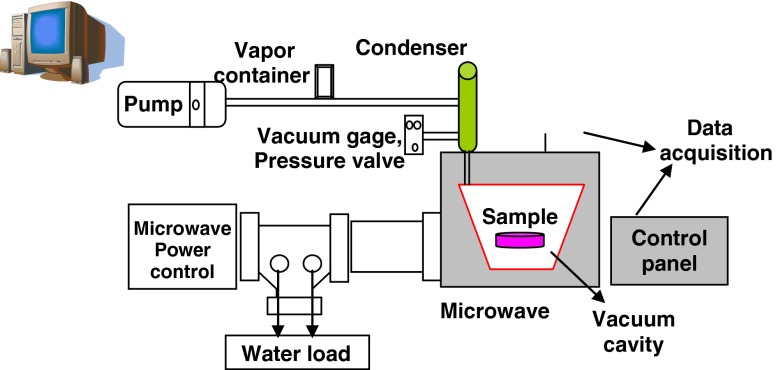
Schematic description of the laboratory equipment utilized to dry samples is given in Fig. 1. Kawake Airvac vacuum pump (model jp-120h, Taiwan) was selected for providing the desired absolute pressure. A domestic microwave oven (AEG, Micromat 725, Germany) was used for the drying and A PVR 0606A81 vacuum gauge was used for monitoring purposes. Samples were subjected to microwave–vacuum drying. Microwave–vacuum drying experiments were carried out at four levels of microwave powers (360, 600, 840 and 1200 W) and four levels of absolute pressure (200, 400, 600 and 800 mbar). Three replicates were carried out for each experiment and the mean values were determined and reported in this study. Moisture content of the dried sample at the end of every drying period was determined based on the loss of weight with respect to the initial moisture content (Abbasi and Azari 2009).
Fig. 1.
Schematic description of the laboratory equipment used for drying
Determination of moisture ratio, drying rate and mathematical modelling
Moisture ratio values for sour cherry arils were calculated using the following equation (Motevali et al. 2010):
 |
1 |
where MR is moisture ratio (dimensionless), Mt is the moisture content at any time (kg water/kg solids), Me is equilibrium moisture content (kg water/kg solids) and M0 is initial moisture content. As Me is much lower than M0 and Mt, it is negligible (Diamante and Munro 1991), then the equation simplified as follows:
 |
2 |
Drying curves were fitted with ten different moisture ratio models (Table 1). These models are generally derived by simplifying the general series solutions of Fick’s second law and considering a direct relationship between the average water content and drying time (Doymaz 2004).
Table 1.
Models used for fitting of experimental data
| Reference | Model Name | Model | Number |
|---|---|---|---|
| (Lewis 1921) | Newton | MR = exp (-kt) | (1) |
| (Henderson and Pabis 1961) | Henderson and Pabis | MR = a exp(-kt) | (2) |
| (Page 1949) | Page | MR = exp(-ktn) | (3) |
| (Yagcioglu, et al. 1999) | Logarithmic | MR = a exp(-kt) + c | (4) |
| (Henderson 1974) | Two term | MR = a exp(k0t) + bexp(k1t) | (5) |
| (Yaldiz and Ertekin 2001) | Approximation of diffusion | MR = a exp(-kt) + (1-a)exp(-kbt) | (6) |
| (Sharaf-Eldeen, et al. 1980) | Two-term exponential | MR = a exp(-kt) + (1-a)exp(-kat) | (7) |
| (Menges and Ertekin 2005) | Midili |  |
(8) |
| (Verma et al.1985) | Verma et al. |  |
(9) |
| (Wang et al.2007) | Modified page |  |
(10) |
| (Chen and Wu 2001) | Wang and singh |  |
(11) |
Three different criteria were used for evaluation of the best fitting: correlation coefficient, R2; chi square, χ2; and Root Mean Square Error, RMSE.
 |
3 |
 |
4 |
 |
5 |
MRexp,i is the ith moisture ratio relative humidity value determined experimentally, MRpre,i is the ith predicted moisture ratio value, N the number of observations and m the number of drying constants. The most suitable model for describing drying characteristics of cherries would be a model with the highest R2 and the lowest χ2 and RMSE values. The R2, χ2 and RMSE values are between 0 and 1.
Drying rate of sour cherry arils was also calculated using the following eq. (Akpinar et al. 2003)
 |
6 |
where (Mt+dt) is moisture content at time (t + dt) (kg water/kg dry matter), Mt is moisture content at time t (kg water/kg dry matter) and t is drying time (min).
Calculation of energy consumed by microwave oven and vacuum pump
Energy consumption in microwave oven can be calculated using this equation:
 |
7 |
where Et indicates the total energy consumed in each drying cycle (kW.h), P microwave output power (kW) and t drying time (h) (Ozkan et al.2007):
For calculation of energy consumption by the vacuum pump the following equation was used
 |
8 |
E1 represents power consumed by the pump (kWh), L nominal pump power (kW) and t drying time (h).
In order to calculate the energy consumption in the combined microwave-vacuum dryer the sum of Eqs. 7 and 8 was used. In addition, the Eq. 9 was used for calculation of energy consumed for drying one kilogram of sour cherry.
 |
9 |
Ekg is specific energy required and W0 is initial weight of experimental sample. Initial weight of sample for drying sour cherries was 30 g.
Artificial neural network design
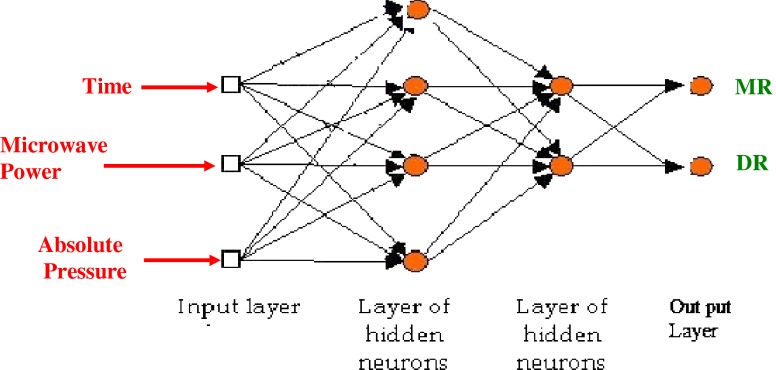
To obtain the best prediction by the network, several architectures were evaluated and trained using the experimental data. The back-propagation algorithm was utilized in training of all ANN models. This algorithm uses the supervised training technique where the network weights and biases are initialized randomly at the beginning of the training phase. The error minimization process is achieved using a gradient descent rule. There were three inputs and four output parameters in the experimental tests. The three input variables were time (in minute) microwave power levels (in Watts), and absolute pressure (in mbars). The two outputs for evaluating dryer performance were MR and DR. Therefore the input layer consisted of 3 neurons and the output layer had 2 neurons (Fig. 2).
Fig. 2.
Configuration of multilayer neural network for predicting MR (Moisture Ratio) and DR (Drying Rate)
Table 2 shows the summary of input and output ranges. The number of hidden layers and neurons within each layer can be designed based on the complexity of the problem and data set. In this study, the number of hidden layers varied from one to two. To ensure that each input variable provides an equal contribution to the ANN, the inputs of the model were preprocessed and scaled into a common numeric range [-1,1]. The activation function for the hidden layer was selected to be log (logarithmic). Tan. (Tangent) function suited best for the output layer. This arrangement of functions in function approximation problems or modeling is common and yields better results. However, many other networks with several functions and topologies were examined. Three criteria were employed to evaluate the networks and select the optimum one. The training and testing performance (MSE) was chosen to be .00001 for all ANNs. The complexity and size of the network was also important, so the smaller ANNs had the priority to be selected. To ensure that each input variable provides an equal contribution to the ANN, the inputs of the model were preprocessed and normalized, after which, 65% and 25% of 150 input patterns were devoted to training and validation data sets, respectively (Motevali et al. 2010).
Table 2.
Summary of input and output ranges
| Inputs | Parameters | Unit | Levels | |||
| 1 | Time* | min | 0 ~ 80 | |||
| 2 | Power | Watt | 360 | 600 | 840 | 1200 |
| 3 | Vacuum (pressure) | mbar | 200 | 400 | 600 | 800 |
| Outputs | ||||||
| 1 | MR (Moisture Ratio) | % | 0.1 ~ 1 | |||
| 2 | DR (Drying Rate) | g/min | 5 ~ 0 | |||
* Time limits were between 0 to 80 min, by interval 3 min
Finally, a regression analysis between the network response and the corresponding targets was performed to investigate the network response in more detail. Different training algorithms were also tested and finally Levenberg-Marquardt (trainlm) was selected. The computer program MATLAB R2008a, neural network toolbox was used for ANN design.
Results and discussion
Drying behavior and mathematical modelling
Figure 3 shows how moisture content of sour cherries decreased with increasing drying time under various drying conditions. At the beginning of the drying process, sour cherries with average initial moisture content of 72.98% wet basis (W.B.) were dried. As can be seen, all curves have two stages. The moisture ratio rapidly reduces and then slowly decreases as drying progresses. Constant and falling rate periods change with drying time, microwave power and absolute pressure. It is clear from Fig. 3. that with increasing microwave power, moisture ratio decreases at all pressure levels. The time required to reduce the moisture content to any given level in microwave–vacuum drying depends on the microwave power level, being the highest at 360 W and lowest at 1200W. The time required for lowering the moisture ratio varied between 15 and 79 min depending on the microwave level. By comparison, similar sour cherry samples took 39, 51, 66 and 79 min at power of 360W. 35, 44, 47 and 64 min at power of 600 W. 24, 30, 40 and 54 min for 840W and 15, 25, 32 and 42 min at power of 1200 W. Thus, microwave–vacuum drying times depend on the power and pressure levels. It is evident that at the same power, with increasing pressure, drying time increases, and at constant pressure conditions, drying time decreases with increasing power. The drying rate (DR, g/min) under different microwave power and absolute pressure levels are given in Fig. 4. The maximum drying rates were approximately over the range of 4.5–5 g/min.
Fig. 3.
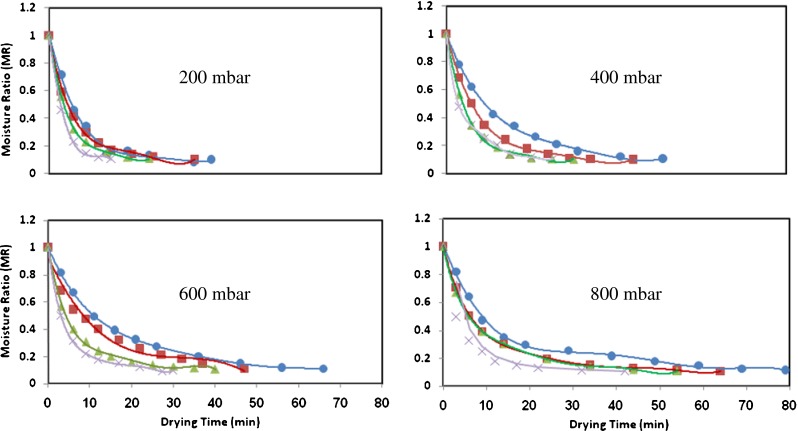
Effect of various microwave powers (●360W, ■ 600W, ▲ 840W and ×1200 W) on moisture ratio as a function of drying time for microwave-vacuum drying at different absolute pressures (n = 3)
Fig. 4.
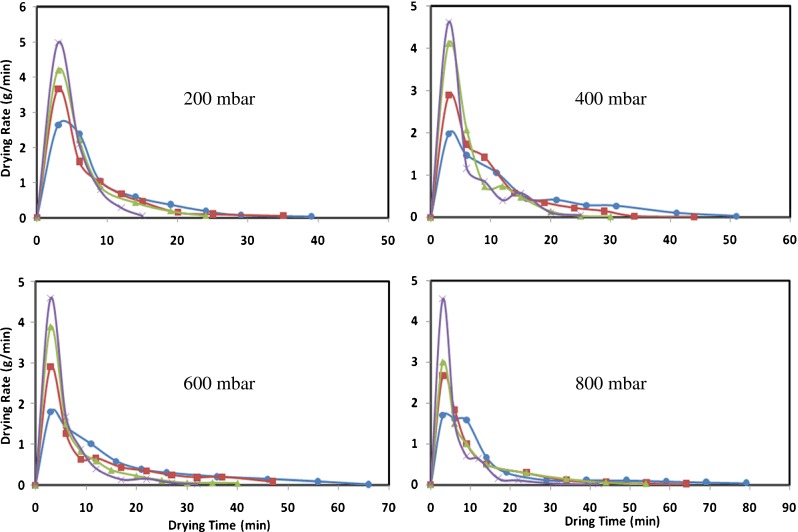
Effect of various microwave powers (●360W, ■ 600W, ▲ 840W and ×1200 W) on drying rate as a function of drying time for microwave-vacuum drying at different absolute pressures (n = 3)
Multiple regression analysis was performed using MATLAB software. The most suitable model for describing drying kinetics of sour cherries was selected based on the highest R2 and the lowest X2 and RMSE values. Comparison of R2, X2 and RMSE values showed that Midilli and coworkers' model was the most appropriate one for predicting the thin layer drying trend of sour cherries (Table 3).
Table 3.
Statistical coefficients and indices for different model in various microwave power at constant pressure (200 mbar)
| Power | 360 W | 600 W | 840 W | 1200 W | ||||||||
|---|---|---|---|---|---|---|---|---|---|---|---|---|
| Statistical coefficients | R2 | X2 | RMSE | R2 | X2 | RMSE | R2 | X2 | RMSE | R2 | X2 | RMSE |
| Model name | ||||||||||||
| Newton | 0.969 | 0.0547 | 0.0239 | 0.987 | 0.0370 | 0.0096 | 0.971 | 0.0224 | 0.0566 | 0.986 | 0.0108 | 0.0392 |
| Henderson and Pabis | 0.954 | 0.06238 | 0.03113 | 0.993 | 0.0244 | 0.00967 | 0.96 | 0.02756 | 0.06275 | 0.976 | 0.0168 | 0.0480 |
| Page | 0.968 | 0.0531 | 0.0282 | 0.995 | 0.0209 | 0.0039 | 0.975 | 0.0219 | 0.0494 | 0.975 | 0.0222 | 0.0491 |
| Logarithmic | 0.898 | 0.0929 | 0.0949 | 0.973 | 0.0502 | 0.0252 | 0.912 | 0.0819 | 0.0905 | 0.962 | 0.0352 | 0.0593 |
| Two term | 0.954 | 0.0624 | 0.0311 | 0.994 | 0.0244 | 0.0042 | 0.960 | 0.0276 | 0.0627 | 0.976 | 0.0162 | 0.0481 |
| Approximation of diffusion | 0.964 | 0.0562 | 0.0284 | 0.991 | 0.0299 | 0.0072 | 0.969 | 0.0252 | 0.0561 | 0.985 | 0.0120 | 0.0388 |
| Two-term exponential | 0.9212 | 0.0840 | 0.0635 | 0.988 | 0.0346 | 0.0096 | 0.930 | 0.0563 | 0.0839 | 0.971 | 0.0231 | 0.0537 |
| Midili | 0.9992 | 0.0140 | 0.00147 | 0.999 | 0.0057 | 0.0091 | 0.996 | 0.0342 | 0.0617 | 0.929 | 0.0508 | 0.0752 |
| Verma et al. | 0.926 | 0.0815 | 0.0663 | 0.994 | 0.0209 | 0.0039 | 0.922 | 0.0573 | 0.0798 | 0.992 | 0.0258 | 0.0536 |
| Modified page | 0.926 | 0.0813 | 0.0529 | 0.999 | 0.0221 | 0.0034 | 0.938 | 0.0444 | 0.0796 | 0.969 | 0.0269 | 0.0619 |
| Wang and singh | 0.909 | 0.0600 | 0.0216 | 0.994 | 0.0298 | 0.0044 | 0.967 | 0.0204 | 0.0639 | 0.984 | 0.0100 | 0.0446 |
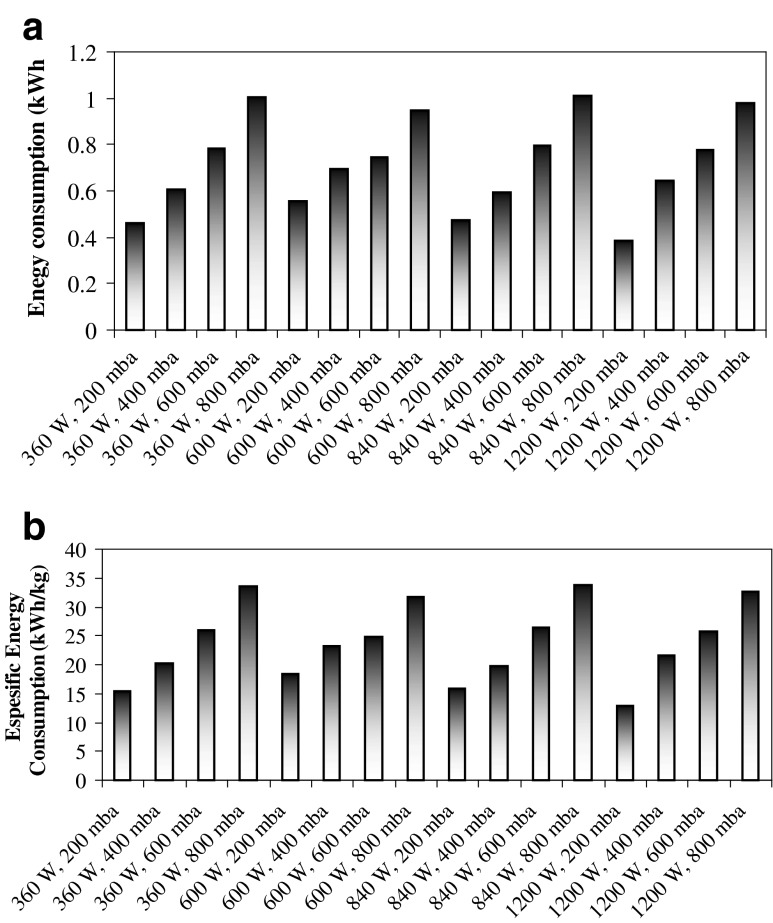
The energy consumption and specific energy consumption values were obtained in drying trials carried out at four different microwave power levels (Fig. 5). Energy consumption at all levels (360– 1200 W) was obtained approximately over the range of 0.4 kWh–1 kWh. Analysis of the data for specific energy consumption (SEC) indicated that minimum SEC (12.92 kWh/kg) occurred at absolute pressure of 200 mbar and microwave power of 1200 W. The maximum SEC (33.53 kWh/kg) was obtained at pressure of 800 mbar and power of 360 W. According to the results of this research and the obtained results by Motevali et al. (2011), Aghbashlo et al. (2008) and Doymaz (2005) comparison between microwave-vacuum drying method and hot air drying showed that energy consumption and drying time was lower in the microwave-vacuum drying method.
Fig. 5.
Effect of a microwave power and b specific energy consumption at different absolute pressure levels on energy consumption during the drying of sour cherries (n = 3)
Artificial neural network modeling
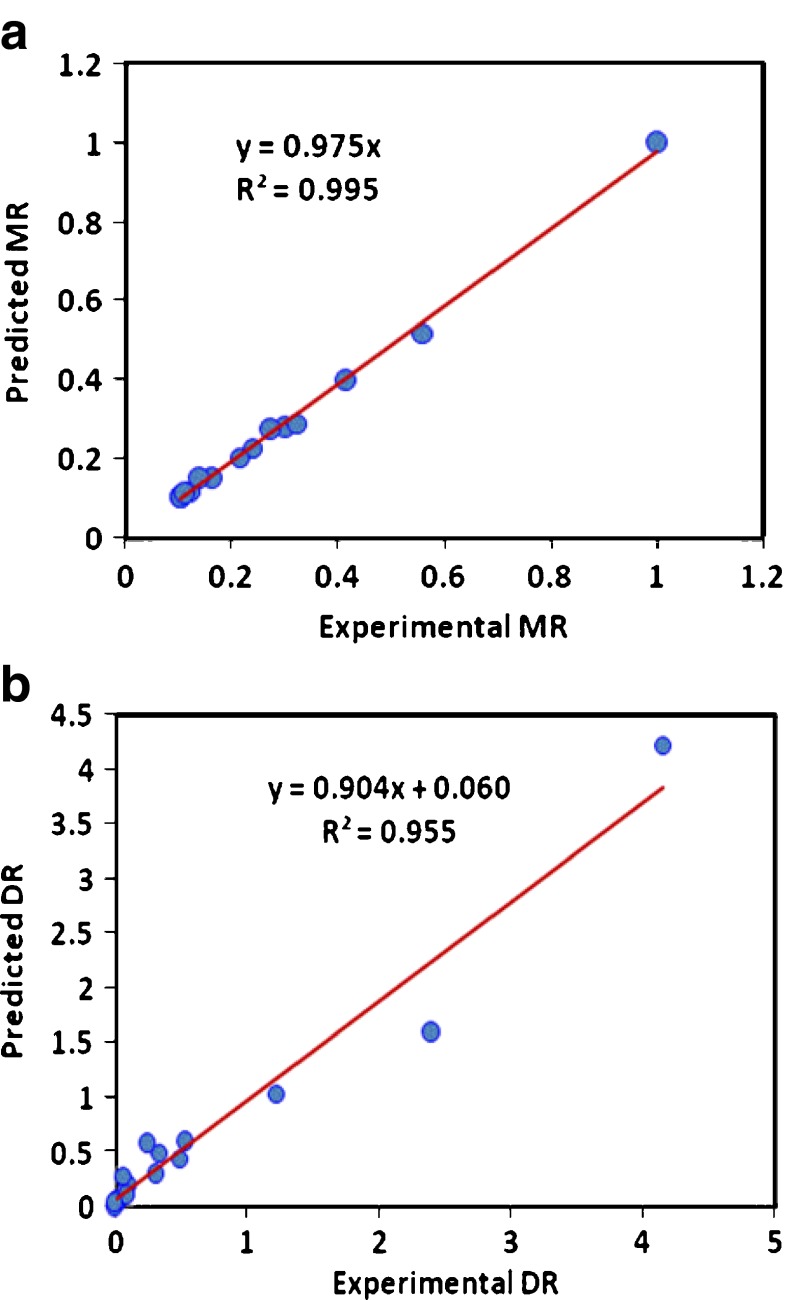
An artificial neural network (ANN) was developed based on the experimental work. Results showed that the Back Propagation training algorithm was well suited for predicting of Moisture Ratio and Drying Rate based on different time, absolute pressure and microwave power levels. Predicted versus experimental values for the studied parameters are indicated in Fig. 6. The number of patterns used in this study were 150, utilized for training, verification and testing of the neural networks. After evaluation of different trails, the optimal model was a four-layered back-propagation ANN, with 15 and 10 neurons in the first and the second hidden layers, respectively.
Fig. 6.
Correlation between the experimental data and the predicted values of the ANN model for prediction of: a Moisture Ratio and b Drying Rate (g/min)
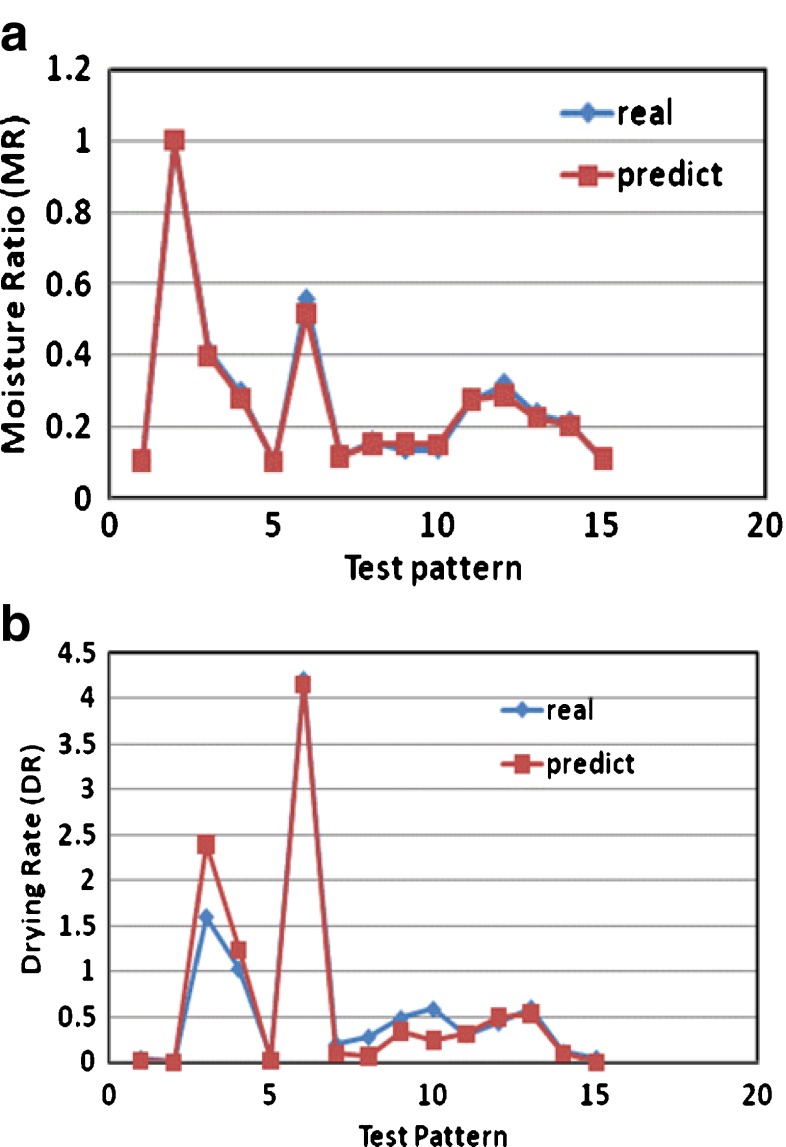
ANN predictions for the (a) MR and, (b) DR yield determination coefficients (R2) of 0.9996, 0.9961 and 0.9958 for training, validation and testing, respectively (Table 4). Prediction Mean Square Error (MSE) values of 0.0003, 0.0071 and 0.0053 were obtained for training, validation and testing, respectively (Table 4).
Table 4.
Summary of the various ANN networks evaluated to yield the best determination coefficient (R2) and Mean Square Error
| Epoch | MSE (test) | MSE (validation) | MSE (training) | R2 (test) | R2 (validation) | R2 (training) | Training error | Neurons in hidden layer2 | Neurons in hidden layer1 | Activation function |
|---|---|---|---|---|---|---|---|---|---|---|
| 11 | 0.1006 | 0.1069 | 0.0607 | 0.8620 | 0.9635 | 0.9346 | 0.060698 | 0 | 30 | Log/Tan |
| 13 | 0.0516 | 0.1479 | 0.0492 | 0.9411 | 0.9889 | 0.9812 | 0.049238 | 0 | 50 | Log/Tan |
| 18 | 0.0585 | 0.0625 | 0.0019 | 0.9915 | 0.9912 | 0.9925 | 0.001871 | 0 | 80 | Log/Tan |
| 13 | 0.0511 | 0.4568 | 0.2492 | 0.9021 | 0.8132 | 0.6828 | 0.249155 | 0 | 100 | Log/Tan |
| 33 | 0.0083 | 0.0170 | 0.0018 | 0.9920 | 0.9965 | 0.9963 | 0.000386 | 10 | 10 | Log/Tan/Tan |
| 31 | 0.0053 | 0.0071 | 0.0003 | 0.9958 | 0.9961 | 0.9996 | 0.000211 | 10 | 15 | Log/Tan/Tan |
| 20 | 0.0302 | 0.0623 | 0.0112 | 0.9839 | 0.9516 | 0.9738 | 0.011234 | 15 | 25 | Log/Tan/Tan |
| 13 | 0.1935 | 0.2123 | 0.0211 | 0.9380 | 0.8995 | 0.9821 | 0.021143 | 20 | 30 | Log/Tan/Tan |
| 37 | 0.2636 | 0.0829 | 0.0747 | 0.9501 | 0.9281 | 0.8627 | 0.007472 | 30 | 50 | Log/Tan/Tan |
| 19 | 0.0532 | 0.1665 | 0.1598 | 0.9175 | 0.9415 | 0.9751 | 0.015971 | 20 | 10 | Log/Tan/Tan |
| 14 | 0.1110 | 0.1747 | 0.0666 | 0.8229 | 0.6870 | 0.8652 | 0.066594 | 25 | 15 | Log/Tan/Tan |
| 15 | 0.1290 | 0.1513 | 0.0519 | 0.7720 | 0.7127 | 0.7690 | 0.051920 | 30 | 25 | Log/Tan/Tan |
| 26 | 0.0066 | 0.0082 | 0.0003 | 0.9968 | 0.9880 | 0.9992 | 0.000275 | 30 | 10 | Log/Tan/Tan |
| 12 | 0.2106 | 0.3564 | 0.0282 | 0.8756 | 0.4806 | 0.8867 | 0.02820 | 25 | 40 | Log/Tan/Tan |
| 26 | 0.0074 | 0.0083 | 0.0024 | 0.9612 | 0.9796 | 0.9912 | 0.002414 | 10 | 5 | Log/Tan/Tan |
| 17 | 0.3486 | 0.0932 | 0.0209 | 0.9104 | 0.9310 | 0.9691 | 0.002089 | 25 | 20 | Log/Tan/Tan |
Figure 7 also shows that the accuracy of predicted value is excellent. The accuracy of various proposed prediction models is tested through the comparison of predicted and experimental sour cherries moisture ratio and drying rate with test pattern during microwave–vacuum drying process. These figures show the results of analysis for moisture ratio and drying rate, respectively. As can be seen, all the investigated prediction models simulate the experiments satisfactorily for both moisture ratio and drying rate. The developed network had a good generalization in predicting the quality of the sour cherries from the drying process. Thus, this network model could be used to determine the moisture ratio and drying rate of the agriculture product under the dynamic drying system. Similar results have been reported by (Liu et al.2007; Tripathy and Kumar 2009). The results have shown that the indicators for goodness of fit of the proposed neural network model are better than the values obtained by the mathematical model. Therefore, the proposed neural network model was selected to represent the thin-layer drying behavior of sour cherries.
Fig. 7.
Comparison of experimental data and the ANN predictions for a Moisture Ratio and b Drying Rate
Conclusions
Drying behavior of thin layers of sour cherries was investigated in a microwave–vacuum dryer at four microwave powers (360, 600, 840, 1200 W) and absolute pressures (200, 400, 600, 800 mbars). Regarding goodness of fit indices (R2, X2, RMSE), Midilli and coworkers' model gave the best fit to the experimental data. An Artificial Neural Network (ANN) trained by the back propagation algorithm was developed to predict moisture ratio and drying rate based on the three input variables (Time, Pressure and Power). The final selected model, 3-15-10-2 (3 neurons in input layer, 15 neuron in hidden layer 1, 10 neuron in hidden layer 2 and 2 neurons in output layer), successfully learned the relationship between input and output parameters. The ANN results were quite satisfactory; R2 values in this model were close to one, while mean square errors (MSE) were found to be very low. Analysis of the experimental data by the ANN revealed that there was a good correlation between the ANN-predicted results and the experimental data. Therefore, ANN proved to be a useful tool for correlation and simulation of microwave–vacuum drying parameters in the case of sour cherries. Generally speaking, ANN proved to be a reliable alternative for sour cherries thin-layer drying prediction due to generality and simplicity.
References
- Abbasi S, Azari S. Novel microwave–freeze drying of onion slices. Int. J. Food Science & Technol. 2009;44(5):974–979. doi: 10.1111/j.1365-2621.2008.01774.x. [DOI] [Google Scholar]
- Aghbashlo M, Kianmehr M, Samimi-Akhijahani H. Influence of drying conditions on the effective moisture diffusivity, energy of activation and energy consumption during the thin-layer drying of berberis fruit (Berberidaceae) Energy Con Manag. 2008;49:2865–2871. doi: 10.1016/j.enconman.2008.03.009. [DOI] [Google Scholar]
- Akpinar E, Midilli A, Bicer Y. Single layer drying behaviour of potato slices in a convective cyclone dryer and mathematical modeling. Energy Conversion and Manag. 2003;44:1689–1705. doi: 10.1016/S0196-8904(02)00171-1. [DOI] [Google Scholar]
- Bondaruk J, Markowski M, Błaszczak W. Effect of drying conditions on the quality of vacuum–microwave dried potato cubes. J Food Eng. 2007;81:306–312. doi: 10.1016/j.jfoodeng.2006.10.028. [DOI] [Google Scholar]
- Chen C, Wu PC. Thin layer drying model for rough rice with high moisture content. J Agri Eng Res. 2001;80(1):45–52. doi: 10.1006/jaer.2000.0677. [DOI] [Google Scholar]
- Doymaz I. Convective air drying characteristics of thin layer carrots. J Food Eng. 2004;61:359–364. doi: 10.1016/S0260-8774(03)00142-0. [DOI] [Google Scholar]
- Doymaz I. Influence of pretreatment solution on the drying of sour-cherry. J Food Eng. 2005;78:591–6. doi: 10.1016/j.jfoodeng.2005.10.037. [DOI] [Google Scholar]
- Drouzas AE, Schubert H. Microwave application in vacuum drying of fruits. J Food Eng. 1996;28:203–209. doi: 10.1016/0260-8774(95)00040-2. [DOI] [Google Scholar]
- Figiel A. Drying kinetics and quality of vacuum-microwave dehydrated garlic cloves and slices. J Food Eng. 2009;94:98–104. doi: 10.1016/j.jfoodeng.2009.03.007. [DOI] [Google Scholar]
- Figiel A. Drying kinetics and quality of beetroots dehydrated by combination of convective and vacuum-microwave methods. J Food Eng. 2010;98:461–470. doi: 10.1016/j.jfoodeng.2010.01.029. [DOI] [Google Scholar]
- Giri SK, Suresh P. Drying kinetics and rehydration characteristics of microwave-vacuum and convective hot-air dried mushrooms. J Food Eng. 2007;78:512–521. doi: 10.1016/j.jfoodeng.2005.10.021. [DOI] [Google Scholar]
- Henderson SM. Progress in developing the thin-layer drying equation. Transactions of the ASAE. 1974;17:1167–1172. [Google Scholar]
- Henderson SM, Pabis S. Grain drying theory. temperature affection drying coefficient. J Agri Eng Res. 1961;6:169–170. [Google Scholar]
- Hertz J, Krogh A, Palmer RG. Introduction to the theory of neural computation. RedWood City: Addison-Wesley; 1991. [Google Scholar]
- Jaya S, Das H. A vacuum drying model for mango pulp. Drying Technol. 2003;21(7):1215–1234. doi: 10.1081/DRT-120023177. [DOI] [Google Scholar]
- Kaensup W, Chutima S, Wongwises S. Experimental study on drying of chilli in a combined microwave–vacuum-rotary drum dryer. Drying Technol. 2002;20:2067–2079. doi: 10.1081/DRT-120015585. [DOI] [Google Scholar]
- Kompany E, Benchimol J, Allaf K, Ainseba B, Bouvier JM. Carrot dehydration for instant rehydration: dehydration kinetics and modeling. Drying Technol. 1993;11(3):451–470. doi: 10.1080/07373939308916838. [DOI] [Google Scholar]
- Koyuncu T, Pinar Y, Lule F. Convective drying characteristics of azarole red (Crataegus monogyna Jacq.) and yellow (Crataegus aronia Bosc.) fruits. J Food Eng. 2007;78:1471–1475. doi: 10.1016/j.jfoodeng.2005.09.036. [DOI] [Google Scholar]
- Krulis M, Kuhnert S, Leiker M, Rohm H. Influence of energy input and initial moisture on physical properties of microwave-vacuum dried strawberries. Eur Food Res Technol. 2005;221:803–808. doi: 10.1007/s00217-005-0090-2. [DOI] [Google Scholar]
- Kumar R, Jain S, Garg MK. Drying behavior of rapeseed under thin layer conditions. J Food Sci Technol. 2010;47(3):335–338. doi: 10.1007/s13197-010-0054-9. [DOI] [PMC free article] [PubMed] [Google Scholar]
- Lewis WK. The rate of drying of solid materials. Ind Eng Chem. 1921;13:427–432. doi: 10.1021/ie50137a021. [DOI] [Google Scholar]
- Li Y, Xu SY, Sun DW. Preparation of garlic powder with high allicin content by using combined microwave-vacuum and vacuum drying as well as microencapsulation. J Food Eng. 2007;83:76–83. doi: 10.1016/j.jfoodeng.2007.02.057. [DOI] [Google Scholar]
- Liu X, Chen X, Wu W, Peng G. A neural network for predicting moisture content of grain drying process using genetic algorithm. Food Control. 2007;18:928–933. doi: 10.1016/j.foodcont.2006.05.010. [DOI] [Google Scholar]
- Menges HO, Ertekin C. Mathematical modeling of thin layer drying of golden apples. J Food Eng. 2005;77:119–125. doi: 10.1016/j.jfoodeng.2005.06.049. [DOI] [Google Scholar]
- Motevali A, Minaei S, Khoshtagaza MH. Evaluation of energy consumption in different drying methods. Energy Con Manag. 2011;52(2):1192–1199. doi: 10.1016/j.enconman.2010.09.014. [DOI] [Google Scholar]
- Motevali A, Minaei S, Khoshtaghaza MH, Kazemi M, Nikbakht AM. Drying of pomegranate arils: comparison of predictions from mathematical models and neural networks. Int J food Eng. 2010;6(3):1–19. [Google Scholar]
- Movagharnejad K, Nikzad M. Modeling of tomato drying using artificial neural networks. Comput Electron Agr. 2007;59:78–85. doi: 10.1016/j.compag.2007.05.003. [DOI] [Google Scholar]
- Olumuyiwa FK, Oyedele OO. Effect of osmotic pretreatment on air drying characteristics and colour of pepper (Capsicum spp) cultivars. J Food Sci Technol. 2010;48(1):45–52. doi: 10.1007/s13197-010-0083-4. [DOI] [PMC free article] [PubMed] [Google Scholar]
- Ozkan A, Akbudak B, Akbudak N. Microwave drying characteristics of spinach. J Food Eng. 2007;78:577–583. doi: 10.1016/j.jfoodeng.2005.10.026. [DOI] [Google Scholar]
- Page GE (1949) Factors influencing the maximum rates of air drying shelled corn in thin layers. M. Sc. Thesis, Purdue University.
- Poonnoy P, Tansakul A, Chinnan M. Artificial neural network modeling for temperature and moisture content prediction in tomato slices undergoing microwave-vacuum drying. J Food Sci. 2007;72(1):42–47. doi: 10.1111/j.1750-3841.2006.00220.x. [DOI] [PubMed] [Google Scholar]
- Prajapati VK, Prabhat K, Rathore SS. Effect of pretreatment and drying methods on quality of value-added dried aonla (Emblica officinalis Gaertn) shreds. J Food Sci Technol. 2010;48(1):45–52. doi: 10.1007/s13197-010-0124-z. [DOI] [PMC free article] [PubMed] [Google Scholar]
- Sagar VR, Suresh Kumar P. Recent advances in drying and dehydration of fruits and vegetables: a review. J Food Sci Technol. 2010;47(1):15–26. doi: 10.1007/s13197-010-0010-8. [DOI] [PMC free article] [PubMed] [Google Scholar]
- Schubert H, Regier M (2005) The microwave processing of foods. 1st ed Woodhead Publishing Limited pp 1–110.
- Sharaf-Eldeen YI, Blaisdell JL, Hamdy MY. A model for ear corn drying. Transactions of the ASAE. 1980;23:1261–1271. [Google Scholar]
- Therdthai N, Zhou W. Characterization of microwave vacuum drying and hot air drying of mint leaves (Mentha cordifolia Opiz ex Fresen) J Food Eng. 2009;91:482–489. doi: 10.1016/j.jfoodeng.2008.09.031. [DOI] [Google Scholar]
- Tripathy PP, Kumar S. Neural network approach for food temperature prediction during solar drying. Int J Thermal Sci. 2009;48:1452–1459. doi: 10.1016/j.ijthermalsci.2008.11.014. [DOI] [Google Scholar]
- Verma LR, Bucklin RA, Endan JB, Wratten FT. Effects of drying air parameters on rice drying models. Transactions of the ASAE. 1985;28:296–301. [Google Scholar]
- Wang Z, Sun J, Liao X, Chen F, Zhao G, Wu J, Hu X. Mathematical modelling on hot air drying of thin layer apple pomace. Food Res Int. 2007;40:39–46. doi: 10.1016/j.foodres.2006.07.017. [DOI] [Google Scholar]
- Yagcioglu A, Degirmencioglu A, Cagatay F (1999) Drying characteristic of laurel leaves under different conditions. In A. Bascetincelik (Ed.), Proceedings of the7th international congress on agricultural mechanization and energy, 26–27 May, Adana, Turkey (pp. 565–569). Faculty of Agriculture, اukurova University
- Yaldiz O, Ertekin C. Thin layer solar drying of some vegetables. Drying Technol. 2001;19:583–596. doi: 10.1081/DRT-100103936. [DOI] [Google Scholar]
- Zhang M, Tang J, Mujumdar AS, Wang S. Trends in microwave-related drying of fruits and vegetables. Trends Food Sci Technol. 2006;17:524–534. doi: 10.1016/j.tifs.2006.04.011. [DOI] [Google Scholar]
- Zheng-Wei C, Shi-Ying X, Da-Wen S. Microwave–vacuum drying kinetics of carrot slices. J Food Eng. 2004;65:157–164. doi: 10.1016/j.jfoodeng.2004.01.008. [DOI] [Google Scholar]
- Zheng-Wei C, Shi-Ying X, Da-Wen S. Effect of microwave–vacuum drying on the carotenoids retention of carrot slices and chlorophyll retention of Chinese chive leaves. Drying Technol. 2004;22:561–574. [Google Scholar]


