Abstract
We are studying two new detector technologies that directly measure the three-dimensional coordinates of 511 keV photon interactions for high-resolution positron emission tomography (PET) systems designed for small animal and breast imaging. These detectors are based on (1) lutetium oxyorthosilicate (LSO) scintillation crystal arrays coupled to position-sensitive avalanche photodiodes (PSAPD) and (2) cadmium zinc telluride (CZT). The detectors have excellent measured 511 keV photon energy resolutions (≤12% FWHM for LSO-PSAPD and ≤3% for CZT) and good coincidence time resolutions (2 ns FWHM for LSO-PSAPD and 8 ns for CZT). The goal is to incorporate the detectors into systems that will achieve 1 mm3 spatial resolution (~1 mm3, uniform throughout the field of view (FOV)), with excellent contrast resolution as well. In order to realize 1 mm3 spatial resolution with high signal-to-noise ratio (SNR), it is necessary to significantly boost coincidence photon detection efficiency (referred to as photon sensitivity). To facilitate high photon sensitivity in the proposed PET system designs, the detector arrays are oriented ‘edge-on’ with respect to incoming 511 keV annihilation photons and arranged to form a compact FOV with detectors very close to, or in contact with, the subject tissues. In this paper, we used Monte Carlo simulation to study various factors that limit the photon sensitivity of a high-resolution PET system dedicated to small animal imaging. To optimize the photon sensitivity, we studied several possible system geometries for a fixed 8 cm transaxial and 8 cm axial FOV. We found that using rectangular-shaped detectors arranged into a cylindrical geometry does not yield the best photon sensitivity. This is due to the fact that forming rectangular-shaped detectors into a ring produces significant wedge-shaped inter-module gaps, through which Compton-scattered photons in the detector can escape. This effect limits the center point source photon sensitivity to <6% for a cylindrical system with rectangular-shaped blocks, 8 cm diameter and 8 cm axial FOV, and a 350–650 keV energy window setting. On the other hand, if the proposed rectangular-shaped detectors are arranged into an 8 × 8 × 8 cm3 FOV box configuration (four panels), there are only four detector inter-module gaps and the favorable distribution of these gaps yields >8% photon sensitivity for the LSO-PSAPD box configuration and >15% for CZT box geometry, using a 350–650 keV energy window setting. These simulation results compare well with analytical estimations. The trend is different for a clinical whole-body PET system that uses conventional LSOPMT block detectors with larger crystal elements. Simulations predict roughly the same sensitivity for both box and cylindrical detector configurations. This results from the fact that a large system diameter (>80 cm) results in relatively small inter-module gaps in clinical whole-body PET. In addition, the relatively large block detectors (typically >5 × 5 cm2 cross-sectional area) and large crystals (>4 × 4 × 20 mm3) enable a higher fraction of detector scatter photons to be absorbed compared to a small animal system. However, if the four detector sides (panels) of a box-shaped system geometry are configured to move with respect to each other, to better fit the transaxial FOV to the actual size of the object to be imaged, a significant increase in photon sensitivity is possible. Simulation results predict a 60–100% relative increase of photon sensitivity for the proposed small animal PET box configurations and >60% increase for a clinical whole-body system geometry. Thus, simulation results indicate that for a PET system built from rectangular-shaped detector modules, arranging them into a box-shaped system geometry may help us to significantly boost photon sensitivity for both small animal and clinical PET systems.
1. Introduction
There has been tremendous interest in developing high-resolution positron emission tomography (PET) scanners dedicated to small animal imaging (Cherry et al 1997, McElroy et al 2005, Rouse et al 2004, Lecomte et al 1994, Ziemons et al 2005, Jeavons et al 1998). Small animal PET has become a powerful tool for molecular imaging applications to visualize and monitor molecular processes using molecular probes labeled by positron-emitters (Cherry 2004, Hirschman et al 2000, Vaska et al 2006). Small animal PET systems may be used to non-invasively study the molecular bases of certain diseases and efficacy of new treatment regimes in small animal models. Commercial small animal PET systems (Tai et al 2005, 2001, Laforest et al 2004, Wong et al 2003, Yang et al 2004, Zhang et al 2005b, Ziemons et al 2005, Missimer et al 2004, Domenico et al 2002, Bloomfield et al 1997) have been developed that yield 1–2.5 mm spatial resolution at the system center. The coincidence photon detection efficiency (‘photon sensitivity’) achieved for these systems ranges between 1 and 10% for a point source at the center of the field of view (FOV). These limited values are mainly determined by the system geometry and the thickness and/or type of detector material used (table 1).
Table 1.
Center point source sensitivity for previously developed small animal PET scanners.
| PET scanners | Detector material and thickness (mm) | System geometry | Axial FOV (cm) | Energy (keV) and time (ns) windows | Center point source sensitivity (%) |
|---|---|---|---|---|---|
| microPET: F-220 (Tai et al 2005) | LSO, 10 | Cylinder, D = 25.8 cm | 7.6 | 250–750, 10 | 3.34 |
| microPET: F-120 (Laforest et al 2004) | LSO, 10 | Cylinder, D = 14.7 cm | 7.6 | 250–750, 10 | 7.1 |
| microPET P4 (Tai et al 2001) | LSO, 10 | Cylinder, D = 26 cm | 7.8 | 250–750, 10 | 2.25 |
| microPET R4 (Knoess et al 2003) | LSO, 10 | Cylinder, D = 14.8 cm | 7.8 | 250–750, 10 | 4.1 |
| microPET II (Yang et al 2004) | LSO, 12.5 | Cylinder, D = 16 cm | 4.9 | 250–750, 10 | 2.26 |
| HIDAC (Missimer et al 2004) | Wire chamber | Four detector blank (box) transaxial FOV = 17 × 17 cm2 | 28.0 | >200, 40 | 1.4 |
| YAP-PET (Domenico et al 2002) | YAP:Ce, 30 | Four block detectors (7.5 cm from center) | 4.0 | >50, 10 | 1.7 |
| RATPET (Bloomfield et al 1997) | BGO, 30 | Cylinder, D = 11.5 cm | 5.0 | 250–850 | 4.3 |
| X-PET (Zhang et al 2005a) | BGO, 10 | Cylinder, D = 16.5 cm | 11.6 | >340 | 10.0 |
| ClearPET (Ziemons et al 2005) | L(Y)SO, 10 + LuYAP:Ce,10 | Cylinder, D = 13–30 cm (adjustable diameter) | 11.0 | 250–750, 10 | 4.0 |
PET spatial resolution is limited by positron range, photon non-collinearity and detector pixel size (Levin and Hoffman 1999). For small diameter systems, positron physics and crystal pixel size determine the spatial resolution (Levin and Hoffman 1999, Stickel and Cherry 2005). Using 18F as the positron emitter, sub-millimeter spatial resolution can be achieved using 1 mm crystal elements, provided there is adequate photon sensitivity to reconstruct images at that desired resolution. Thus, photon sensitivity is a key issue for high-resolution PET.
The main challenge for the next generation of high-resolution PET scanners is to substantially improve both photon sensitivity and image contrast resolution along with spatial resolution (Levin 2003). There are a few challenges to achieving this goal. Typically, high-resolution PET detectors are built from arrays of miniscule (<2 mm) rectangular rods of scintillation crystals. The crystals are coupled through their narrow ends to photodetectors such as position sensitive photomultiplier tubes (PSPMTs). Unfortunately, this crystal orientation results in a poor aspect ratio for light collection, and the light collection efficiency depends strongly on the photon interaction depth within the crystal, which together result in relatively poor energy resolution (Levin 2002). In order to achieve an adequate light signal, the crystals are cut relatively short (<12 mm), which severely limits the intrinsic photon detection efficiency, and thus overall photon sensitivity. For a PET system with poor energy resolution, a relatively wide energy window setting (250–750 keV) is typically required to maintain high photon sensitivity. However, this compromises the ability to reject both random and scatter coincidence events (Levin et al 2007), which limits contrast resolution. Finally, most PET scanners do not measure the three-dimensional (3D) interaction coordinates of the 511 keV photons and so suffer from the well-known photon interaction depth dependent parallax errors that degrade spatial resolution significantly with distance from the system center (Moses et al 1997). To limit this interaction depth effect, most commercial small animal PET manufacturers use a relatively large (>15 cm) detector diameter and limit the useful FOV to a few centimeters at the system center. But placing the detectors at a larger diameter reduces system geometric detection efficiency, and hence overall photon sensitivity.
Recently, there have been many studies describing the development of new PET detectors with depth of interaction (DOI) information (Yamaya et al 2005, Burr et al 2004, Schmand et al 1999, Ziemons et al 2005). With adequate DOI resolution, a substantial enhancement of the photon sensitivity can be achieved by arranging the detectors closer to the subject. A significant improvement of photon sensitivity may provide adequate counts to achieve high SNR in high-resolution reconstructed images. Thus, high photon sensitivity and high-resolution 3D positioning detectors facilitate improved reconstructed spatial resolution of PET systems, while maintaining uniform spatial resolution throughout the FOV. We are developing two novel detector technologies that directly measure 3D photon interaction coordinates. These detector designs are based on (1) lutetium oxyorthosilicate (LSO) coupled to position sensitive avalanche photodiodes (PSAPD) (Levin 2002, Levin et al 2004a) and (2) cross-strip cadmium zinc telluride (CZT) detectors (Slavis et al 2000, Levin et al 2004b). The detectors are stacked and oriented edge-on with respect to incoming 511 keV photons, boosting photon sensitivity while also achieving excellent energy and coincidence time resolutions. Simulation studies predict that the PET systems under development will achieve excellent system spatial resolution, contrast resolution and photon sensitivity all at the same time. The proposed LSOPSAPD detector design (Levin et al 2004a) provides ~1 mm intrinsic spatial resolution and ~3 mm depth resolution while maintaining high intrinsic detection efficiency in effectively 1.8 cm thick LSO crystals. It also provides nearly complete (>90%) scintillation light collection efficiency. The cross-strip CZT detector design has two main advantages compared to scintillation-based detectors for PET. First, the intrinsic spatial resolution for CZT is determined by the electrode pattern deposited on the detector faces rather than by cutting tiny crystal segments, which significantly reduces complexity of achieving 1 mm intrinsic spatial resolution. Second, electron–hole pairs created from photon interactions in CZT are directly collected for signal formation, rather than relying on the inefficient and highly variable intermediate processes of scintillation light creation, collection and photoelectric conversion in a photodetector. This leads to significant improvements in electronic signal-to-noise ratio for CZT, with a drawback of slower time response.
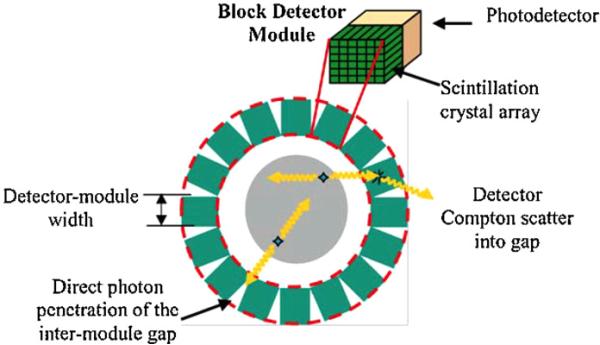
For practical reasons, most PET systems use rectangular-shaped detector arrays. The block detectors are configured in cylindrical geometries (figure 1), most often with system diameters much larger than the useful FOV in order to limit spatial resolution degradation due to photon interaction depth variations within the crystals (Moses 2001). Configuring rectangular blocks into a cylinder produces significant wedge-shaped inter-detector module gaps. Simulations have shown that for small system diameters, arranging rectangular detectors in a cylindrical geometry does not yield the best photon sensitivity mainly due to crystal-scattered photons escaping through the inter-detector module gaps. This paper studies these effects in detail using Monte Carlo simulation for both small animal and clinical PET system geometries built using rectangular detector modules and suggests improved detector arrangements that yield enhanced photon sensitivity (10–20% for a point source at the system center).
Figure 1.
Rectangular block detectors formed into a cylindrical system configuration produce a significant number of inter-module wedge-shaped gaps that provide a path for Compton-scattered photons in the detectors to escape.
2. Materials and methods
2.1. High-resolution detector designs for a small animal PET system
Although the focus of the paper is to study factors that affect overall system photon sensitivity and not previously measured detector performance, in this section we review some of the detector performance parameters achieved in experiments. We are developing two new high-resolution detector technologies for our PET systems. The first detector design uses 8 × 3 arrays of 1 × 1 × 3 mm3 discrete LSO scintillation crystals, each optically coupled to a PSAPD along the 1 × 3 mm2 crystal face, providing a higher aspect ratio for scintillation light collection (Levin 2002, Levin et al 2004a). The PSAPD comprises an 11 × 11 mm2 chip with 8 × 8 mm2 sensitive area. The PSAPD chip in the proposed design is ~200 μm thick and is mounted directly onto a ~50 μm thick flex circuit (figure 2, left). For high intrinsic detection efficiency, two of the LSO arrays are placed onto two PSAPD chips mounted on the same flex circuit, which is oriented ‘edge-on’ with respect to the incoming 511 keV photons so that they encounter a minimum of 1.8 cm thickness of LSO crystal. In this edge-on configuration, photon interaction depth is directly measured by the PSAPD with a depth resolution of 3 mm FWHM (Zhang et al 2005a).
Figure 2.
1 mm resolution detector technologies under study. Left: LSO-PSAPD; right: cross-strip cadmium zinc telluride (CZT).
The second detector design uses 40 × 40 × 5 mm3 cross-strip CZT detectors (figure 2, right) with anode strips (~50 μm wide in 1 mm pitch) and cathode strips (4.95 mm wide in 5 mm pitch) deposited on both sides of the 40 × 40 mm2 detector area forming a grid of 320 pixels (Levin et al 2004b). This cross-strip CZT detector is based on that previously reported (Slavis et al 2000). A compact application specific integrated circuit (ASIC) (Slavis et al 2000) is used to read individual signals from each anode and/or cathode strips that determine the 3D photon interaction coordinates. Orienting the detector edge-on, the incoming 511 keV photons encounter 4 cm thick CZT material for ~86% intrinsic detection efficiency (~74% in coincidence). The cathode strips directly measure the photon DOI with ~5 mm depth resolution, while the anode strips will determine the axial or tangential intrinsic spatial resolution (~1 mm), depending upon orientation. For the third interaction coordinate in the direction normal to the electrode planes, a high intrinsic spatial resolution (~1 mm) was measured from the ratio of anode and cathode signals (Levin et al 2004b). Since in the proposed edge-on detector configuration the inter-CZT detector slab spacing is only 25 μm, this design (figure 2, right) provides >99% crystal packing fraction. CZT detectors provide excellent energy resolution since the high-energy photons are directly converted into an electrical signal and one can calibrate and correct for charge loss mechanisms. Measurements using a prototype CZT detector provided an energy resolution of ~1–3% FWHM at 511 keV (Levin et al 2004b) compared to 1 mm resolution LSO-PSAPD detectors (~12%, Levin et al 2004a). The superior energy resolution of CZT provides the ability to more efficiently reject background scatter and random coincidence events. On the other hand, since CZT relies on drifting of charge rather than propagation of light for signal formation, CZT has relatively poor coincidence time resolution of ≥8 ns FWHM (Levin et al 2004b) compared to LSO-PSAPD that has achieved ~2 ns FWHM (Levin et al 2004a, Zhang et al 2005a). We are currently investigating photon-positioning algorithms in these 3D positioning detectors that attempt to assign a position for incoming photons that may undergo multiple interactions within one or more detectors (Foudray et al 2005).
2.2. Simulation of a small animal PET system with fixed FOV
Simulation was performed using GATE (GEANT4 application for tomographic emission), which is a generic simulation software package based on a general purpose code, GEANT4 (Santin et al 2003, Lazaro et al 2004, Simon et al 2004, Staelens et al 2003, Strulab et al 2003). GATE was specifically developed from GEANT4 to model PET and SPECT systems.
2.2.1. System configurations studied using rectangular detector modules
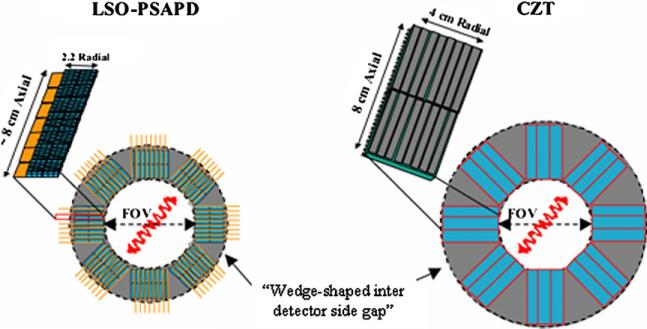
Different sizes of rectangular block detectors were formed from stacks of LSO-PSAPD or CZT detector arrays to generate various multi-sided polygon system geometries with a fixed 8 cm transaxial and 8 cm axial FOV (figure 3), geared for small animal imaging. The detector arrays are oriented ‘edge-on’ with respect to incoming 511 keV photons so that the photons traverse sufficiently thick detector material for high intrinsic photon detection efficiency. Since both LSO-PSAPD and CZT detectors provide excellent 3D positioning of photon interactions, the parallax effects caused by photon crystal penetration are minimal. In the simulations, we took into account all inter-detector and inter-crystal dead spaces to generate a realistic and accurate system model. For LSO-PSAPD detectors, inter-detector gaps are 1.5 mm around the perimeter of each chip and ~300 μm in between layers due to the thickness of the PSAPD-flex unit + inter-layer reflector (see figure 3). On the other hand, adjacent CZT detector slabs may be placed tightly together with <50 μm spacing (we assumed 50 μm in the CZT system simulations).
Figure 3.
System configurations using arrays of LSO-PSAPD (left) and CZT (right) detectors.
Using GATE, different detector geometries were generated (figure 4) assuming different number and width of rectangular detector module sides (ranging from 2 to 48) for a fixed 8 cm transaxial and 8 cm axial FOV system polygon. The number of detector sides of the system polygon dictates the number and distribution of the wedge-shaped inter-detector gaps. A system that uses many narrow rectangular detectors packed together will better approximate a cylinder, but will generate many inter-module gaps (e.g. see figure 4, right image that has 48 detector sides). On the other hand, a system polygon built with wider detector sides, but fewer modules, slightly deviates from a true cylinder in corner regions where the sides come together, and thus provides slightly lower geometric efficiency, but generates fewer gaps for photons to escape.
Figure 4.

Different detector configurations using 2-, 3-, 4-, 8- and 48-sided detector system ‘polygons’ forming a fixed 8 cm transaxial and 8 cm axial FOV. The rays shown traversing the detectors indicate example photon tracks through the detector system.
2.2.2. Point source photon sensitivity simulations
Photon sensitivity for a small animal PET system is commonly defined as the fraction of 511 keV coincidence photon events detected for a point source in air placed at the center of the FOV. We will use this definition in this paper as well. To compare photon sensitivity of different system polygon geometries as a function of number of detector sides, we performed simulations for a point source at the center of the 8 cm transaxial, 8 cm axial FOV of each system polygon as illustrated in figure 4. To accurately model the proposed novel detector configurations, the output of the GATE simulation was written to a list mode hits file for each system studied, which records the energy, position and time stamp of all interactions for each event. Using Matlab, the hits file was processed to generate coincidence events. In our analysis, we apply energy blurring function and sum all interactions in the detector per incoming photon event before applying energy gating to recover the photon energy. All recorded photon events are then sorted to generate coincidence events based on their respective time stamp, which is also blurred based on the time resolution of the each detector. For comparison, simulation was performed under two conditions: (1) all interaction types (photoelectric and Compton scatter), and (2) interactions due to photoelectric only (when both annihilation photons of coincidence events are completely absorbed at their first crystal interaction; the Compton scatter interaction was inactivated for this simulation). Table 2 summarizes the detector performance parameters used to analyze the simulation output hits data files. The assumed detector resolution parameters for LSO-PSAPD have been achieved in previous measurements (Levin et al 2004a, Zhang et al 2005a) and the parameters assumed for CZT were based on previous measurements using a prototype CZT detector (Levin et al 2004b). We have also simulated a standard PET block detector (LSO-PMT) that is used in the Siemens Biograph whole-body PET scanner (Brambilla et al 2005) to perform similar photon sensitivity simulations for whole-body clinical PET systems.
Table 2.
Detector system performance parameters used to analyze the simulation output hits data files.
| Detector system | Energy resolution (% FWHM at 511 keV) | Coincidence time resolution FWHM (ns) | Dead time (ns) |
|---|---|---|---|
| LSO-PSAPD | 12 | 2 | 360 |
| CZT | 3 | 8 | 2000 |
| LSO-PMT | 15 | 0.5 | 150 |
2.2.3. Analytical estimation of photon sensitivity
To estimate analytically the photon sensitivity for all system polygon geometries formed from rectangular-shaped detectors, we analyzed the first-order factors that determine photon sensitivity assuming a point source placed at the center of the FOV. The factors that determine photon sensitivity for PET are (1) geometric efficiency, Eg, which consists of solid angle coverage of the detectors, and (2) intrinsic coincidence detection efficiency, Ei, which is determined by the detector atomic number (Z), density, and thickness in the path of the 511 keV photons, crystal packing fraction, and the coincidence time and energy window settings. Thus, the estimated overall system photon sensitivity is given as a product of the above factors, i.e.
| (1) |
The geometric efficiency is the probability that coincident annihilation photons intercept the detector area, which corresponds to the total solid angle (Ω) fractional coverage of the system. It is given as
| (2) |
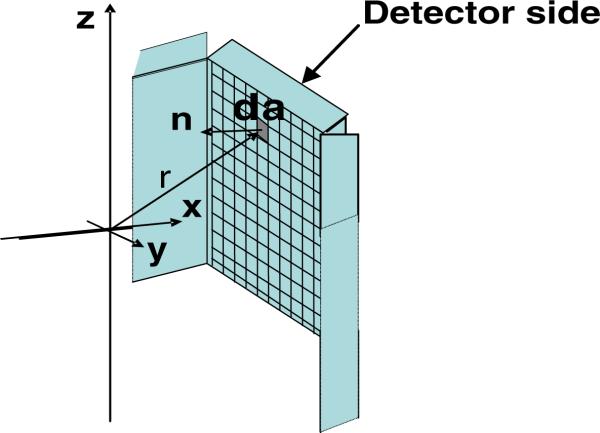
where r is the distance from the source to the detector surface. The closer the detectors are placed to the source, the larger the solid angle is covered, providing higher geometric efficiency. An estimate of the total solid angle coverage (Ω) was obtained using numerical integration by dividing the area of each detector side facing the FOV of the system polygon into finite detector elements and summing the differential solid angle over the entire interior detector surface area of the PET system (figure 5).
Figure 5.
A detector side divided into differential surface area pixels for analytical estimation of solid angle coverage of each system.
To estimate the average intrinsic coincidence detection efficiency, we sub-divided Ei into three factors: the average intrinsic photon stopping efficiency (Ed) for all coincidence lines of response (LOR), and the energy and coincidence time window efficiency factors (Ee and Et), which are the fraction of events accepted into given energy and coincidence time windows, respectively. The intrinsic crystal stopping efficiency Ed is the probability that a coincidence annihilation photon traversing detector material will be absorbed, a factor related to the composition and thickness of the detector materials along a given 511 keV photon direction of propagation. For a point source midway between a pair of detector elements in electronic coincidence, Ed is given as the square of the single-photon stopping efficiency of each detector, i.e.
| (3) |
where x is the thickness of crystal traversed along the incident line of each photon and μ(E) is the total linear attenuation coefficient of the crystal material (LSO or CZT in this paper) at the incoming photon energy (E = 511 keV). μ(E) is the sum of linear attenuation coefficients due to photoelectric effect (μ(E)ph) and Compton scatter (μ(E)c):
| (4) |
In order to estimate an ‘average’ crystal thickness along the photon paths for estimating the average crystal absorption efficiency, the detector volume was divided into finite pixel elements assuming a solid detector volume with perfect crystal packing fraction. A line from the center of the FOV was traced to each pixel through the detector volume and the resulting differential attenuation probabilities were calculated over the entire detector surface area and averaged. An estimate for intrinsic photon stopping efficiency for the systems considering the inter-crystal gaps is then obtained by multiplying equation (3) by the square of crystal packing fraction (Eriksson et al 2005).
Due to coincidence time and energy window settings in the detector system, only a fraction of the events are recorded, limiting the intrinsic detection efficiency and hence the photon sensitivity of the system. The corresponding fraction of the detected events that are recorded within the selected coincidence time window and energy window setting, Et and Ee, respectively, may be estimated experimentally or from Monte Carlo simulations for a given source and detector configuration. In this paper, the effects of coincidence time and energy window setting on photon sensitivity were separately analyzed using simulation by fixing one at a wide setting and varying the other, with all other parameters fixed.
2.3. Effect of detector thickness on photon sensitivity
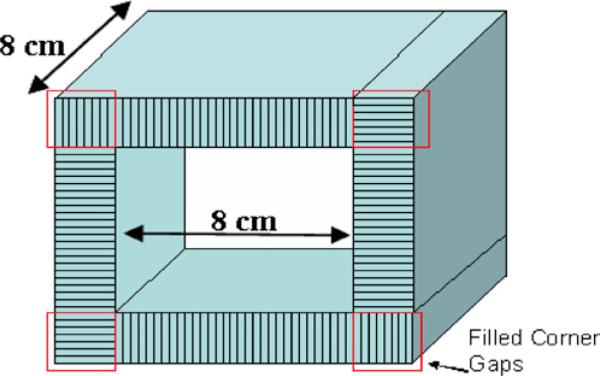
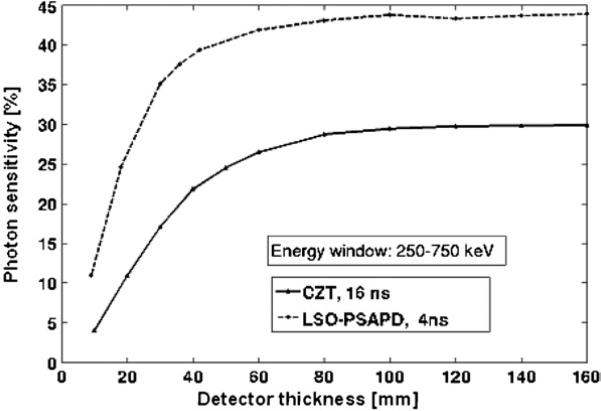
Photon sensitivity as a function of detector thickness was evaluated for a point source at the center of an 8 × 8 × 8 cm3 four-sided (box) system geometry with filled corner gaps (figure 6). This simulation was performed to assess the effect of crystal thickness on stopping detection efficiency of 511 keV photons for LSO-PSAPD and CZT detectors assuming the same 8 × 8 × 8 cm3 system FOV dimensions. For these simulations only, in order to isolate the effects of detector thickness on intrinsic detector efficiency, continuous detectors with no inter-crystal and inter-detector gap were assumed in the LSO-PSAPD and CZT system simulations. The photon sensitivity versus thickness simulations were evaluated using a wide energy window setting (250–750 keV) and coincidence time window of 4 and 16 ns for LSO-PSAPD and CZT detectors, respectively.
Figure 6.
Proposed new geometry for a small animal PET system, consisting of four overlapping detector sides in a box-shaped system geometry with filled corner gaps and 8 × 8 × 8 cm3 FOV.
2.4. Simulations of small animal PET box system geometry with adjustable FOV
Compared to a cylindrical system, a four-sided geometry is generally easier to build assuming that the basic detector components are rectangular in shape (figure 6). With an appropriate mechanical design, the four-sided system also allows each detector side to be shifted with respect to one other, adjusting the useful transaxial FOV to the actual size of the object to be imaged (figure 7). This will maximize the solid angle coverage to optimize the photon sensitivity by bringing the detector modules closer to the object without degrading the spatial resolution since the proposed detectors have the capability of recording the 3D photon interaction coordinates. Simulation was performed using both LSO-PSAPD and CZT detectors for different axial positions of a point source at the center of three different transaxial FOVs, which were formed by shifting the four detector sides of a box geometry as shown in figure 7. The 2.5 and 5 cm wide transaxial FOV shown in figure 7 may be acceptable for some applications when imaging mice and rats, respectively, where one would like to substantially boost photon sensitivity.
Figure 7.
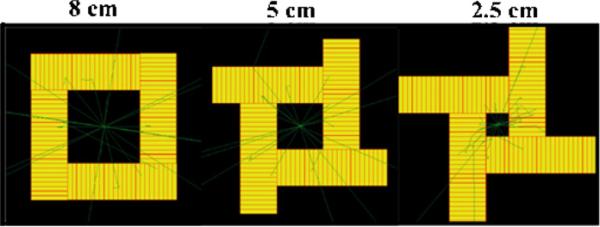
Proposed box system geometry with fixed axial 8 cm FOV and adjustable transaxial FOVs of left, 8 × 8 cm2, middle, 5 × 5 cm2 and right, 2.5 × 2.5 cm2. The rays shown traversing the detectors indicate example photon tracks through the detector system.
2.5. Clinical whole-body PET system simulations
For a clinical whole-body PET system built with rectangular detectors, simulation for photon sensitivity was performed using a line source at the center according to the NEMA NU 2-2001 standard. We compared the photon sensitivity for different numbers of detector sides (2 to 48) of system polygon geometries for a fixed 83 cm transaxial and 16 cm axial FOV. For these whole-body PET system simulations, it was assumed that the detector sides were formed using block detector modules comprising 13 × 13 arrays of 4 × 4 × 20 mm3 LSO crystals (~5 × 5 cm2 cross-sectional area and 2 cm thick) coupled to PMTs (Brambilla et al 2005). The performance parameters for this detector are also summarized in table 2, which are based on the actual performance of the detector.
Simulations were also performed for a whole-body PET system in rectangular system geometry with adjustable transaxial FOV (axial FOV was fixed at 16 cm) (figure 8) that uses the same Siemens Biograph-like block detectors. If the block detectors for a clinical whole-body had adequate photon DOI resolution, the four sides of a rectangular clinical system could also be translated with respect to each other to bring the detectors close to the subject for optimum photon sensitivity. Assuming the same number of detectors used in the conventional PET system (144 block detectors), we investigated photon sensitivity for a line source at the center of a hypothetical adjustable FOV rectangular clinical system for different FOVs. For this paper, we have selected three different symmetric transaxial FOVs (63 × 63 × 16 cm3, 53 × 53 × 16 cm3 and 41 × 41 × 16 cm3) for the hypothetical adjustable rectangular-shaped clinical system and compared the NEMA standard line source photon sensitivity result to the fixed diameter (83 cm) conventional clinical whole-body cylindrical system.
Figure 8.
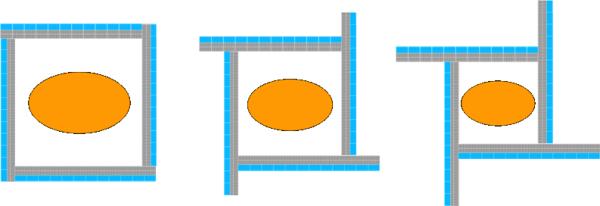
Proposed variable FOV rectangular clinical whole-body PET system. Left: 63 × 63 × 16 cm3 FOV, middle: 53 × 53 × 16 cm3 FOV, and right: 41 ×41 × 16 cm3 FOV. The axial FOV is fixed at 16 cm.
3. Results
3.1. The small animal PET system
3.1.1. Effect of detector configuration
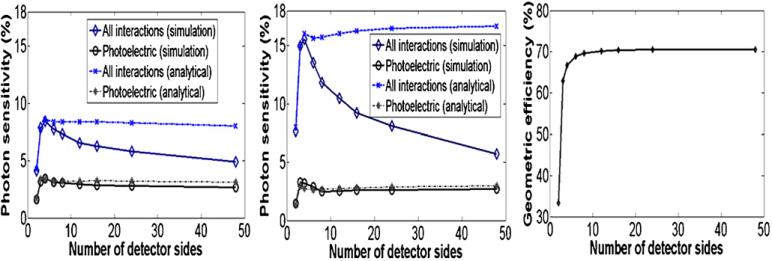
The photon sensitivity for a point source in air at the center of a system polygon that uses either LSO-PSAPD or CZT rectangular-shaped detectors forming a fixed 8 cm transaxial and 8 cm axial FOV as a function of number of detector sides is shown in figure 9 (left and middle). Simulation results using either LSO-PSAPD (figure 9, left) or CZT (figure 9, middle) detectors show that the photon sensitivity due to all detector photon interactions (Compton and photoelectric) drops as the number of detector sides increases from 4 to 48. On the other hand, the photon sensitivity due to direct photoelectric absorption only (when both annihilation photons due to photoelectric interaction only are completely absorbed during their first interaction) remains nearly constant independent of number of system polygon sides. For this simulation, we used a fixed 350–650 energy window and coincidence time window settings of 4 and 16 ns for the LSO-PSAPD and CZT detectors, respectively.
Figure 9.
Simulated and analytically estimated center point source photon sensitivity as a function of number of detector sides in the system polygon for a fixed 8 cm transaxial and 8 cm axial FOV using the proposed LSO-PSAPD detectors (left) and CZT detector (middle) (350–650 keV energy window). Right: analytically estimated geometric efficiency as a function of number of detector sides corresponding to the simulated system polygons.
For comparison, the photon sensitivity was also estimated analytically considering the cases of Compton + photoelectric and photoelectric only interaction probabilities for each system configuration. Unlike the simulations, the analytical estimation of photon sensitivity (equations (1)–(4)) does not explicitly consider photons that scatter in the crystal and escape into inter-detector gaps. These analytical estimations predict that the estimated photon sensitivity using LSO-PSAPD (figure 9, left) and CZT (figure 9, middle) detectors remains constant independent of number of system polygon sides. Analytical estimation of photon sensitivity versus number of detector sides that considered only photoelectric interaction probabilities (when μC = 0) showed a similar trend to the result obtained from the photoelectric only simulation since in this case the photon either interacts and stops or passes through undetected and therefore more closely matches the trend for analytically estimated geometric efficiency versus number of detector sides (figure 9, right). These results show that the loss of photons as the number of rectangular-shaped detector sides increases for a fixed FOV is mainly due to photons that undergo Compton scatter in the detector crystal and escape through the wedge-shaped gaps. These escaped crystal scatter photons limit the photon sensitivity for a given system geometry. Note that the drop in photon sensitivity with number of detector sides is more gradual using a system built with LSO-PSAPD detectors compared to CZT detectors since the edge-on CZT detectors are thicker (4 cm versus 2 cm using LSO-PSAPD) and thus produce longer gap wedges between adjacent detector polygon sides.
The simulation result also showed that the four-sided system polygon (see figure 4) built from rectangular-shaped detectors provided maximum photon sensitivities of ~8.5% (4 ns time window and 350–650 keV energy window) for LSO-PSAPD detectors (figure 9, left) and ~15.5% (16 ns time window and 350–650 keV energy window) for CZT detectors (figure 9, middle), respectively. Due to the low number and particular distribution of gaps and relatively large area of the four detector sides, the four-sided configuration has a relatively high probability of completely absorbing photon interactions (Compton or photoelectric). On the other hand, the four-sided configuration has essentially equivalent solid angle coverage (geometric efficiency) compared to a cylindrical geometry, approximated by a 48-sided polygon (figure 9, right). When the four corner gaps are filled with detectors for the four-sided configuration (figure 6), the photon sensitivity improved from 8.5% to 11% (4 ns time window and 350–650 keV energy window) using LSO-PSAPD detectors and from 15.5% to 21% (16 ns time window and 350–650 keV energy window) using CZT detectors. Since there is a dead area (~1.5 mm) around the PSAPD sensitive area where there is no crystal present, which produces significant inter-PSAPD gaps, a four-sided system configuration using CZT detectors provides higher photon sensitivity compared to that built with LSO-PSAPD detectors. The CZT system design proposed has negligible (<50 μm) inter-detector gaps.
3.1.2. Photon sensitivity as a function of coincidence time and energy window settings
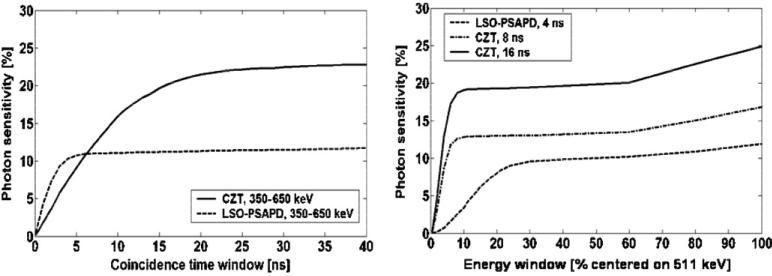
The effect of coincidence time and energy window settings on photon sensitivity was studied for a four-sided box system with filled corner gaps since it provided highest photon sensitivity. Figure 10 (left) shows the photon sensitivity as a function of coincidence time window for a small animal PET system constructed from the proposed LSO-PSAPD and CZT detectors configured into a box-shaped geometry (figure 6). For this simulation a 350–650 keV energy window setting was assumed.
Figure 10.
Photon sensitivity for four-sided polygon geometry with the four corner gaps filled forming a full box geometry (8 × 8 × 8 cm3 FOV) (figure 6): left: as a function of coincidence time window; and right: as function of energy window for LSO-PSAPD and CZT detectors, respectively.
The sensitivity saturates for coincidence time window greater than two times the coincidence time resolution (2 ns FWHM for LSO-PSAPD and 8 ns FWHM for CZT detectors) (see table 2). Thus, 4 and 16 ns coincidence windows provide optimal photon sensitivity for a system comprising LSO-PSAPD and CZT detectors, respectively. For CZT, due to relatively poor coincidence time resolution, the coincidence time window may be set to 8 ns (equal to the coincidence time resolution) in order to limit the rate of random coincidences. But an 8 ns time window would limit the corner-filled CZT box system center point source photon sensitivity to a maximum of ~14% versus ~20% for the 16 ns time window (figure 10, right). Figure (right) shows photon sensitivity for a point source at the center of the FOV as a function of energy window for a fixed coincidence time window. For comparison, we used coincidence time windows of 8 and 16 ns for CZT and 4 ns for LSO-PSAPD detectors, respectively. For CZT, the photon sensitivity saturates at a narrow energy window (496–526 keV), which is twice the energy resolution of CZT detector (table 2). The advantage of detectors with excellent energy resolution is that a narrow energy window can be used to reject both random and scatter coincidences, while still maintaining high photon sensitivity.
3.1.3. Effect of detector thickness
Figure 11 shows the photon sensitivity as a function of detector thickness for a four-sided box system using LSO-PSAPD and CZT detectors. For these simulations only, the detector sides were formed from closely packed solid detectors assuming zero inter-crystal and/or inter-detector gaps. Compared to LSO, CZT has lower intrinsic detection efficiency due to lower photon stopping power for oblique photons that traverse the edges. Hence, photon sensitivity of LSO-PSAPD and CZT system configurations are different even for large detector thickness (>16 cm) for a box geometry at fixed 8 cm transaxial and 8 cm axial FOV. On average 4 cm thick CZT has about the same intrinsic 511 keV photon detection efficiency as 2 cm LSO crystal (figure 11).
Figure 11.
Photon sensitivity for box geometry as a function of detector thickness for the proposed LSO-PSAPD and CZT detectors for a point source at the center.
3.1.4. Photon sensitivity with adjustable transaxial FOV
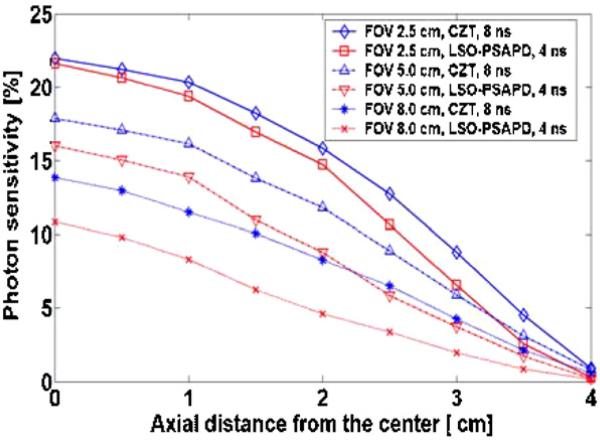
Figure 12 shows simulated photon sensitivity for different transaxial FOVs by adjusting the relative position of the four detector sides of the box geometry for a small animal PET system as shown in figure 7. The advantage of a system with an adjustable FOV is that it is possible to optimize the photon sensitivity by placing the detectors in close proximity to the subject contours. Figure 12 shows the comparison of photon sensitivities for 2.5 cm, 5 cm and 8 cm transaxial FOV as a function of axial point source location using LSO-PSAPD and CZT detectors. The axial FOV was fixed to 8 cm. Simulation showed that significant enhancement of photon sensitivity could be obtained when the transaxial FOV is adjusted to fit the actual size of the subject. When the transaxial FOV is adjusted to 2.5 cm, the photon sensitivity for a point source at the center improved by ~100% for LSO-PSAPD (4 ns time window and 350–650 keV energy window) and by ~60% for CZT (8 ns time window and 350 keV energy window) compared to the photon sensitivity obtained with 8 cm wide transaxial FOV. We also observed significant center point photon sensitivity enhancement of ~50% for LSO-PSAPD (4 ns time window and 350–650 keV energy window) and ~30% for CZT (8 ns time window and 350 keV energy window) when the transaxial FOV is set to 5 cm. The 2.5 and 5 cm wide transaxial FOV may be acceptable for certain applications when imaging mice and rats, respectively.
Figure 12.
Comparison of photon sensitivity for a box system geometry with fixed 8 cm axial FOV as a function of axial point source locations for 2.5 cm, 5 cm and 8 cm transaxial FOVs using LSO-PSAPD and CZT detectors.
3.2. Clinical system configurations
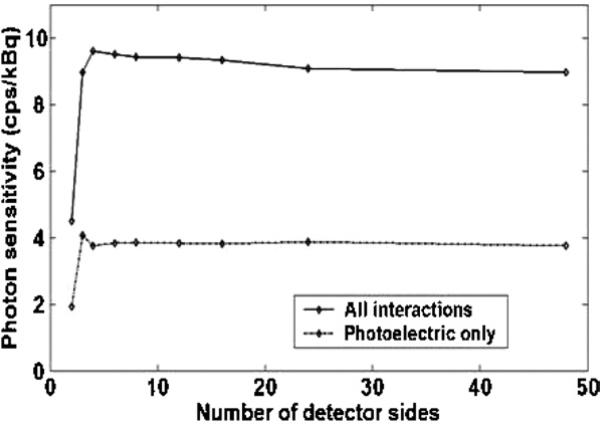
Simulation studies for potential clinical whole-body PET system geometries with fixed 83 cm transaxial and 16 cm axial FOVs were performed to see if the trend of photon sensitivity versus number of detector sides for a polygon geometry small animal PET system seen in figure 9 translates to clinical size systems. Figure 13 shows photon sensitivity simulation results for a line source at the center of the FOV (according to NEMA NU 2-2001 standard) as a function of number of system polygon sides. Since the detector modules are built from relatively large LSO-PMT detector blocks (~5 × 5 cm2 cross section area, 2 cm thick), most Compton scatter photons are absorbed in the detector before reaching the gaps. Also, the wedge-shaped inter-detector gaps are relatively small for a large transaxial FOV, providing relatively low probability of photon escape through the gaps. Thus, the photon sensitivity for a clinical whole-body PET geometry (figure 13) decreased insignificantly as the number of polygon sides increased compared to the significant decrease observed in small animal PET system geometries (figure 9). For fixed 83 cm transaxial FOV, the four-sided polygon geometry provided slightly more photon sensitivity of ~9.5 cps kBq–1 for a line source at the center of the FOV compared to a conventional cylinder-shaped system (9 cps kBq–1) using 4.5 ns coincidence time and 420–650 keV energy windows.
Figure 13.
Simulated photon sensitivity (4.5 ns, 420–650 keV) for a line source at the center of the FOV (according to NEMA NU 2-2001 standard) as a function of the number of detector sides of the system polygon for a clinical whole-body PET system.
We also evaluated photon sensitivity for a line source at the center of a clinical whole-body PET system in a rectangular geometry with adjustable FOV that better matches the patient cross-sectional contour for optimum photon sensitivity as illustrated in figure 8. Table 3 shows the photon sensitivity for a rectangular system geometry that uses the same number of rectangular block detectors as a conventional whole-body clinical PET system for three different transaxial FOVs with fixed 16 cm axial FOV. Simulation results showed that significant improvements in photon sensitivity could be achieved. A twofold improvement in photon sensitivity is obtained when the FOV is adjusted to 41×41 cm2 transaxial FOV compared to a conventional fixed FOV cylindrical clinical system geometry.
Table 3.
Photon sensitivities of clinical whole-body PET systems with different transaxial FOVs based on NUMA NU 2-2001 standard.
| Clinical whole-body PET systems (fixed 16 cm axial FOV) | Photon sensitivity (cps kBq–1) |
|---|---|
| Rectangular, 63 × 63 cm2 | 12 |
| Rectangular, 53 × 53 cm2 | 14 |
| Rectangular, 41 × 41 cm2 | 18 |
| Cylindrical, 83 cm system diameter (useful trans. FOV = ~55 cm) | 9 |
4. Discussion and conclusion
Compared to clinical whole-body PET systems, small animal PET systems have a much smaller detector diameter and the individual detector modules typically have smaller cross-sectional area comprising significantly smaller crystal elements. Thus, arranging rectangular blocks into a circle yields a significant number of relatively large wedge-shaped gaps between adjacent detector sides that provide a path for crystal-scattered photons to escape. For an 8 cm diameter, 8 cm long cylinder, these escape paths limit the system photon sensitivity to < 6% for a center point source (figure 9) (350–650 keV energy window). We saw in figures 9 and 13 when all detector photon interactions (scatter + photoelectric) are simulated, the photon sensitivity decreases as the number of detector sides increase, whereas when only the photoelectric interactions are simulated the sensitivity curve essentially remains constant independent of the number of detector sides. This implies that the decrease of photon sensitivity with increasing number of detector sides (and hence increasing number of gaps) seen in the simulation curves of figures 9(a) and (b) is mainly due to crystal Compton scatter photons escaping into the gaps.
As the number of system polygon sides increases, the number of inter-detector gaps also increases, which allows more scattered photons to escape. This result has been verified from analytical estimates, which only consider the geometric efficiency (solid angle coverage) and intrinsic coincidence detection efficiency (including photon attenuation in the crystals and coincidence time and energy window settings) and do not account for escaped crystal-scattered photons. Unlike the simulation results, which took into account loss of photons that scatter in the crystal, the analytical sensitivity curves in figures 9(a) and (b) remain flat as the number of detector sides (and gaps) in the system polygon increases.
Maximum photon sensitivity (~8.5% for LSO-PSAPD and ~15% for CZT; see figure 9, ‘All interactions’ curves) is obtained for a system comprising four detector ‘sides’ in a box-shaped geometry (see figure 4, middle). This is due to the relatively high geometric efficiency and relatively few gaps between detector sides of the system polygon, which improves the probability of absorbing multiple interactions in the detectors. When the four corner gaps are filled in a box geometry >25% improvement in photon sensitivity is obtained providing >10% absolute photon sensitivity for LSO-PSAPD (4 ns, 350–650 keV) and >19% for CZT (16 ns, 350–650 keV) detectors, respectively.
In a different context, a four-panel box system was proposed for a breast-dedicated PET system (Jinyi et al 2002). However, that four-sided geometry was proposed as a way to increase the number of LORs and improve tomographic image reconstruction compared to the dual-panel breast-dedicated PET approach (Murthy et al 2000) rather than having a goal to optimize photon sensitivity for a given FOV size. Huber and Moses (1999) also proposed a conceptual full box system with six detector panels to achieve 4π solid angle coverage that provides high photon sensitivity for a small animal PET system, but without analyzing factors that limit photon sensitivity including the distribution of gaps created between two adjacent rectangular-shaped detector modules that we have studied here.
Detector modules used in clinical whole-body PET systems (e.g. cylinder configuration with 83 cm system diameter, 16 cm axial FOV) are built from relatively large detectors (>5 × 5 cm2 cross-sectional area, 2 cm thick), and large crystals (>4 × 4 × 20 mm3), and the large diameter means that the inter-module gaps are relatively narrow. Thus, although the geometric efficiency is much lower than for the small animal PET systems studied, the whole-body PET system design provides higher intrinsic detection efficiency due to a higher probability of absorbing multiple interactions with a relatively lower probability of crystal scatter photons escaping through the inter-module gaps. Hence, the number of detector sides (and inter-detector gaps) did not show a significant effect on photon sensitivity for the fixed 83 cm transaxial FOV width clinical whole-body PET system configuration (figure 13).
Simulation showed (figure 10) that the photon sensitivity for the box geometry saturates when a coincidence time window greater than two times the coincidence time resolution of the detectors is used (2 ns for LSO-PSAPD, 8 ns FWHM for CZT). Narrow energy window settings (450–572 keV for LSO-PSAPD and 496–526 keV for CZT) equal to twice the energy resolutions (12% FWHM at 511 keV for LSO-PSAPD and 3% FWHM at 511 keV for CZT) are desired to limit the scatter and random events. A relatively wide 350–650 keV window is typically used in the existing small animal PET systems to increase the photon sensitivity, but increases the acceptance of scatter and random events. Random events increase with energy window since many single photons that contribute to randoms also undergo scatter. With excellent energy resolution, a narrow energy window can be used to limit the scatter and random events without compromising photon sensitivity (figure 10). Due to good energy resolution (3% FWHM at 511 keV) for CZT, using a very narrow energy window reduces the photon sensitivity to a lesser degree than for the LSO-PSAPD system (energy resolution 12% FWHM at 511 keV).
Table 1 summarizes the recorded photon sensitivities that are achieved for the previously developed small animal PET systems. For a system that minimizes the inter-detector module gaps, as in the case of the X-PET system, a high sensitivity (~10%) is achieved for a cylindrical system geometry. The special pentagon-shaped detectors in the X-PET systems fill all potential inter-module gaps at module edges with trapezoid-shaped crystals, providing highest photon sensitivity compared to other previously developed small animal PET systems. Filling all inter-module gaps in any polygon system geometry will provide high probability of detecting Compton-scattered photons, significantly increasing the photon sensitivity. The ideal cylindrical geometry system would be a solid annulus, such as described by Karp et al (1994) for a human brain system using NaI(Tl) scintillation crystal, since it provides optimum photon sensitivity per detector volume. However, such detector design is limited by lower intrinsic detection efficiency, poor spatial resolution and higher dead time compared to the standard pixellated crystal designs. In addition, the large solid annulus cannot be built using the more desirable PET scintillation crystals such as LSO, LYSO, GSO or BGO. Compared to existing small animal PET systems that use conventional rectangular block detectors, the proposed box-shaped small animal PET system designs, if successful, provide on average more than three and fivefold improvements in photon sensitivity using LSO-PSAPD and CZT detector configurations, respectively, while achieving 1 mm FWHM intrinsic detector resolution, 3D interaction positioning, and superior energy resolution.
The flexibility to shift the four sides of a box geometry PET system provides the ability to adjust the useful FOV to the actual size of the object, which yields significant increase in photon sensitivity. For a small animal PET box-shaped system, adjusting the transaxial useful FOV to less than 5 cm provided more than 50 and 30% additional gain in photon sensitivity over the fixed 8 cm transaxial width for LSO-PSAPD and CZT detectors, respectively. Similarly, greater than 60% improvement in photon sensitivity was obtained when the four sides of the rectangular-shaped clinical system simulated were shifted with respect to each other to adjust the transaxial FOV to less than 50 × 50 cm2 compared to the existing state-of-the-art fixed diameter clinical PET systems (table 3).
As discussed we are investigating new PET detector technologies that, if successful, will have the capability to accurately estimate the 3D coordinates of all interactions per event. However, please note that the key results of this work, which studied the effect of detector arrangements and gaps on photon sensitivity, do not assume the availability of such a 3D detector PET system, which at present does not exist. The results of this paper also hold for the existing systems that use rectangular-shaped detectors, such as those small animal systems listed in table 1, as well as all clinical PET systems. These systems use 2D positioning detector modules that are only capable of estimating the detector element closest to the weighted mean position of all interactions for each event, and the total energy deposited per event, but cannot separately position the individual photon interactions or even estimate the weighted mean interaction depth. However, in order to be able to develop new system designs that arrange the detectors closer to the subject for substantial photon sensitivity improvements, without adding excessive parallax positioning errors that degrade spatial resolution as a function of radial coordinate, the detector system must also be able to localize the weighted mean photon interaction depth, which has been a topic of great interest (e.g. Yamaya et al (2005), Burr et al (2004), Schmand et al (1999), Ziemons et al (2005), Levin et al (2004a).
The focus of the paper was to study the factors that affect photon sensitivity. This work established that, for rectangular-shaped detectors and a small system diameter, a box-shaped system is preferable. But how does the box shape affect tomographic image reconstruction performance? Previous studies demonstrated that reconstructed spatial resolution, contrast recovery, image SNR and variance are comparable for a box shape compared to a cylinder (assuming the LSO-PSAPD detector technology with a weighted mean position algorithm) (Chinn et al 2005).
Acknowledgments
This work was supported in part by NIH grants R21 EB003283 from NIBIB, R01 CA119056, R01 CA120474 and R21 CA098691 from NCI, and 12IB-0092 from the UC Breast Cancer Research Program.
References
- Bloomfield PM, Myers R, Hume SP, Spinks TJ, Lammertsma AA, Jones T. Three-dimensional performance of a small-diameter positron emission tomograph. Phys. Med. Biol. 1997;42:389–400. doi: 10.1088/0031-9155/42/2/010. [DOI] [PubMed] [Google Scholar]
- Brambilla M, Secco C, Dominetto M, Matheoud R, Sacchetti G, Inglese E. Performance characteristics obtained for a new 3-dimensional lutetium oxyorthosilicate-based whole-body PET/CT scanner with the National Electrical Manufacturers Association NU 2-2001 Standard. J. Nucl. Med. 2005;46:2083–91. [PubMed] [Google Scholar]
- Burr KC, Ivan A, Castleberry DE, LeBlanc JW, Shah KS, Farrell R. Evaluation of a prototype small-animal PET detector with depth-of-interaction encoding. IEEE Trans. Nucl. Sci. 2004;51:1791–8. Part 1. [Google Scholar]
- Cherry SR. In vivo molecular and genomic imaging: new challenges for imaging physics. Phys. Med. Biol. 2004;49:R13–48. doi: 10.1088/0031-9155/49/3/r01. [DOI] [PubMed] [Google Scholar]
- Cherry SR, et al. MicroPET: a high resolution PET scanner for imaging small animals. IEEE Trans. Nucl. Sci. 1997;44:1161. [Google Scholar]
- Chinn G, Foudray AMK, Levin CS. Comparing geometries for a PET system with 3-D photon positioning capability. IEEE Nuclear Science Symp. Conf. Record.2005. pp. 23–9. [Google Scholar]
- Domenico GD, Motta A, Zavattini G, Guerra AD, Damiani C, Bettinardi V, Gilardi MC. Characterization of the Ferrara animal PET scanner. Nucl. Instrum. Methods. 2002;477:505–8. [Google Scholar]
- Eriksson L, et al. Potential for a fifth generation PET scanner for oncology. IEEE Nuclear Science Symp. Conf. Record.2005. pp. 23–9. [Google Scholar]
- Foudray AMK, Levin CS, Olcott PD. Investigating positioning algorithms for high resolution positron emission tomography systems capable of depth of interaction measurement. J. Nucl. Med. 2005;46:483P. [Google Scholar]
- Hirschman HR, et al. Seeing is believing: non-invasive, quantitative and repetitive imaging of reporter gene expression in living animals, using positron emission tomography. J. Neurosci. Res. 2000;59:699–705. doi: 10.1002/(SICI)1097-4547(20000315)59:6<699::AID-JNR1>3.0.CO;2-1. [DOI] [PubMed] [Google Scholar]
- Huber JS, Moses WW. Conceptual design of a high-sensitivity small animal PET camera with 4p coverage. IEEE Trans. Nucl. Sci. 1999;46:498–502. [Google Scholar]
- Karp JS, Freifelder R, Kinahan PE, Geagan MJ, Muehllehner G, Shao L, Lewitt RM. Evaluation of volume imaging with the HEAD PENN-PET scanner. 1994 IEEE Nuclear Science Symp. and Medical Imaging Conf..1994. pp. 1877–81. [Google Scholar]
- Knoess C, et al. Performance evaluation of the microPET R4 PET scanner for redents. Eur. J. Nucl. Med. Mol. Imaging. 2003;30:737–47. doi: 10.1007/s00259-002-1052-6. [DOI] [PubMed] [Google Scholar]
- Jeavons AP, Chandler RA, Dettmar CAR. A 3D HIDAC-PET camera with sub-millimeter resolution for imaging small animal. IEEE Trans. Nucl. Sci. 1998;52:1396–400. [Google Scholar]
- Jinyi Qi, Kuo C, Huesman RH, Klein GJ, Moses WW, Reutter BW. Comparison of rectangular and dual-planar positron emission mammography. IEEE Trans. Nucl. Sci. 2002;51:1791–8. Part 1. [Google Scholar]
- Laforest R, Longford D, Siegel S, Newport DF, Yap J. Performance evaluation of the microPET-focus—F120. 2004 IEEE Nuclear Science Symp. Conf. Record.2004. pp. 2965–9. [Google Scholar]
- Lazaro D, et al. Validation of the GATE Monte Carlo simulation platform for modeling a CsI(Tl) scintillation camera dedicated to small-animal imaging. Phys. Med. Biol. 2004;49:271–85. doi: 10.1088/0031-9155/49/2/007. [DOI] [PubMed] [Google Scholar]
- Lecomte R, Cadorette J, Richard P, Rodrigue S, Rouleau D. Design and engineering aspects of a high resolution positron tomograph for small animal imaging. IEEE Trans. Nucl. Sci. 1994;41:1446–52. [Google Scholar]
- Levin CS. Design of a high-resolution and high-sensitivity scintillation crystal array for PET with nearly complete light collection. IEEE Trans. Nucl. Sci. 2002;49:2236–43. [Google Scholar]
- Levin CS. Detector design issues for compact nuclear emission cameras dedicated to breast imaging. Nucl. Instrum. Methods A. 2003;497:60–74. [Google Scholar]
- Levin CS, Foudray AMK, Olcott PD, Habte F. Investigation of position sensitive avalanche photodiodes for a new high-resolution PET detector design. IEEE Trans. Nucl. Sci. 2004a;51:805–10. [Google Scholar]
- Levin CS, Hoffman EJ. Calculation of positron range and its effect on positron emission tomography system spatial resolution. Phys.Med. Biol. 1999;44:781–99. doi: 10.1088/0031-9155/44/3/019. [DOI] [PubMed] [Google Scholar]
- Levin CS, Matteson JL, Skelton RT, Pelling MR, Duttweiler F. Promising characteristics and performance of cadmium zinc telluride detectors for positron emission tomography. Presented at 2004 IEEE Nuclear Science Symp. and Medical Imaging Conf.; Rome, Italy. 16–22 Oct.; 2004b. Abstract no. M2-117/Book of Abstracts/p 136 /IEEE/Nuclear and Plasma Science Society. [Google Scholar]
- Levin CS, Habte F, Foudray AMK, Zhang J, Chinn G. Impact of high energy resolution detectors on the performance of a PET system dedicated to breast cancer imaging. Physica Med. 2007;XXI(Suppl. 1):28–34. doi: 10.1016/S1120-1797(06)80020-7. [DOI] [PubMed] [Google Scholar]
- McConnell ML, et al. Three-dimensional imaging and detection efficiency performance of orthogonal coplanar CZTs trip detectors. Proc. SPIE. 2000;4141:157–67. [Google Scholar]
- McElroy DP, et al. A true singles list-mode data acquisition system for small animal PET scanner with independent crystal readout. Phys. Med. Biol. 2005;50:3323–35. doi: 10.1088/0031-9155/50/14/009. [DOI] [PubMed] [Google Scholar]
- Missimer J, Madi Zoltan, Honer M, Keller C, Schubiger A, Ametamey SM. Performance evaluation of 16-module quad-HIDAC small animal PET camera. Phys. Med. Biol. 2004;49:2069–81. doi: 10.1088/0031-9155/49/10/016. [DOI] [PubMed] [Google Scholar]
- Moses WW. Trends in PET Imaging. Nucl. Instrum. Methods A. 2001;471:209–14. [Google Scholar]
- Moses WW, Derenzo SE, Huesman RH, Budinger TF. Design of a high-resolution, high-sensitivity PET camera for human brains and small animals. IEEE Trans. Nucl. Sci. 1997;44:1487–91. [Google Scholar]
- Murthy K, Aznar M, Bergman AM, Thompson CJ, Robar JL, Lisbona R, Loutfi A, Gagnon JH. Positron emission mammographic instrument: initial results. Radiology. 2000;215:280–5. doi: 10.1148/radiology.215.1.r00ap03280. [DOI] [PubMed] [Google Scholar]
- Rouse NC, Schmand M, Siegel S, Hutchins GD. Design of a small animal PET imaging system with 1 microliter volume resolution. IEEE Trans. Nucl. Sci. 2004;51:757–63. [Google Scholar]
- Santin G, Strul D, Lazaro D, Simon L, Krieguer M, Vieira Martins M, Breton V, Morel C. GATE, a GEANT4- based simulation platform for PET integrating movement and time management. IEEE Trans. Nucl. Sci. 2003;50:1516–21. [Google Scholar]
- Schmand M, Eriksson L, Casey ME, Wienhard K, Flugge G, Nutt R. Advantages using pulse shape discrimination to assign the depth of interaction information (DOI) from a multi layer phoswich detector. IEEE Trans. Nucl. Sci. 1999;46:985–90. Part 2. [Google Scholar]
- Simon L, Strul D, Santin G, Krieguer M, Morel C. Simulation of time curves in small animal PET using GATE. Nucl. Instrum. Methods A. 2004;527:190–4. [Google Scholar]
- Slavis KR, et al. Performance of a prototype CdZnTe detector module for hard X-ray astrophysics. SPIE Symp. Proc. 2000;4140:249–56. [Google Scholar]
- Staelens S, Strul D, Santin G, Vandenberghe S, Koole M, D'Asseler Y, Lemahieu I, Van de Walle R. Monte Carlo simulations of a scintillation camera using GATE: validation and application modelling. Phys. Med. Biol. 2003;48:3021–42. doi: 10.1088/0031-9155/48/18/305. [DOI] [PubMed] [Google Scholar]
- Stickel JR, Cherry SR. High-resolution PET detector design: modeling components of intrinsic spatial resolution. Phys. Med. Biol. 2005;50:179–95. doi: 10.1088/0031-9155/50/2/001. [DOI] [PubMed] [Google Scholar]
- Strulab D, Santin G, Lazaro D, Breton V, Morel C. GATE (Geant4 Application for Tomographic Emission): a PET/SPECT general-purpose simulation platform. Nucl. Phys. B (Proc. Suppl.) 2003;125:75–9. [Google Scholar]
- Tai YC, Chatziioannou A, Siegel S, Young J, Newport D, Goble RN, Nutt RE, Cherry RS. Performance evaluation of the microPET P4: a PET system dedicated to animal imaging. Phys. Med. Biol. 2001;46:1845–62. doi: 10.1088/0031-9155/46/7/308. [DOI] [PubMed] [Google Scholar]
- Tai YC, Chatziioannou AF, Yang Y, Silverman RW, Meadors K, Siegel S, Newport DF, Stickel JR, Cherry SR. MicroPET II: design, development and initial performance of an improved microPET scanner for small-animal imaging. Phys. Med. Biol. 2003;48:1519–37. doi: 10.1088/0031-9155/48/11/303. [DOI] [PubMed] [Google Scholar]
- Tai YC, Laforest R. Instrumentation aspects of animal PET. Annu. Rev. Biomed. Eng. 2005;7:255–85. doi: 10.1146/annurev.bioeng.6.040803.140021. [DOI] [PubMed] [Google Scholar]
- Tai YC, Ruangma A, Rowland D, Siegel S, Newport DF, Chow PL, Laforest R. Performance evaluation of the microPET focus: a third-generation microPET scanner dedicated to animal imaging. J. Nucl. Med. 2005;46:455–63. [PubMed] [Google Scholar]
- Vaska P, Rubins DJ, Alexoff DL, Schiffer WK. Quantitative imaging with the micro-pet small animal PET tomograph. Int. Rev. Neurobiol. 2006;73:191–218. doi: 10.1016/S0074-7742(06)73006-9. [DOI] [PubMed] [Google Scholar]
- Wong WH, Li H, Xie S, Ramirez R, Uribe J, Wang Y, Liu Y, Xing T, Baghaei H. Design of an inexpensive high-sensitivity rodent research PET (RRPET). 2003 IEEE Nuclear Science Symp. and Medical Imaging Conf. Record.2003. pp. 19–25. [Google Scholar]
- Yamaya T, et al. The jPET-D4: imaging performance of the 4-layer depth-of-interaction PET scanner. Nuclear Science Symp. Conf. Record, 2005 IEEE.2005. pp. 1977–80. [Google Scholar]
- Yang Y, Tai YC, Siegel S, Newport DF, Bai B, Li Q, Leahy RM, Cherry SR. Optimization and performance evaluation of microPET II scanner for in vivo small-animal imaging. Phys. Med. Biol. 2004;49:2527–45. doi: 10.1088/0031-9155/49/12/005. [DOI] [PubMed] [Google Scholar]
- Zhang J, Foudray AMK, Olcott PD, Levin CS. Performance characterization of a novel thin position-sensitive avalanche photodiode-based detector for high resolution PET. 2005 IEEE Nuclear Science Symp. and Medical Imaging Conf. Record; Piscataway, NJ, USA. 2005a. [Google Scholar]
- Zhang Y, Wong W-H, Baghaei H, Kim S, Li H, Liu J, Liu S, Ramirez R, Wang Y. Performance evaluation of the low-cost high-sensitivity rodent research PET (RRPET) camera using Monte Carlo simulation. 2005 IEEE Nuclear Science Symp. Conf. Record.2005b. pp. 2514–18. [Google Scholar]
- Ziemons K, et al. The ClearPET(tm) project: development of a 2nd generation high-performance small animal PET scanner. Nucl. Instrum. Methods A. 2005;537:307–311. 308. [Google Scholar]


