Abstract
AIM: To evaluate the functional differences between the 2 liver lobes in non-cirrhotic patients by using computed tomography/99mTc-galactosyl human serum albumin (CT/99mTc-GSA) single-photon emission computed tomography (SPECT) fusion images.
METHODS: Between December 2008 and March 2012, 264 non-cirrhotic patients underwent preoperative liver function assessment using CT/99mTc-GSA SPECT fusion images. Of these, 30 patients, in whom the influence of a tumor on the liver parenchyma was estimated to be negligible, were selected. Specifically, the selected patients were required to meet either of the following criteria: (1) the presence of an extrahepatic tumor; or (2) presence of a single small intrahepatic tumor. These 30 patients were retrospectively analyzed to calculate the percentage volume (%Volume) and the percentage function (%Function) of each lobe. The ratio between the %Function and %Volume (function-to-volume ratio) of each lobe was also calculated, and the ratios were compared between the 2 lobes. Furthermore, the correlations between the function-to-volume ratio and each of 2 liver parameters [lobe volume and diameter ratio of the left portal vein to the right portal vein (LPV-to-RPV diameter ratio)] were investigated.
RESULTS: The median values of %Volume and %Function were 62.6% and 67.1% in the right lobe, with %Function being significantly higher than %Volume (P < 0.01). The median values of %Volume and %Function were 31.0% and 28.7% in the left lobe, with %Function being significantly lower than %Volume (P < 0.01). The function-to-volume ratios of the right lobe (1.04-1.14) were significantly higher than those of the left lobe (0.74-0.99) (P < 0.01). The function-to-volume ratio showed no significant correlation between the lobe volume in either lobe. In contrast, the function-to-volume ratio showed significant correlations with the LPV-to-RPV diameter ratio in both lobes (right lobe: negative correlation, rs = -0.37, P = 0.048; left lobe: positive correlation, rs = 0.71, P < 0.001). The function-to-volume ratio in the left lobe tended to be higher, and that in the right lobe tended to be lower, in accordance with the increase in the LPV-to-RPV diameter ratio.
CONCLUSION: CT/99mTc-GSA SPECT fusion images demonstrated that the function of the left lobe was significantly decreased compared with that of the right lobe in non-cirrhotic livers.
Keywords: Computed tomography, 99mTc neogalactoalbumin, Single-photon emission computed tomography, Fusion image, Liver, Portal system
Core tip: This study describes that lobular differences in tracer accumulation can be observed even in patients with an apparently homogeneous liver on 99mTc-galactosyl human serum albumin (99mTc-GSA) single-photon emission computed tomography (SPECT). computed tomography/99mTc-GSA SPECT fusion images demonstrated that the function of the left lobe was significantly decreased compared with that of the right lobe in non-cirrhotic livers.
INTRODUCTION
Preoperative evaluation of future remnant liver function is critical for patients undergoing hepatic surgery[1]. Overestimation of the remnant liver function can lead to life-threatening postoperative hepatic failure, and its underestimation can lead to a lost opportunity for potentially curative surgery. Conventionally, post-hepatectomy remnant liver function has been estimated preoperatively using computed tomography (CT) volumetry[1-4]. CT can provide precise anatomical information, and the remnant liver volume, measured by CT volumetry, has been reported to be an effective predictor of hepatic dysfunction after hepatectomy[1,5-8]. However, the indirect estimation of liver function by CT volumetry is reliable only when the function is assumed to be homogenous over the whole liver[6,7]. Recent reports on liver scintigraphy showed that regional hepatic function could be significantly decreased under various conditions, such as unilateral portal flow decrease or biliary stenosis[9-15], although regional liver volume was maintained. Such observations indicate the difficulty associated with assuming strict homogeneity of the whole liver function. Therefore, accurate estimation of residual liver function, rather than estimation of residual liver volume, is more important for predicting the postoperative hepatic functional reserve[16,17].
99mTc-galactosyl human serum albumin (99mTc-GSA) single-photon emission CT (SPECT) was developed to facilitate investigations of regional hepatic function. Several reports have proved that 99mTc-GSA SPECT is more suitable for evaluating remnant liver function than CT volumetry[14,18-20]. Further improvements have resulted in the recent development of a new SPECT examination method, CT/99mTc-GSA SPECT fusion examination. A disadvantage of conventional 99mTc-GSA SPECT was poor anatomical resolution, and this newly developed SPECT has a tremendously improved anatomical resolution owing to the fusion of CT and 99mTc-GSA SPECT. Recent reports have indicated that accurate regional function, based on precise anatomical information, could be evaluated using this technique[16,21,22].
In our department, remnant liver volume and function have been routinely estimated preoperatively by using CT/99mTc-GSA SPECT fusion images since December 2008, resulting in the realization that the function of the interior portion of the left lobe was diminished compared with that of the right lobe, despite the absence of anatomical conditions suggestive of liver function heterogeneity (Figure 1). This study aimed to evaluate the functional differences between the 2 main lobes in non-cirrhotic livers. The percentage volume (%Volume) and percentage function (%Function) of each lobe were calculated using fusion images, and these data were compared between lobes.
Figure 1.
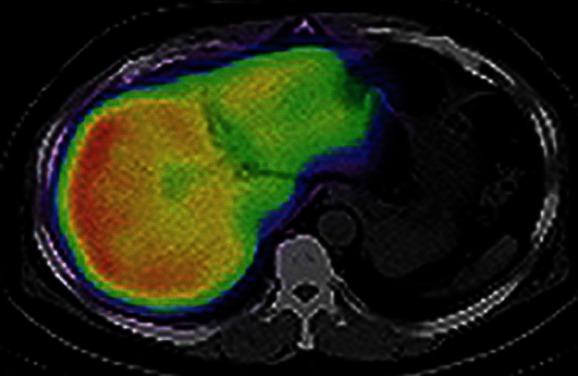
Computed tomography/99mTc-galactosyl human serum albumin single-photon emission computed tomography fusion image in a 58-year-old male with early gallbladder cancer. The uptake of 99mTc-galactosyl human serum albumin was markedly decreased in the interior portion of the left lobe. This computed tomography image was at the level of the center of the left lobe, and was neither the cranial edge nor the caudal edge of that lobe.
MATERIALS AND METHODS
Patients
Between December 2008 and March 2012, 264 non-cirrhotic patients underwent preoperative liver function assessment by using CT/99mTc-GSA SPECT fusion imaging. Cirrhotic patients were not included in this study because it is well known that the hemodynamics of bilateral portal flow and the bilateral lobe volumes are clearly different between non-cirrhotic and cirrhotic livers[23,24]. These differences might greatly influence the function of each lobe, and therefore, we investigated only non-cirrhotic livers in the current study. Each patient provided informed consent and our local ethics review committee approved the study. Of these patients, those in whom the influence of a lesion on the liver parenchyma was estimated to be negligible were selected for further study. Specifically, the selected patients were required to meet either of the following criteria: (1) presence of an extrahepatic tumor, where the tumor was close to the liver surface and had been preoperatively estimated to require hepatectomy, but both intraoperative and pathological findings showed the absence of direct tumor invasion into the liver; or (2) presence of small, intrahepatic tumors; those with large tumors were eliminated because such tumors might compress the surrounding liver parenchyma, resulting in a significant decrease in function. Eligible patients who met criterion 2 were limited to those with a single, small (< 3 cm diameter) tumor. Furthermore, the tumor had to be located on the liver surface and not in contact with a major branch of portal vein or hepatic vein. Thirty-six patients met either of these 2 criteria. Three patients treated by transcatheter arterial embolization and another 3 patients in whom the diagnosis could not be confirmed histopathologically because of the absence of surgery were excluded; thus, a total of 30 patients were included in this retrospective study. All these 30 patients underwent 4-phase multidetector-row CT (1 unenhanced image and 3 contrast-enhanced images) preoperatively, which confirmed that none had anatomical abnormalities, such as portal venous occlusion, hepatic artery stenosis, or intrahepatic biliary stenosis. Furthermore, it was also confirmed that there was no heterogeneous hepatic parenchymal enhancement in 3 contrast-enhanced images from each patient. The clinical characteristics of the 30 patients are shown in Table 1. Fifteen patients met criterion 1 [11 with early gall bladder cancer without liver invasion (Figure 2A), 1 with a gastric gastrointestinal stromal tumor (Figure 2B), 1 with peritoneal dissemination of ovarian cancer (Figure 2C), 1 with intra-abdominal recurrence of gastric cancer, and 1 with extrahepatic bile duct cancer, without jaundice]. Fifteen patients met criterion 2 [4 with hepatocellular carcinoma, 9 with liver metastasis (Figure 2D), and 2 with intrahepatic cholangiocarcinoma]. Each tumor was confirmed to meet the inclusion criteria, on the basis of the examination of surgically resected specimens.
Table 1.
Clinical characteristics of the patients
| Clinical characteristics | Statistics |
| Age, yr, (median) | 37-87 (69) |
| Sex (male:female) | 17:13 |
| Hepatitis virus | |
| Hepatitis B | 1 |
| Hepatitis C | 5 |
| Serum liver function test: median (range) | |
| Albumin level, g/dL | 4.2 (3.8-4.7) |
| Bilirubin level, mg/dL | 0.6 (0.3-1) |
| Platelet count, × 104/mL | 19.9 (14.9-41.4) |
| Prothrombin time, s | 11.8 (10.1-12.8) |
| CT attenuation value of the liver on non-enhanced CT: median (range) | |
| Right lobe, HU | 56.3 (35.0-70.5) |
| Left lobe, HU | 57.5 (39.5-73.0) |
| Diameter of portal vein: median (range) | |
| Right portal vein, mm | 10.2 (6.6-13.6)b |
| Left portal vein, mm | 8.4 (4.5-10.8)b |
| LPV-to-RPV diameter ratio: median (range) | 0.78 (0.5-1.26) |
| Disease | |
| Criterion 1: Patients with extrahepatic tumors (n) | 15 |
| Early gallbladder cancer without liver invasion | 11 |
| Gastric gastrointestinal stromal tumor | 1 |
| Peritoneal dissemination of ovarian cancer | 1 |
| Intra-abdominal recurrence of gastric cancer | 1 |
| Extrahepatic bile duct cancer without bile duct dilatation | 1 |
| Criterion 2: Patients with intrahepatic small tumors (n) | 15 |
| Hepatocellular carcinoma | 4 |
| Liver metastasis | 9 |
| Intrahepatic cholangiocarcinoma | 2 |
| Tumor location in patients within criterion 2 (n) | |
| Segment 1/segment 2/segment 3/segment 4/segment 6/segment 8 | 3/1/1/2/4/4 |
HU: Hounsfield units; CT: Computed tomography; LPV: Left portal vein; RPV: Right portal vein.
P < 0.001.
Figure 2.
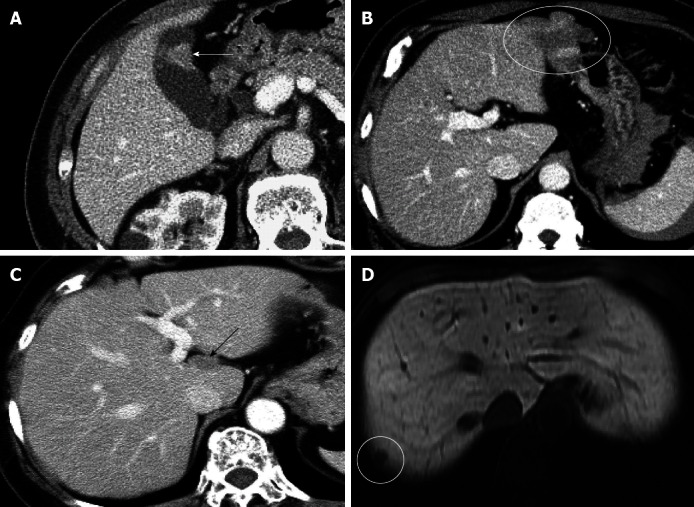
Computed tomography images of patients meeting criterion 1 or 2. A: An 82-year-old man with early gallbladder cancer, in whom the preoperative computed tomography (CT) scan showed a tumor localized in the gallbladder (white arrow); B: A 59-year-old man with gastric gastrointestinal stromal tumor, in whom a preoperative CT scan showed that the tumor had invaded the left lateral segment of the liver. However, no invasion into the liver was detected intraoperatively (circle); C: A 64-year-old woman with peritoneal dissemination of ovarian cancer, in whom a preoperative CT scan showed an implanted small tumor on the surface of the left caudate lobe (black arrow); D: A 62-year-old woman with liver metastasis, in whom a preoperative magnetic resonance image showed a small (5 mm) tumor on the liver surface (circle).
CT/99mTc-GSA SPECT fusion examination
All patients underwent CT/99mTc-GSA SPECT fusion examination with a Symbia T6 scanner (Siemens, Munich, Germany) (Figure 3). This instrument combines variable angle dual detector SPECT with 6-slice CT for rapid, accurate attenuation correction and precise localization. The instrument also enables the seamless transition from a SPECT examination to a CT examination, and both SPECT and CT images could be obtained in a single examination without the need for a position change.
Figure 3.
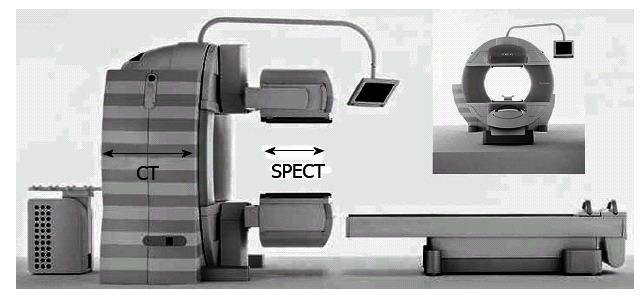
Integrated computed tomography and single-photon emission computed tomography system, consisting of variable angle dual-detector single-photon emission computed tomography and 6-slice computed tomography. The system allows the seamless transition from a single-photon emission computed tomography (SPECT) examination to a computed tomography (CT) examination.
After overnight fasting, the patient was placed in a supine position. Cardiac and respiratory synchronization were not used in this modality. Instead, to minimize the possibility of artifacts due to cardiac pulsation and respiratory motion, the patients were encouraged to rest and take a small, slow breath before image acquisition. 99mTc-diethylenetriaminepentaacetic acid-GSA (Nihon Medi-Physics, Tokyo, Japan) (185 MBq/3 mg) was injected into an antecubital vein. SPECT data acquisition (60 steps of 20 s/step, 360°, 128 × 128 matrix) was started 20 min after the injection with a low-energy, high-resolution collimator; the entire study duration was approximately 30 min. The reconstruction algorithm for SPECT was a 3-dimensional ordered subset expectation maximization, with attenuation and scatter corrections. Following SPECT examination, non-enhanced CT images were obtained under standard conditions of 130 kV, 345 mA, 12 mm table feed per rotation, 0.6-s gantry rotation time, 0.6-mm collimation, and 1-mm reconstruction. CT images were reconstructed using a standard reconstruction algorithm with a 166-cm field-of-view of the target sites. The SPECT and CT images were fused automatically using the embedded Siemens common platform software Syngo MI workplace. SPECT slice data were retrieved through Digital Imaging and Communications in Medicine (DICOM), and SPECT slices were converted to a CT-like data volume for the fusion of the SPECT and CT images.
Image analysis
All fusion images were evaluated retrospectively by hepatobiliary pancreatic surgeons with 13 and 24 years of experience. The extent of each lobe was manually circled on the non-enhanced CT image, with consensus between the evaluators, and 3 radiologists in our institution checked the accuracy in each case (Figure 4A and B). The extent of the left and right lobes was determined using anatomical landmarks, such as the middle hepatic vein and gallbladder bed, and by confirming the portal branch of segments 4, 5 and 8. The caudate lobe was excluded from the range of each lobe. The boundary between the right lobe and the caudate lobe was defined by the line connecting the bifurcation of the right portal vein (RPV) and the right wall of the inferior vena cava[25] (Figure 4B). The extent of each lobe, determined from the CT image, was automatically projected on the SPECT/CT fusion image (Figure 4C and D). The volume of each lobe was automatically determined using the Syngo software. The %Volume of each lobe was also automatically determined by dividing the volume of each lobe by the total liver volume. In the case of intrahepatic small tumors (criterion 2), tumor volumes were subtracted from the liver volumes. The %Function of each lobe was also automatically calculated by dividing the scintillation counts in each lobe by the total scintillation counts in the whole liver. The ratio between the %Function and %Volume (function-to-volume ratio) of each lobe was calculated, and the ratios were compared between the 2 lobes.
Figure 4.
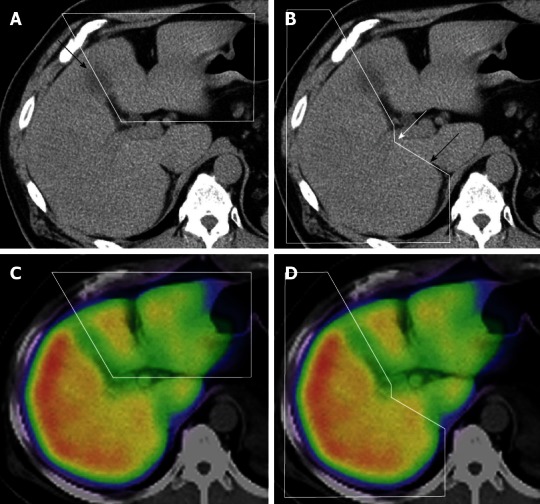
Range of each lobe on the computed tomography and computed tomography/single-photon emission computed tomography fusion image. A: The extent of the left lobe is manually circled on the non-enhanced computed tomography (CT) image. The arrow shows the gallbladder bed; B: The extent of the right lobe on the non-enhanced CT image. The boundary between the right lobe and the caudate lobe was defined by the line connecting the bifurcation of the right portal vein (white arrow) and the right wall of the inferior vena cava (black arrow); C and D: The extent of each lobe determined from the CT image was automatically projected on the single-photon emission computed tomography/CT fusion image (C: Left lobe; D: Right lobe).
Clinical liver function parameter
Serum liver function tests, including albumin level, bilirubin level, platelet count, prothrombin time, and the presence or absence of hepatitis virus were investigated in all patients. Two other parameters that might influence 99mTc-GSA accumulation in the liver were also measured on CT images. The first parameter was the degree of fat deposition, which was assessed by measuring the CT attenuation values [in Hounsfield units (HU)] on unenhanced CT images[26,27]. We delineated 12 regions of interest (ROIs) of 1 cm diameter within the liver. One ROI was defined in 4 sectors (right posterior, right anterior, left medial, and left lateral) at 3 representative levels. The levels consisted of the confluence of the right hepatic vein, the umbilical portion, and the right posterior portal vein. While defining ROIs, special attention was placed on excluding cystic areas and the vessels. The mean attenuation value of 6 ROIs in the right posterior and right anterior sectors was defined as the attenuation value of the right lobe, and that of the 6 ROIs in the left medial and lateral sector was defined as the attenuation value of the left lobe. The second parameter was the left portal vein (LPV)-to-RPV diameter ratio. The diameters of the portal veins were measured on the contrast-enhanced CT images, and the LPV-to-RPV diameter ratio was calculated.
Statistical analysis
The Wilcoxon signed-rank test was used for the following comparisons: (1) comparison of 2 liver parameters (the attenuation value on an unenhanced CT image and the diameter of the portal veins on an enhanced CT image) between the 2 lobes; (2) comparison of the diameters of the LPV and the RPV; (3) comparison of the %Volume and %Function values in each lobe; and (4) comparison of the function-to-volume ratio between the 2 lobes. The correlations between the function-to-volume ratio and the 2 liver parameters (lobe volume and LPV-to-RPV diameter ratio) were assessed using Spearman’s correlation coefficient. Data were analyzed using SPSS Statistics 19 (IBM, Armonk, NY, United States), and P < 0.05 was considered statistically significant.
RESULTS
Serum liver function test
All values of the serum liver function tests were within the reference ranges for all patients (Table 1). Hepatitis B virus antigen and hepatitis C virus antibody were positive in 1 and 5 patients, respectively. However, none of them were associated with active hepatitis, and none of them showed clinical symptoms of hepatitis. There were no cases of non-B, non-C hepatitis.
Degree of fat deposition in each lobe
The attenuation value of the right lobe ranged from 35.0 to 70.5 HU (median, 56.3 HU), and that of the left lobe ranged from 39.5 to 73.0 HU (median, 57.5 HU). Only 2 of 30 patients showed severe fatty change with an attenuation value of < 40 HU. There were no significant differences between the attenuation values of the 2 lobes.
Diameter of the LPV and the RPV
The diameter of the RPV ranged from 6.6 to 13.6 mm (median, 10.2 mm), and that of the LPV ranged from 4.5 to 10.8 mm (median, 8.4 mm). The diameters of the RPV were significantly larger than those of the LPV (P < 0.001). The LPV-to-RPV diameter ratios ranged from 0.5 to 1.26.
Comparison of the %Volume and %Function in each lobe
The extent of each lobe could be clearly defined on the CT image, and both %Volume and %Function in each lobe could be calculated for all patients. The %Volume and %Function of the right lobe ranged from 51.5% to 77.8% (median, 62.6%) and from 55.6% to 83.8% (median, 67.1%), respectively (Figure 5); the %Function was significantly higher than the %Volume in the right lobe (P < 0.01). The %Volume and %Function in the left lobe ranged from 20.2% to 44.2% (median, 31.0%) and from 17.4% to 42.0% (median, 28.7%), respectively (Figure 5); the %Function was significantly lower than the %Volume in the left lobe (P < 0.01).
Figure 5.
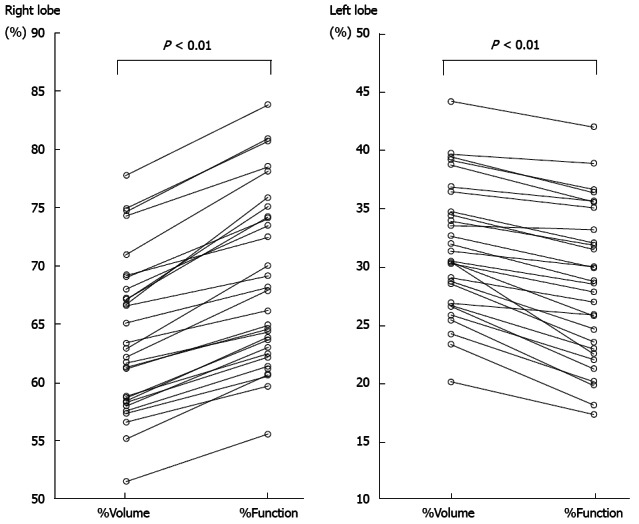
Percentage volume and percentage function of each lobe. The %Function was significantly higher than the %Volume in the right lobe (P < 0.01). The %Function was significantly lower than the %Volume in the left lobe (P < 0.01).
Comparison of the function-to-volume ratio between lobes
The function-to-volume ratio of the right lobe ranged from 1.04 to 1.14 (median, 1.08), and this ratio was > 1.0 in all patients (Figure 6). The function-to-volume ratio of the left lobe ranged from 0.74 to 0.99 (median, 0.92), and this ratio was < 1.0 in all patients. The function-to-volume ratios of the right lobe were significantly higher than those of the left lobe (P < 0.01).
Figure 6.
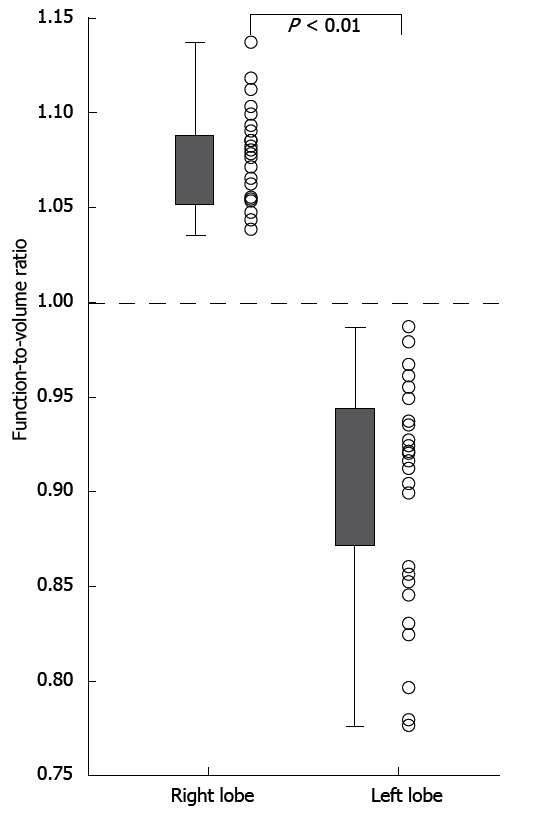
Comparison of the function-to-volume ratio between the right and left lobes. The function-to-volume ratios of the right lobe were significantly higher than those of the left lobe (P < 0.01).
Correlation between the function-to-volume ratio and 2 liver parameters (lobe volume and LPV-to-RPV diameter ratio)
The function-to-volume ratio showed no significant correlation with lobe volume in either lobe (right lobe; rs = 0.19, P = 0.29, left lobe; rs = 0.21, P = 0.23). In contrast, the function-to-volume ratio showed a significant correlation with LPV-to-RPV diameter ratio in both lobes (right lobe; negative correlation, rs = -0.37, P = 0.048, left lobe; positive correlation, rs = 0.71, P < 0.001) (Figure 7).
Figure 7.
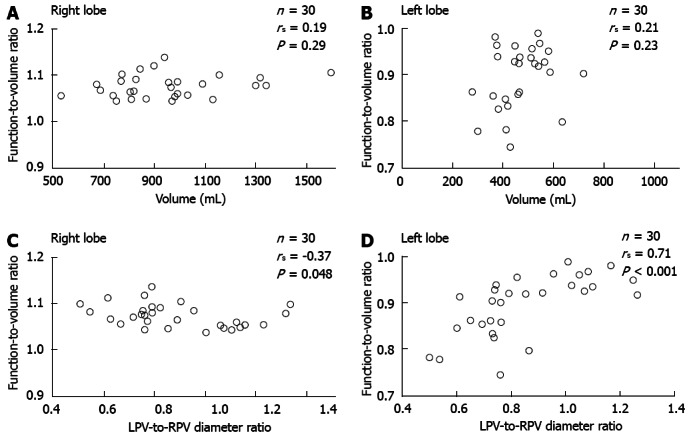
Correlation between the function-to-volume ratio and 2 liver parameters in each lobe. A and B: The function-to-volume ratio showed no significant correlation with lobe volume in either lobe; C and D: The function-to-volume ratio showed a significant correlation with the ratio of the diameter of the LPV to that of the RPV in both lobes (C: Right lobe, negative correlation; D: Left lobe, positive correlation). LPV: Left portal vein; RPV: Right portal vein.
DISCUSSION
Conventionally, future remnant liver function after hepatectomy has been estimated using CT volumetry. Simulation by CT volumetry is satisfactory because it has better resolution and can provide precise anatomical information, if the function of the whole liver can be assumed to be homogeneous[1,5-8]. However, recent reports on the use of 99mTc-GSA scintigraphy have shown that regional hepatic function is significantly decreased when conditions such as biliary stenosis or unilaterally decreased portal flow exist[9-15]. The liver parenchyma, the area surrounding the tumor, has also been reported to be damaged by mechanical compression caused by intrahepatic tumors[5]. Therefore, accurate estimation of residual liver function, rather than estimation of residual liver volume, is more important for predicting postoperative hepatic functional reserve, and this has led to the development of 99mTc-GSA SPECT[1,6,16,20,28]. Several studies have shown that preoperative estimates of remnant liver function from 99mTc-GSA scintigraphy show better correlation than those from CT volumetry with postoperative liver function tests; therefore, 99mTc-GSA scintigraphy provides a better prediction of postoperative liver function[14,18-20]. Although this scintigraphic examination is not yet widely used worldwide, it is recognized as a useful modality for preoperative liver function assessment in Japan, and we have decided the surgical indication on the basis of the estimated remnant liver function ratio measured by this modality. The plasma clearance rate of indocyanine green (ICGK) was measured preoperatively in each patient, and a patient with a future liver remnant ICGK value (ICGK × remnant liver function ratio) of > 0.05 was considered a candidate for hepatectomy[29].
In this study, the volume ratio and the functional ratio of the 2 lobes were accurately measured using the newly developed CT/99mTc-GSA SPECT fusion imaging technique. Although contrast-enhanced CT has usually been employed for volumetry, the anatomical landmarks could be confirmed in all cases in this non-enhanced CT. Therefore, setting the boundary between the 2 lobes was not complicated, and it could be performed reliably with confirmation by radiologists. The functional ratio was approximately 8% higher than the volume ratio in the right lobe and approximately 8% lower than the volume ratio in the left lobe. Furthermore, there were significant correlations between the function-to-volume ratio and the LPV-to-RPV diameter ratio in both lobes. The function-to-volume ratio in the left lobe tended to be higher, and that in the right lobe tended to be lower, in accordance with the increase of the diameter ratio.
This appears to be the first report to describe the functional differences between the 2 hepatic lobes using 99mTc-GSA scintigraphy. A few reports on liver scintigraphy with other agents, such as 99mTc-dimethyliminodiacetic acid for biliary scintigraphy and radiolabeled colloids for depiction of the reticuloendothelial system, have also shown lower uptake in the left liver lobe than in the right lobe[30,31]. The results of this study indicate that postsurgical remnant liver function and the tolerable extent of hepatectomy might change depending on the region of the hepatectomy. Residual liver function might be less after right-sided hepatectomy than after left-sided hepatectomy, even if the hepatectomy volumes were equivalent.
Four possible causative factors for the functional discrepancy between the 2 lobes were estimated. First, the partial volume effect (PVE) of the peripheral part of the liver: the scintillation counts in the left lobe might have been underestimated owing to it being relatively thinner than the right lobe. However, we originally began this research because we realized there was decreased function in the interior portion of the left lobe on the fusion images. Furthermore, if PVE is the main cause of the functional decrease in the left lobe, the function-to-volume ratio should become higher in accordance with the increase in the lobe volume. However, there was no correlation between the lobe volume and the function-to-volume ratio. Second, the effect of tracer accumulation in the heart: to confirm the presence or absence of artifacts from tracer accumulation in the heart, we checked all SPECT images of all 30 patients, and no apparent artifact could be confirmed. Third, heterogeneous fat deposition: we investigated the mean CT attenuation values of the 2 lobes on non-enhanced CT images because the degree of fat deposition might influence the tracer accumulation. However, there were no differences in the degree of fat deposition between the 2 lobes. We concluded that the influences of these 3 factors were not significant, even if they could not be completely excluded from contributing to the functional discrepancy between the 2 lobes. Fourth, the portal flow difference: it is speculated that the difference in the bilateral portal flow might be the cause of the functional discrepancy. It is well known that the bilateral portal veins are developmentally distinct[32] and that the blood flow of the LPV is decreased compared with that of the RPV in non-cirrhotic livers[23,24]. During the early fetal period, the right and left hepatic lobes are not connected[32]. The main portal vein, which flows into the RPV, supplies blood only to the right lobe. The LPV, which is not connected to the portal vein, receives blood from the left umbilical vein. Subsequently, the LPV joins the RPV through an almost 90° right turn. Within a week of birth, the infant’s umbilical vein is completely obliterated, and the placental blood supply to the left lobe is cut off with the main circulation to the liver being taken over by the portal vein that was previously supplying only the right lobe. The left lobe is then supplied with blood only from the LPV, and blood flow in the LPV is less than that of the RPV[23]. Although the liver receives a dual blood supply from the portal vein and the hepatic artery, a decrease in portal flow without an arterial flow change can cause significant decreases in regional function[14,15,22]. Previous studies showed that a reduction in unilateral portal flow induced a decrease in both the function and the volume of the ipsilateral lobe, and the degree of the functional decrease was significantly higher than the degree of the volume decrease[14,15,22]. The decreased function observed in the left lobe in this study was also thought to be attributed to the lower flow volume in the LPV compared with that in the RPV. Although the measurement of the portal flow volume by Doppler ultrasound would be most appropriate to prove this speculation, we had no such data. Instead, we measured the diameter of the bilateral portal veins on CT images. Although the diameter of the portal vein could not directly indicate the portal flow volume, it is one of 2 factors that define the blood flow volume[23,24]. In this study, the LPV-to-RPV diameter ratio showed a significant correlation with the function-to-volume ratio in both lobes, indicating that portal flow significantly influenced the function of the 2 lobes.
Despite the novel findings of this study, it does have some limitations. First, although intrahepatic tumors in the surgical cases were limited to small tumors and the influence of the tumor on the surrounding parenchyma was estimated to be negligible, we cannot be certain that these tumors had no effect. However, the number of cases of right-sided tumors was higher than the number of cases of left-sided tumors (8 tumors in the right lobe and 4 tumors in the left lobe). Thus, although these tumors might have caused some degree of functional decrease, the decrease would more often have been associated with the right lobe. Second, although the lower function in the left lobe can be explained by decreased left portal flow, the mechanism of the functional discrepancy between the 2 lobes has not been sufficiently elucidated, and further investigation is necessary.
In conclusion, the results of this study on the use of CT/99mTc-GSA SPECT fusion images indicated that the function of the left lobe was significantly decreased compared with that of the right lobe in non-cirrhotic livers. The function-to-volume ratio of each lobe showed a significant correlation with the LPV-to-RPV diameter ratio.
COMMENTS
Background
Preoperative evaluation of future remnant liver function is critical for patients undergoing hepatic surgery. In authors’ department, remnant liver volume and function have been routinely estimated preoperatively using computed tomography/99mTc-galactosyl human serum albumin (CT/99mTc-GSA) single-photon emission computed tomography (SPECT) fusion imaging since December 2008, resulting in the realization that the function of the interior portion of the left lobe was diminished compared with that of the right lobe, despite the absence of anatomical conditions suggestive of liver function heterogeneity. This study aimed to evaluate the functional differences between the 2 main lobes in non-cirrhotic livers.
Research frontiers
Although recent reports have indicated the effectiveness of this newly developed CT/9mTc-GSA SPECT fusion imaging technique for estimating the future remnant liver function, there have been no reports on the heterogeneous GSA accumulation between the 2 lobes.
Innovations and breakthroughs
The results of this study on the use of CT/99mTc-GSA SPECT fusion imaging indicated that the function of the left lobe was significantly decreased compared with that of the right lobe in non-cirrhotic livers. Furthermore, the function-to-volume ratio of each lobe showed a significant correlation with the left portal vein-to-right portal vein diameter ratio.
Applications
The results of this study indicate that postsurgical remnant liver function and the tolerable extent of hepatectomy might change depending on the region of the hepatectomy. The residual liver function might be less after right-sided hepatectomy than after left-sided hepatectomy, even if the hepatectomy volumes were equivalent.
Terminology
CT/99mTc-GSA SPECT fusion examination is a newly developed SPECT examination method. Conventional 99mTc-GSA SPECT has the disadvantage of poor anatomical resolution, and this newly developed SPECT has a tremendously improved anatomical resolution owing to the fusion of CT and 99mTc-GSA SPECT.
Peer review
This study describes that lobular differences in tracer accumulation can be observed even in patients with an apparently homogeneous liver on 99mTc-GSA SPECT. This finding is potentially important in the preoperative evaluation of future remnant liver function.
Footnotes
P- Reviewers Dumitrascu DL, Nilsson H, Yamada A S- Editor Wen LL L- Editor Cant MR E- Editor Ma S
References
- 1.Seyama Y, Kokudo N. Assessment of liver function for safe hepatic resection. Hepatol Res. 2009;39:107–116. doi: 10.1111/j.1872-034X.2008.00441.x. [DOI] [PubMed] [Google Scholar]
- 2.Okamoto E, Kyo A, Yamanaka N, Tanaka N, Kuwata K. Prediction of the safe limits of hepatectomy by combined volumetric and functional measurements in patients with impaired hepatic function. Surgery. 1984;95:586–592. [PubMed] [Google Scholar]
- 3.Kubota K, Makuuchi M, Kusaka K, Kobayashi T, Miki K, Hasegawa K, Harihara Y, Takayama T. Measurement of liver volume and hepatic functional reserve as a guide to decision-making in resectional surgery for hepatic tumors. Hepatology. 1997;26:1176–1181. doi: 10.1053/jhep.1997.v26.pm0009362359. [DOI] [PubMed] [Google Scholar]
- 4.Shirabe K, Shimada M, Gion T, Hasegawa H, Takenaka K, Utsunomiya T, Sugimachi K. Postoperative liver failure after major hepatic resection for hepatocellular carcinoma in the modern era with special reference to remnant liver volume. J Am Coll Surg. 1999;188:304–309. doi: 10.1016/s1072-7515(98)00301-9. [DOI] [PubMed] [Google Scholar]
- 5.Imaeda T, Kanematsu M, Asada S, Seki M, Doi H, Saji S. Utility of Tc-99m GSA SPECT imaging in estimation of functional volume of liver segments in health and liver diseases. Clin Nucl Med. 1995;20:322–328. doi: 10.1097/00003072-199504000-00008. [DOI] [PubMed] [Google Scholar]
- 6.Mitsumori A, Nagaya I, Kimoto S, Akaki S, Togami I, Takeda Y, Joja I, Hiraki Y. Preoperative evaluation of hepatic functional reserve following hepatectomy by technetium-99m galactosyl human serum albumin liver scintigraphy and computed tomography. Eur J Nucl Med. 1998;25:1377–1382. doi: 10.1007/s002590050311. [DOI] [PubMed] [Google Scholar]
- 7.Schindl MJ, Redhead DN, Fearon KC, Garden OJ, Wigmore SJ. The value of residual liver volume as a predictor of hepatic dysfunction and infection after major liver resection. Gut. 2005;54:289–296. doi: 10.1136/gut.2004.046524. [DOI] [PMC free article] [PubMed] [Google Scholar]
- 8.de Graaf W, van Lienden KP, Dinant S, Roelofs JJ, Busch OR, Gouma DJ, Bennink RJ, van Gulik TM. Assessment of future remnant liver function using hepatobiliary scintigraphy in patients undergoing major liver resection. J Gastrointest Surg. 2010;14:369–378. doi: 10.1007/s11605-009-1085-2. [DOI] [PMC free article] [PubMed] [Google Scholar]
- 9.Akaki S, Mitsumori A, Kanazawa S, Takeda Y, Joja I, Hiraki Y, Sakaguchi K. Reduced radioactivity in the periphery of the liver in a patient with idiopathic portal hypertension. Clin Nucl Med. 1997;22:369–371. doi: 10.1097/00003072-199706000-00004. [DOI] [PubMed] [Google Scholar]
- 10.Akaki S, Mitsumori A, Kanazawa S, Togami I, Takeda Y, Joja I, Hiraki Y. Technetium-99m-DTPA-galactosyl human serum albumin liver scintigraphy evaluation of regional CT/MRI attenuation/signal intensity differences. J Nucl Med. 1998;39:529–532. [PubMed] [Google Scholar]
- 11.Akaki S, Kanazawa S, Tsunoda M, Okumura Y, Togami I, Kuroda M, Takeda Y, Hiraki Y. Nontumorous decrease in Tc-99m GSA accumulation. Ann Nucl Med. 2000;14:477–483. doi: 10.1007/BF02988294. [DOI] [PubMed] [Google Scholar]
- 12.Akaki S, Okumura Y, Yasui K, Kanazawa S, Togami I, Takeda Y, Hiraki Y. Three different areas of decreased hepatic radioactivity secondary to a hilar mass. Clin Nucl Med. 2001;26:243–244. doi: 10.1097/00003072-200103000-00017. [DOI] [PubMed] [Google Scholar]
- 13.Jonas E, Hultcrantz R, Slezak P, Blomqvist L, Schnell PO, Jacobsson H. Dynamic 99Tcm-HIDA SPET: non-invasive measuring of intrahepatic bile flow. Description of the method and a study in primary sclerosing cholangitis. Nucl Med Commun. 2001;22:127–134. doi: 10.1097/00006231-200102000-00003. [DOI] [PubMed] [Google Scholar]
- 14.Akaki S, Okumura Y, Sasai N, Sato S, Tsunoda M, Kuroda M, Kanazawa S, Hiraki Y. Hepatectomy simulation discrepancy between radionuclide receptor imaging and CT volumetry: influence of decreased unilateral portal venous flow. Ann Nucl Med. 2003;17:23–29. doi: 10.1007/BF02988255. [DOI] [PubMed] [Google Scholar]
- 15.Nanashima A, Sumida Y, Abo T, Sakamoto I, Ogawa Y, Sawai T, Takeshita H, Hidaka S, Nagayasu T. Usefulness of measuring hepatic functional volume using Technetium-99m galactosyl serum albumin scintigraphy in bile duct carcinoma: report of two cases. J Hepatobiliary Pancreat Surg. 2009;16:386–393. doi: 10.1007/s00534-008-0033-y. [DOI] [PubMed] [Google Scholar]
- 16.Iimuro Y, Kashiwagi T, Yamanaka J, Hirano T, Saito S, Sugimoto T, Watanabe S, Kuroda N, Okada T, Asano Y, et al. Preoperative estimation of asialoglycoprotein receptor expression in the remnant liver from CT/99mTc-GSA SPECT fusion images correlates well with postoperative liver function parameters. J Hepatobiliary Pancreat Sci. 2010;17:673–681. doi: 10.1007/s00534-010-0264-6. [DOI] [PubMed] [Google Scholar]
- 17.Yokoyama Y, Nagino M, Nishio H, Ebata T, Igami T, Nimura Y. Recent advances in the treatment of hilar cholangiocarcinoma: portal vein embolization. J Hepatobiliary Pancreat Surg. 2007;14:447–454. doi: 10.1007/s00534-006-1193-2. [DOI] [PubMed] [Google Scholar]
- 18.Kwon AH, Matsui Y, Ha-Kawa SK, Kamiyama Y. Functional hepatic volume measured by technetium-99m-galactosyl-human serum albumin liver scintigraphy: comparison between hepatocyte volume and liver volume by computed tomography. Am J Gastroenterol. 2001;96:541–546. doi: 10.1111/j.1572-0241.2001.03556.x. [DOI] [PubMed] [Google Scholar]
- 19.Satoh K, Yamamoto Y, Nishiyama Y, Wakabayashi H, Ohkawa M. 99mTc-GSA liver dynamic SPECT for the preoperative assessment of hepatectomy. Ann Nucl Med. 2003;17:61–67. doi: 10.1007/BF02988261. [DOI] [PubMed] [Google Scholar]
- 20.de Graaf W, Bennink RJ, Veteläinen R, van Gulik TM. Nuclear imaging techniques for the assessment of hepatic function in liver surgery and transplantation. J Nucl Med. 2010;51:742–752. doi: 10.2967/jnumed.109.069435. [DOI] [PubMed] [Google Scholar]
- 21.Yumoto Y, Yagi T, Sato S, Nouso K, Kobayashi Y, Ohmoto M, Yumoto E, Nagaya I, Nakatsukasa H. Preoperative estimation of remnant hepatic function using fusion images obtained by (99m)Tc-labelled galactosyl-human serum albumin liver scintigraphy and computed tomography. Br J Surg. 2010;97:934–944. doi: 10.1002/bjs.7025. [DOI] [PubMed] [Google Scholar]
- 22.Beppu T, Hayashi H, Okabe H, Masuda T, Mima K, Otao R, Chikamoto A, Doi K, Ishiko T, Takamori H, et al. Liver functional volumetry for portal vein embolization using a newly developed 99mTc-galactosyl human serum albumin scintigraphy SPECT-computed tomography fusion system. J Gastroenterol. 2011;46:938–943. doi: 10.1007/s00535-011-0406-x. [DOI] [PubMed] [Google Scholar]
- 23.Kutlu R, Karaman I, Akbulut A, Baysal T, Sigirci A, Alkan A, Aladag M, Seckin Y, Saraç K. Quantitative Doppler evaluation of the splenoportal venous system in various stages of cirrhosis: differences between right and left portal veins. J Clin Ultrasound. 2002;30:537–543. doi: 10.1002/jcu.10114. [DOI] [PubMed] [Google Scholar]
- 24.Nishihara K, Sakata K, Yagyu T, Nakashima K, Suzuki T. Relationship between peripheral portal blood flow and liver function in patients with liver cirrhosis. Pulsed Doppler ultrasonographic study. Scand J Gastroenterol. 1994;29:859–864. doi: 10.3109/00365529409092524. [DOI] [PubMed] [Google Scholar]
- 25.Awaya H, Mitchell DG, Kamishima T, Holland G, Ito K, Matsumoto T. Cirrhosis: modified caudate-right lobe ratio. Radiology. 2002;224:769–774. doi: 10.1148/radiol.2243011495. [DOI] [PubMed] [Google Scholar]
- 26.Kodama Y, Ng CS, Wu TT, Ayers GD, Curley SA, Abdalla EK, Vauthey JN, Charnsangavej C. Comparison of CT methods for determining the fat content of the liver. AJR Am J Roentgenol. 2007;188:1307–1312. doi: 10.2214/AJR.06.0992. [DOI] [PubMed] [Google Scholar]
- 27.Boyce CJ, Pickhardt PJ, Kim DH, Taylor AJ, Winter TC, Bruce RJ, Lindstrom MJ, Hinshaw JL. Hepatic steatosis (fatty liver disease) in asymptomatic adults identified by unenhanced low-dose CT. AJR Am J Roentgenol. 2010;194:623–628. doi: 10.2214/AJR.09.2590. [DOI] [PubMed] [Google Scholar]
- 28.Kadono J, Kumemura H, Nishida S, Nakamura N, Gejima K, Nakajo M, Tsuchimochi S, Matsumoto J, Hamada N, Sakata R. 99mTc-DTPA-galactosyl-human-serum-albumin liver scintigraphy for evaluating hepatic functional reserve before hepatectomy in a patient with indocyanine green excretory defect: report of a case. Surg Today. 2006;36:481–484. doi: 10.1007/s00595-005-3181-6. [DOI] [PubMed] [Google Scholar]
- 29.Yokoyama Y, Nishio H, Ebata T, Igami T, Sugawara G, Nagino M. Value of indocyanine green clearance of the future liver remnant in predicting outcome after resection for biliary cancer. Br J Surg. 2010;97:1260–1268. doi: 10.1002/bjs.7084. [DOI] [PubMed] [Google Scholar]
- 30.Jacobsson H, Jonas E, Hellström PM, Larsson SA. Different concentrations of various radiopharmaceuticals in the two main liver lobes: a preliminary study in clinical patients. J Gastroenterol. 2005;40:733–738. doi: 10.1007/s00535-005-1617-9. [DOI] [PubMed] [Google Scholar]
- 31.Jacobsson H, Hellström PM, Kogner P, Larsson SA. Different concentrations of I-123 MIBG and In-111 pentetreotide in the two main liver lobes in children: persisting regional functional differences after birth? Clin Nucl Med. 2007;32:24–28. doi: 10.1097/01.rlu.0000249592.95945.e4. [DOI] [PubMed] [Google Scholar]
- 32.Fasouliotis SJ, Achiron R, Kivilevitch Z, Yagel S. The human fetal venous system: normal embryologic, anatomic, and physiologic characteristics and developmental abnormalities. J Ultrasound Med. 2002;21:1145–1158. doi: 10.7863/jum.2002.21.10.1145. [DOI] [PubMed] [Google Scholar]


