

Abstract
AIM: To identify peripheral blood mononuclear cell (PBMC) gene expression profiles of ulcerative colitis (UC) patients, using oligonucleotide microarrays, to gain insights into UC molecular mechanisms.
METHODS: The Human OneArray microarrays were used for a complete genome-wide transcript profiling of PBMCs from 12 UC patients and 6 controls. Differential analysis per gene was performed with a random variance model; t test and P values were adjusted to control the false discovery rate (5%). Gene ontology (GO) was deployed to analyze differentially expressed genes at significant levels between patients and controls to identify the biological processes involved in UC.
RESULTS: Comparative analysis revealed that 4438 probes (4188 genes) were differentially expressed between the two groups, of which 3689 probes (3590 genes) were down-regulated whereas 749 probes (598 genes) were up-regulated. Many disregulated genes in our data have been reported by previous microarray studies carried out on intestinal mucosa samples, such as S100A8, CEACAM1 and S100A9. GO enrichment analysis revealed 67 high enrichment up-regulated categories and one significant down-regulated category. The up-regulated genes were mainly involved in immune and inflammatory response, cell cycle and proliferation, DNA metabolism and repair.
CONCLUSION: Gene expression profiling of PBMCs from patients with UC has highlighted several novel gene categories that could contribute to the pathogenesis of UC.
Keywords: Ulcerative colitis, Microarray, Gene ontology, Peripheral blood mononuclear cells
Core tip: Evidence indicates that peripheral blood immune cells play a vital role in the pathogeny of ulcerative colitis (UC). This study identified genome-wide gene expression profiles of peripheral blood mononuclear cells in UC, and gene ontology analysis highlighted the significance of several categories related to immune and inflammatory responses, cell cycle and proliferation, and DNA repair. The gene enrichment analysis provides greater understanding of the processes that may be involved in UC.
INTRODUCTION
Ulcerative colitis (UC) is a form of chronic inflammatory bowel disease (IBD) characterized by chronic and recurrent inflammation of the colonic mucosa, often resulting in intermittent bloody diarrhea and abdominal pain[1]. UC used to be considered western population-specific. However, recent investigation has revealed that the incidence and prevalence of the disease in Asia have increased significantly[2]. Taking China as an example, the number of 140120 cases of UC have been observed in the last 15 years, with an 8.5-fold increase during the last 5 years compared with the first 5 years[3]; conservative speculation from the reported cases indicate the incidence has reached 11.6/100000[4].
Microarray analysis of global gene expression at the RNA level has generated new insights into the biological phenomena under investigation. Previous studies have successfully applied microarray technology to investigate the gene expression profile of resected specimens[5-7] and endoscopic pinch mucosal biopsies[8-13] from IBD, with the goal of identifying diagnostic or prognostic markers and therapeutic target genes of the diseases. The principal disregulated genes revealed some similar biological processes, but there is little overlap between the individual genes among these data. In contrast to most studies utilizing intestinal tissue, taking peripheral blood mononuclear cells (PBMCs) is more accessible as this source of gene expression material offers the possibility of sampling any individual for future diagnosis. What is more important, PBMCs may be considered as a part of the intestinal immune system and contribute to the exacerbation and perpetuation of inflammation in UC. Firstly, PBMCs are found migrating between blood and intestine[14], and labeled peripheral granulocytes and monocytes can be accumulated rapidly in the diseased gut of IBD patients[15]; this movement has a positive correlation to the disease activity[14]. Secondly, peripheral mononuclear cells in active IBD are found to release increased amounts of many proinflammatory mediators[16]. In vitro study found a cytotoxic effect in human fetal colon cells that was released by PBMCs in UC patients[17]. Leukocytapheresis therapy, through removing a portion of activated immunocytes from the peripheral blood[18], indeed achieves a super effect and a lower incidence of adverse effects than high-dose steroids in a proportion of IBD patients[19].
Given that PBMCs may play a vital role in the pathogenesis of UC and that the mechanism is still obscure, we hope to clarify the molecular processes involved in the etiopathogenesis of UC that are represented by differentially expressed genes. We recruited twelve UC patient and six healthy controls to compare gene expression profile differences in PBMCs and then, through system biology tools, some useful information was found hidden behind the lists of significantly up- and down-regulated genes that may be further illustrate the pathogenesis of UC.
MATERIALS AND METHODS
Patient selection and blood sample processing
The diagnoses of patients were based on a combination of clinical features, endoscopy and pathology findings using standard diagnostic criteria[4,20]. Two groups of patient samples were recruited at the First Affiliated Hospital of Kunming Medical University. Group one was composed of 12 UC patients (half males and half females, mean age 36.25 ± 10.98 years; range 19-60 years, Table 1) and 6 healthy controls (3 females, mean age 35.17 ± 14.88 years; range 19-60 years) for microarray analysis. Median duration of disease was 4.33 years (range 1-12 years). At the time of recruitment, four patients were not receiving therapy, eight patients were receiving 5-aminosalicylic acid treatment, and none of them had taken corticosteroids or immunodepressants during the three months preceding their enrolment. The Sutherland Disease Activity Index was used to assess disease activity; all the patients were in active stage (scores ranging from 5 to 12). Group two was extended to 21 patients (mean age 30 ± 9.58 years; range 20-46 years) and 21 age- and sex-matched healthy individuals (mean age 32 ± 11.3 years; range 24-50 years) for the subsequent reverse transcription polymerase chain reaction (RT-PCR) analysis intending to verify and investigate the epidemiology of interesting markers.
Table 1.
Subject characteristics
| No. | Age (yr) | Sex | Duration (yr) | Extent | SDAI | Therapy |
| 1 | 19 | F | 1 | Proctitis | 5 | No therapy |
| 2 | 27 | F | 5 | Proctosigmoiditis | 7 | 5-ASA |
| 3 | 30 | F | 2 | Proctosigmoiditis | 6 | No therapy |
| 4 | 34 | F | 2 | Proctosigmoiditis | 7 | No therapy |
| 5 | 40 | F | 4 | Left sided colitis | 9 | 5-ASA |
| 6 | 45 | F | 3 | Left sided colitis | 8 | 5-ASA |
| 7 | 22 | M | 3 | Proctosigmoiditis | 7 | 5-ASA |
| 8 | 33 | M | 7 | Pancolitis | 10 | 5-ASA |
| 9 | 37 | M | 2 | Proctosigmoiditis | 8 | No therapy |
| 10 | 40 | M | 5 | Pancolitis | 9 | 5-ASA |
| 11 | 48 | M | 6 | Left sided colitis | 8 | 5-ASA |
| 12 | 60 | M | 12 | Pancolitis | 12 | 5-ASA |
M: Male; F: Female; 5-ASA: 5-Aminosalicylic acid; SDAI: Sutherland disease activity index.
To avoid the potential effect of diseases or conditions other than UC, which may lead to gene expression changes in PBMCs, the following strict exclusion criteria were implemented to screen combined diseases of (1) immune deficiency disease; (2) autoimmune-related diseases; (3) hematological diseases; and (4) any treatment or disease that would be an apparent factor affecting gene expression in these cells (e.g., chronic obstructive pulmonary disease, allergy, smoking, chronic alcohol consumption, hormonal or other medications, etc.). Controls were persons who receiving a regular medical checkup at the First Affiliated Hospital of Kunming Medical University with the excluded diseases or factors mentioned above.
After obtaining approval of the Institutional Review Board and Ethics Committee, and informed consent of all 60 individuals, blood samples (10 mL) were collected at the Clinical Laboratory of First Affiliated Hospital of Kunming Medical University, and then PBMCs were isolated immediately. Each PBMC biopsy was added to 1 mL TRIzol Reagent (Invitrogen, CA, United States) and then kept at -80 °C until isolation of the RNA.
RNA isolation and microarray experiments
The RNA amplification, labeling, hybridization, and data extraction were performed at the National Engineering Research Center for Biochip at Shanghai. Briefly, total RNA was extracted from PBMCs with Trizol Reagent (Invitrogen, United States), then purified to remove genomic DNA contamination and concentrated using an Rneasy Plus Mini kit (Qiagen, Hilden, Germany). RNA quality was assessed by determining the 26S/18S ratio using a Bioanalyzer 2100 (Agilent, CA, United States). Two micrograms of RNA from each subject of group one was converted into cyanine-5 labeled target cRNA, then hybridized to the Human OneArray microarray (Phalanx Biotech Group, Taiwan, China) containing 32050 oligonucleotides: 30968 human genome probes and 1082 experimental control probes. A complete description of the array is available at www.phalanxbiotech.com. The followed procedure was washing, scanning and extracting gene expression results (DNA Microarray Scanner G2565B, Agilent, United States) according to the manufacturer’s protocol. Raw intensity values were normalized and log-transformed by GeneSpring GX 10 software (Agilent Technologies, United States).
Statistical analysis
We applied the rostral ventromedial medulla (RVM) t test to filter the differentially expressed genes for the control and experimental groups because the RVM t test can raise degrees of freedom effectively in the cases of small samples. After the significant analysis and false discovery rate (FDR) analysis, we selected the differentially expressed genes according to the P < 0.01 as a threshold. Gene ontology (GO) analysis was applied in order to organize disregulated genes into hierarchical categories according to the key functional classification of the National Center for Biotechnology Information, and to uncover the gene regulatory network on the basis of biological process and molecular function[21]. Generally, Fisher’s exact test and χ2 test were used to classify the GO category, and the FDR[22] was calculated to correct the P value, since the smaller the FDR, the smaller the error in judging P value. We chose only GO categories that had a P of < 0.01. Within the significant category, the enrichment Re was given by Re = (nf/n)/(Nf/N) where nf is the number of differential genes within the particular category, n is the total number of genes within the same category, Nf is the number of differential genes in the entire microarray, and N is the total number of genes in the microarray[23].
Validation of microarray results by semi-quantitative RT-PCR
For the second part of our study, mRNA from 21 UC patients and 21 age- and sex-matched controls was used for RT-PCR. Primers for PCR validations were designed using Primer-3 software[24]. Primer sequences are presented in Table 2. Total RNA was extracted from PBMCs and purified using the Rneasy Kit according to the manufacturer’s instruction (Qiagen, United States) and converted to cDNA by moloney murine leukemia virus reverse transcriptase with oligo(dT) primer in the presence of RNAsin (Stratagen, United States). After reverse transcription, 1/10th of the cDNA was used for each PCR reaction with 0.2 μmol/L of each primer, 100 μmol/L dNTPs, 2 mmol/L MgCl2, and 1 U Taq polymerase (Promega, Madison, WI, United States). Cycling conditions were the same for all primer pairs: 94 °C for 2 min, and then 30 cycles at 94 °C for 30 s followed by 55 °C for 45 s and 72 °C for 45 s. β-Actin served as a quantitative control and its sense primer is 5’-TTCCAGCCTTCCTTCCTGG-3’ and antisense primer, 5’-TTGCGCTCAGGAGGAGCAAT-3’. PCR products were fractionated by agarose electrophoresis, stained with ethidium bromide, and visualized under ultraviolet light. Densitometric analysis was done using Bio-Rad’s Quantity One software. Statistical significance was tested using Student’s t test.
Table 2.
Primers used for semiquantitative reverse transcription-polymerase chain reaction
| Genes | Unique ID | Forward primer sequence | Reverse primer sequence |
| CEACAM6 | PH_hs_0020590 | 5’-GGGGACTTCTGTATTATGCTAAC-3’ | 5’-GTGGTGCTAAATGCTACATACTC-3’ |
| ELF4 | PH_hs_0009109 | 5’-CAGATGGGGTCTGATACTGG-3’ | 5’-ACGTGTGTATTGCATCATCG-3’ |
| MEFV | PH_hs_0010414 | 5’-GGACATTGGAGACATCTTGC-3’ | 5’-CGCAGGGTTTCTGAGAAGTA-3’ |
| APAF1 | PH_hs_0024223 | 5’-AGAGACTGAGGCTGATGGTG-3’ | 5’-TTAAAGCCAGGCAGTGAATC-3’ |
| SLC1A6 | PH_hs_0032730 | 5’-CACCATGGTCATTGTGCTTA-3’ | 5’-GTGCCATGAGGGACTTGTAG-3’ |
| KCNJ11 | PH_hs_0032311 | 5’-AGGAGGACGGACGTTACTCT-3’ | 5’-GGAATCTGGAGAGATGCTGA-3’ |
RESULTS
Analysis of differentially regulated genes in UC
Identifying differential expression genes was achieved in 12 UC cases and 6 age- and sex-matched healthy controls by using RVM t test with a FDR of 0.5% and P < 0.01. Comparative analysis revealed that 4438 probes (4188 genes) were differentially expressed between the two groups, of which 3689 probes (3590 genes) were down-regulated whereas 749 probes (598 genes) were up-regulated. The data presented here confirm 10 (SERPINB2, IGHG3, FUT4, Meis1, ZNF145, NFKBIA, APBB2, IGHM, COPG2, PTGDS) of 71 reported genes identified by Burczynski et al[25] with similar design of our study. Excepting SERPINB2, we also observed the up-regulation of another fundamental inhibitor of the fibrinolytic process: SERPINE1 fold change (FC) 3.15, P = 3.8 × 10⁻⁶.
Some disregulated genes found in mucosal biopsies of UC also appeared in the present PBMC study, such as genes for up-regulating of S100 family proteins (S100A8, FC 2.24, P = 0.0016) and S100A9 (FC 3.24, P = 0.00041), as reported by Lawrance et al[7] and Noble et al[12], and carcinoembryonic antigen-related cell adhesion molecule 1 (CEACAM1, FC 4.59, P = 0.00027) observed by Costello et al[8] and Dooley et al[26]. In general, compared to four recently published papers that applied microarrays to explore gene expression profiles of endoscopic pinch mucosal biopsies with UC, our data confirmed 7 over-expressed (27%) and 14 down-regulated (22%) genes reported by Wu et al[11]. Another microarray study found differences in 143 genes, of which our data confirmed 27 (18.9%)[12]. Twenty-six up- and 9 down-regulated genes out of 272 differentially regulated genes reported by Costello et al[8] were seen in our data. Among the eight up-regulated genes reported by the only microarray study based on an Asian UC population carried out by Okahara et al[10], up-regulation of the TFF1 gene was the only consistent finding. Although there is little overlap between the individual genes identified compared to those microarray studies due to different microarray platforms, specimens, and race, all the studies point to the involvement of one major biological process: the immune and inflammatory response.
To analyze functional differences represented by differentially expressed genes, we conducted a GO analysis. A P < 0.01 in the Fisher’s exact tests was selected as the significant criteria. Using this threshold, a total of 67 high-enrichment GOs targeted by over-expressed genes and one term corresponding to under-expressed genes (nucleosome assembly) were identified. Over-expressed genes were mainly segregated to three critical biological processes: (1) immune and inflammatory response (immune response, inflammatory response, innate immune response, positive regulation of natural killer cell-mediated cytotoxicity); (2) cell cycle and proliferation [cell cycle, cell proliferation, natural killer (NK) cell proliferation, natural killer T (NKT) cell proliferation, cell differentiation, cell division, cell cycle arrest]; and (3) DNA metabolism and repair (response to DNA damage stimulus, DNA repair, DNA recombination). The GO terms and enrichment are shown in Figure 1.
Figure 1.
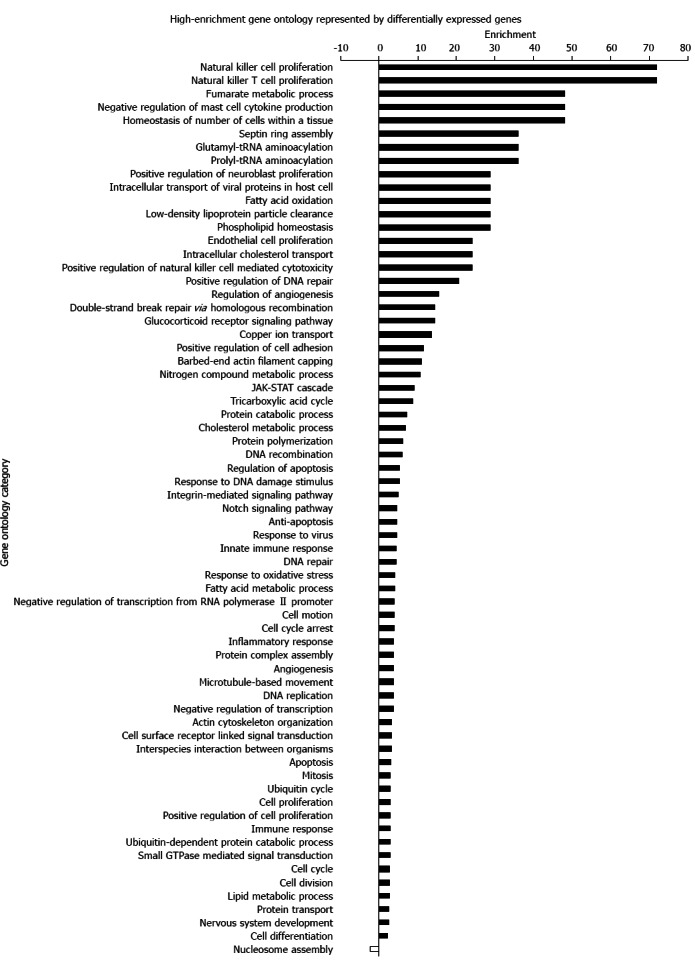
High-enrichment gene ontology represented by differentially expressed genes. A P < 0.01 in the Fisher’s exact test was selected as the significance criterion. Over-expressed genes were mainly segregated to three critical biological processes: immune and inflammatory response, cell cycle and proliferation, DNA metabolism and repair. JAK-STAT: Janus kinase-signal transducer and activator of transcription.
Validation of selected microarray results
To validate the microarray data results, we chose six genes to quantify by RT-PCR in 21 UC cases and 21 controls. In agreement with the microarray data, of the four up-regulated genes, three were found to be expressed to a significantly greater extent in UC by RT-PCR (CEACAM6: 0.0491 ± 0.0353 vs 0.955 ± 0.141, P < 0.01; ELF4: 0.458 ± 0.143 vs 0.185 ± 0.0703, P < 0.01; MEFV: 0.451 ± 0.245 vs 0.161 ± 0.0629, P < 0.01). Another up-regulated gene, APAF1, also showed the same tendency with microarray (0.253 ± 0.168 vs 0.104 ± 0.0308, P < 0.05). Of two down-regulated genes, SLC1A6 was found to be significantly lower in UC than in controls (0.144 ± 0.0749 vs 0.356 ± 0.127, P < 0.01), and KCNJ11 was not found to be significantly different between the two groups (0.227 ± 0.0549 vs 0.294 ± 0.0965, P > 0.05) (Figure 2).
Figure 2.
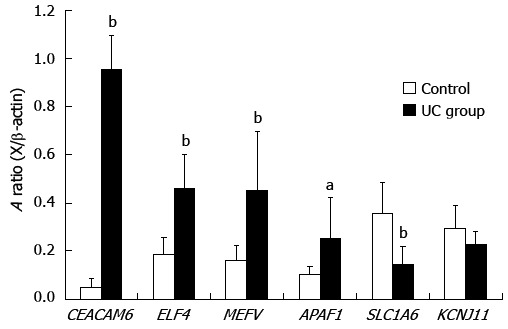
Semiquantitative relative reverse transcription-polymerase chain reaction validation of 6 selected genes. The values were normalized against β-actin. Graph bars indicate the averaged absorbance (A) ratios between each gene and β-actin. Values represent the mean ± SE. Significance levels were: aP < 0.05, bP < 0.01 vs control subjects. UC: Ulcerative colitis.
DISCUSSION
Clarifying the molecular mechanisms leading to UC remains a major challenge.
Definite diagnosis of UC mainly depends on colonoscopy and a following invasive biopsy due to deficiency of molecular markers for UC, and current first-line therapies generally target downstream of the inflammatory cascade. For these reasons, it is exigent to generate new biologic agents aimed at specific inflammatory processes and to explore disease specific molecular markers to facilitate diagnosis. To identify the molecules involved in activation behavior of PBMCs in UC, we compared the gene expression profiles of PBMCs between UC patients and healthy individuals using microarray technology. In addition, GO enrichment analysis, which was based on the significant disregulated genes, has been developed to reveal whether particular functions were enriched.
To the best of our knowledge, there is only one published study on PBMC gene expression profiles in UC. Comparison of that study with the present Phalanx array screening on 30968 genes, which represents the first gene expression analysis in an Asian population, shows consistency with data from Burczynski et al[25] who found that the most highly expressed gene commonly elevated in both IBDs was that for the protease inhibitor SERPINB2: we also observed the upregulation of SERPINB2 in UC patients. Another gene for fundamental inhibitor of the fibrinolytic process, SERPINE1 (also called PAI-1) showed upregulation in our data. Increased plasma levels of PAI-1 have been found in IBD patients[26], this suggests that these molecules might contribute to the imbalance of the coagulation system and thromboembolic events in UC. Another consistent finding was the up-regulated expression of two immunoglobulin encoding sequences, IgHG3 and IGHM. This correlates with the finding that elevated serum immunoglobulin G (IgG) levels are found in patients with UC, and is reminiscent of the finding that IgG antibodies to organ specific autoantigens such as colonic epithelial cells and antineutrophil cytoplasmic are identified in the colon of UC patients, and that these antibodies originate in the periphery.
A response to the peripheral antigens which have switched isotype to cross react with antigens of the flora or/and autoantigens which are normally segregated by the endothelial barrier[27] may result in mucosal inflammation. If this is the case, IgG-producing cells will expand through the antigen stimulation. This can explain the many up-regulated genes related to cell cycle and positive regulation of cell proliferation seen in our data.
It is of interest that many disregulated genes in our data have been reported by previous microarray studies carried out on intestinal mucosa samples, such as genes for S100 family proteins (S100A8 and S100A9) reported by Lawrance et al[7] and Noble et al[12]. In addition, another calcium binding protein, S100A12, has been demonstrated to be a novel noninvasive marker for IBD with high sensitivity and specificity[28]; this gene also showed upregulation in our data. Up-regulation of CEACAM1 has been reported by Costello et al[8] and Dooley et al[26]. The up-regulation of another CEACAM family gene in our data, CEACAM6, has not been reported by any microarray study but has been found acting as a receptor for certain bacteria[29].
Although there is little overlap between the individual genes identified compare to those other microarray studies due to different microarray platforms, specimens, and race, all the studies point to the involvement of one major biological process: immune and inflammatory response. GO enrichment analysis found several high-enrichment terms linked to immunity and inflammation, including immune response (33 genes), inflammatory response (17 genes), innate immune response (9 genes). The fact that the immune system and inflammatory mechanisms are activated in IBD is also well known[30]. It is not surprising that a general up-regulation of immune and inflammatory response genes is a feature of the intestine due to the nonsterile environment, but many up-regulated genes appear in PBMCs that had been ruled out by excluding patients with infections, malignancies, autoimmune disorders and so on that may impact the gene expression of PBMCs consistent with its role in the pathogenous of UC. Evidently, not all of those genes involved in immune and inflammatory categories are UC specific. Other inflammatory conditions such as arthritis, dermatitis and atherosclerosis share common immunologic/inflammatory mechanisms, although in different organ systems. Therefore, it is of importance to identify the profile of inflammatory genes that are differentially expressed in UC and compare it with those that characterize other inflammatory diseases. Although a crossover of some of these mechanisms is expected, it is highly plausible that differences between the diseases will also become apparent. Such differences have great potential as better diagnostic and prognostic biomarkers for these conditions.
NK cells and NKT cells are effector lymphocytes of the innate immune system and can limit or exacerbate immune responses[31]. Labeled peripheral blood granulocytes and monocytes have been shown to accumulate rapidly to the diseased intestine in IBD patients[15], leading to increased numbers of NKT cells accumulating in the lamina propria[32]. This movement is correlated with the disease activity[14]. NK cells and NKT cells can contribute to tissue damage not only by their direct cytotoxic effects on the targets, but also by secretion of inflammatory cytokines, and those cytokines can enhance their cytotoxicity and attract much more leukocyte aggregation to release more chemokines that perpetuate and amplify this vicious circle[33,34]. Considering cell cycling is essential to induce tolerance and generate effector T cells[35], a faster cycle will thus lead to an increased capacity for cellular expansion. It is tempting to speculate that up-regulated genes positively modulate proliferation of NK cells, NKT cells and cell cycling, playing a vital role in putting PMBCs as a source of effector immune cells in the inflamed intestine and magnifying the function of innate immunity and breaking the immune homeostasis. Therefore, it is a promising target to restrain the activation and proliferation of NK and NKT cells for treatment in active patients. However, the action of microflora and other factors which can activate these cells is complex and obscure. Accordingly, ELF4 and MEFV, which are overexpressed genes from the categories that regulate the proliferation of NK and NKT cells, might be a focus of interest.
Studies have suggested that ELF4 is a key transcriptional regulator of innate immune cells, affecting the number and function of NK cells and NKT development[36]. In a murine experiment[36], the number of NKT cells was significantly reduced in the ELF4-deficient thymus. Similarly, NK cell development and function is impaired, with a 60% reduction in the number of NK cells in ELF4 knock-out spleens and defects in their function. Another gene, MEFV, responsible for familial Mediterranean fever (FMF), also may contribute to the onset of IBD. One epidemiologic investigation of non-Askhenazi Jews indicated that FMF patients have a high incidence and severity of both Crohn’s disease (CD) and UC[37], indicating the potential modifying effect of MEFV expressed in certain inflammatory diseases. The expression of MEFV was found to be significantly higher in the colonic mucosa of colitis mice models (trinitrobenzenesulfonic acid and dextran sodium sulfate) and CD and severe UC patients[38]. Apart from MEFV and ELF4, upregulated genes involved in categories that relate to cell growth and proliferation, including positive regulation of cell proliferation, cell division, cell proliferation, also deserve further exploration.
Chromosome instability and microsatellite instability (MSI) have been proven to be associated with UC[39], and further contribute to the carcinogenesis of UC-associated neoplasms[40]. Increased production of free radicals may impair cellular and DNA proteins and decrease the ability of the cell to repair DNA damage prior to replication. We have identified increased expression of transcripts involved in DNA repair in PBMCs (response to DNA damage stimulus, DNA repair, DNA recombination, double-strand break repair via homologous recombination, DNA replication, and positive regulation of DNA repair). Those categories positively regulating DNA repair seem to act as a defense role against carcinogenesis in UC, but opposite to this conjecture, a recent study observed that increased activity of base excision repair enzymes can contribute to increasing of MSI in inflamed UC mucosa[41]. Another study identified increased transcription involved in DNA repair in UC-associated colorectal cancer biopsies compared to UC mucosa[42]. In other words, increased expression of those categories involved in DNA repair may be injurious to the stability of the genome and may even increase neoplastic risk. Watanabe et al[43] have identified 40 genes which are involved in categories such as in cell cycle, cell proliferation, and receptor activity to predict the development of cancer and/or dysplasia in UC with sensitivity and specificity of 100% and 83.7%, respectively. The disregulated genes involved in categories of cell cycle and DNA repair identified in our study deserve in-depth studies to investigate the possibility of non-invasive markers for predicting the development risk of cancer in UC patients.
In conclusion, this study identified genome-wide gene expression profiles of PBMCs in UC, and GO analysis highlighted the significance of several categories related to the immune and inflammatory response, cell cycle and proliferation and DNA repair. The gene enrichment analysis provides greater understanding of the processes that may be involved in UC.
COMMENTS
Background
Evidence indicates that peripheral blood immune cells play a vital role in the pathogeny of ulcerative colitis (UC). Microarray transcript profiling has the promise to clarify the molecular processes involved in the etiopathogenesis of UC.
Research frontiers
Microarrays represent important tools to identify biomarkers of disease; biomarkers can be constituted by gene expression patterns or clusters of genes. Systems biology tools can find some useful information hidden behind the lists of differentially expressed genes at significant levels.
Innovations and breakthroughs
In contrast to most studies utilizing intestinal tissue, the authors adopted more accessible specimens and carried out the research in Chinese UC patients for the first time.
Applications
This study further elucidated the biological process that may lead to the pathogenesis of UC.
Terminology
The gene ontology project is a major bioinformatics initiative to unify the representation of gene and gene product attributes across all species.
Peer review
The authors found some disregulated genes in peripheral blood mononuclear cells of UC and further demonstrated biological processes represented by those differentially expressed genes. This is a very important study which could unravel the mechanisms of UC. The scientific content of the manuscript is original and novel.
Footnotes
Supported by Grants from National Natural Science Foundation of China, No. 81260074/H0310 and 81160055/H0310; Confederative Special Foundation of Science and Technology, Department of Yunnan Province and Kunming Medical College, No. 2011FB183 and 2007C0010R; and Medical Academic Leader of Yunnan Provincial Bureau of Health, No. D-201215
P- Reviewer Tran CD S- Editor Gou SX L- Editor Logan S E- Editor Li JY
References
- 1.Braus NA, Elliott DE. Advances in the pathogenesis and treatment of IBD. Clin Immunol. 2009;132:1–9. doi: 10.1016/j.clim.2009.02.006. [DOI] [PMC free article] [PubMed] [Google Scholar]
- 2.Thia KT, Loftus EV, Sandborn WJ, Yang SK. An update on the epidemiology of inflammatory bowel disease in Asia. Am J Gastroenterol. 2008;103:3167–3182. doi: 10.1111/j.1572-0241.2008.02158.x. [DOI] [PubMed] [Google Scholar]
- 3.Ouyang Q, Tandon R, Goh KL, Ooi CJ, Ogata H, Fiocchi C. The emergence of inflammatory bowel disease in the Asian Pacific region. Curr Opin Gastroenterol. 2005;21:408–413. [PubMed] [Google Scholar]
- 4.Ouyang Q. Standardized diagnosis and treatment for inflammatory bowel disease. Zhonghua Neike Zazhi. 2008;47:1–2. [PubMed] [Google Scholar]
- 5.Dieckgraefe BK, Stenson WF, Korzenik JR, Swanson PE, Harrington CA. Analysis of mucosal gene expression in inflammatory bowel disease by parallel oligonucleotide arrays. Physiol Genomics. 2000;4:1–11. doi: 10.1152/physiolgenomics.2000.4.1.1. [DOI] [PubMed] [Google Scholar]
- 6.Heller RA, Schena M, Chai A, Shalon D, Bedilion T, Gilmore J, Woolley DE, Davis RW. Discovery and analysis of inflammatory disease-related genes using cDNA microarrays. Proc Natl Acad Sci USA. 1997;94:2150–2155. doi: 10.1073/pnas.94.6.2150. [DOI] [PMC free article] [PubMed] [Google Scholar]
- 7.Lawrance IC, Fiocchi C, Chakravarti S. Ulcerative colitis and Crohn’s disease: distinctive gene expression profiles and novel susceptibility candidate genes. Hum Mol Genet. 2001;10:445–456. doi: 10.1093/hmg/10.5.445. [DOI] [PubMed] [Google Scholar]
- 8.Costello CM, Mah N, Häsler R, Rosenstiel P, Waetzig GH, Hahn A, Lu T, Gurbuz Y, Nikolaus S, Albrecht M, et al. Dissection of the inflammatory bowel disease transcriptome using genome-wide cDNA microarrays. PLoS Med. 2005;2:e199. doi: 10.1371/journal.pmed.0020199. [DOI] [PMC free article] [PubMed] [Google Scholar]
- 9.Langmann T, Moehle C, Mauerer R, Scharl M, Liebisch G, Zahn A, Stremmel W, Schmitz G. Loss of detoxification in inflammatory bowel disease: dysregulation of pregnane X receptor target genes. Gastroenterology. 2004;127:26–40. doi: 10.1053/j.gastro.2004.04.019. [DOI] [PubMed] [Google Scholar]
- 10.Okahara S, Arimura Y, Yabana T, Kobayashi K, Gotoh A, Motoya S, Imamura A, Endo T, Imai K. Inflammatory gene signature in ulcerative colitis with cDNA macroarray analysis. Aliment Pharmacol Ther. 2005;21:1091–1097. doi: 10.1111/j.1365-2036.2005.02443.x. [DOI] [PubMed] [Google Scholar]
- 11.Wu F, Dassopoulos T, Cope L, Maitra A, Brant SR, Harris ML, Bayless TM, Parmigiani G, Chakravarti S. Genome-wide gene expression differences in Crohn’s disease and ulcerative colitis from endoscopic pinch biopsies: insights into distinctive pathogenesis. Inflamm Bowel Dis. 2007;13:807–821. doi: 10.1002/ibd.20110. [DOI] [PubMed] [Google Scholar]
- 12.Noble CL, Abbas AR, Cornelius J, Lees CW, Ho GT, Toy K, Modrusan Z, Pal N, Zhong F, Chalasani S, et al. Regional variation in gene expression in the healthy colon is dysregulated in ulcerative colitis. Gut. 2008;57:1398–1405. doi: 10.1136/gut.2008.148395. [DOI] [PubMed] [Google Scholar]
- 13.Olsen J, Gerds TA, Seidelin JB, Csillag C, Bjerrum JT, Troelsen JT, Nielsen OH. Diagnosis of ulcerative colitis before onset of inflammation by multivariate modeling of genome-wide gene expression data. Inflamm Bowel Dis. 2009;15:1032–1038. doi: 10.1002/ibd.20879. [DOI] [PubMed] [Google Scholar]
- 14.Alkim C, Balci M, Alkim H, Dağli U, Parlak E, Tezel A, Ulker A. The importance of peripheral immune cells in inflammatory bowel disease. Turk J Gastroenterol. 2007;18:82–88. [PubMed] [Google Scholar]
- 15.Saverymuttu SH, Camilleri M, Rees H, Lavender JP, Hodgson HJ, Chadwick VS. Indium 111-granulocyte scanning in the assessment of disease extent and disease activity in inflammatory bowel disease. A comparison with colonoscopy, histology, and fecal indium 111-granulocyte excretion. Gastroenterology. 1986;90:1121–1128. doi: 10.1016/0016-5085(86)90376-8. [DOI] [PubMed] [Google Scholar]
- 16.Stevens C, Walz G, Singaram C, Lipman ML, Zanker B, Muggia A, Antonioli D, Peppercorn MA, Strom TB. Tumor necrosis factor-alpha, interleukin-1 beta, and interleukin-6 expression in inflammatory bowel disease. Dig Dis Sci. 1992;37:818–826. doi: 10.1007/BF01300378. [DOI] [PubMed] [Google Scholar]
- 17.Perlmann P, Broberger O. In vitro studies of ulcerative colitis. II. Cytotoxic action of white blood cells from patients on human fetal colon cells. J Exp Med. 1963;117:717–733. doi: 10.1084/jem.117.5.717. [DOI] [PMC free article] [PubMed] [Google Scholar]
- 18.Yamaji K, Yang K, Tsuda H, Hashimoto H. Fluctuations in the peripheral blood leukocyte and platelet counts in leukocytapheresis in healthy volunteers. Ther Apher. 2002;6:402–412. doi: 10.1046/j.1526-0968.2002.00459.x. [DOI] [PubMed] [Google Scholar]
- 19.Sawada K, Muto T, Shimoyama T, Satomi M, Sawada T, Nagawa H, Hiwatashi N, Asakura H, Hibi T. Multicenter randomized controlled trial for the treatment of ulcerative colitis with a leukocytapheresis column. Curr Pharm Des. 2003;9:307–321. doi: 10.2174/1381612033391928. [DOI] [PubMed] [Google Scholar]
- 20.Kornbluth A, Sachar DB. Ulcerative colitis practice guidelines in adults (update): American College of Gastroenterology, Practice Parameters Committee. Am J Gastroenterol. 2004;99:1371–1385. doi: 10.1111/j.1572-0241.2004.40036.x. [DOI] [PubMed] [Google Scholar]
- 21.Gene Ontology Consortium. The Gene Ontology (GO) project in 2006. Nucleic Acids Res. 2006;34:D322–D326. doi: 10.1093/nar/gkj021. [DOI] [PMC free article] [PubMed] [Google Scholar]
- 22.Dupuy D, Bertin N, Hidalgo CA, Venkatesan K, Tu D, Lee D, Rosenberg J, Svrzikapa N, Blanc A, Carnec A, et al. Genome-scale analysis of in vivo spatiotemporal promoter activity in Caenorhabditis elegans. Nat Biotechnol. 2007;25:663–668. doi: 10.1038/nbt1305. [DOI] [PubMed] [Google Scholar]
- 23.Schlitt T, Palin K, Rung J, Dietmann S, Lappe M, Ukkonen E, Brazma A. From gene networks to gene function. Genome Res. 2003;13:2568–2576. doi: 10.1101/gr.1111403. [DOI] [PMC free article] [PubMed] [Google Scholar]
- 24.Rozen S, Skaletsky H. Primer3 on the WWW for general users and for biologist programmers. Methods Mol Biol. 2000;132:365–386. doi: 10.1385/1-59259-192-2:365. [DOI] [PubMed] [Google Scholar]
- 25.Burczynski ME, Peterson RL, Twine NC, Zuberek KA, Brodeur BJ, Casciotti L, Maganti V, Reddy PS, Strahs A, Immermann F, et al. Molecular classification of Crohn’s disease and ulcerative colitis patients using transcriptional profiles in peripheral blood mononuclear cells. J Mol Diagn. 2006;8:51–61. doi: 10.2353/jmoldx.2006.050079. [DOI] [PMC free article] [PubMed] [Google Scholar]
- 26.Dooley TP, Curto EV, Reddy SP, Davis RL, Lambert GW, Wilborn TW, Elson CO. Regulation of gene expression in inflammatory bowel disease and correlation with IBD drugs: screening by DNA microarrays. Inflamm Bowel Dis. 2004;10:1–14. doi: 10.1097/00054725-200401000-00001. [DOI] [PubMed] [Google Scholar]
- 27.Butcher EC. Leukocyte-endothelial cell recognition: three (or more) steps to specificity and diversity. Cell. 1991;67:1033–1036. doi: 10.1016/0092-8674(91)90279-8. [DOI] [PubMed] [Google Scholar]
- 28.Sidler MA, Leach ST, Day AS. Fecal S100A12 and fecal calprotectin as noninvasive markers for inflammatory bowel disease in children. Inflamm Bowel Dis. 2008;14:359–366. doi: 10.1002/ibd.20336. [DOI] [PubMed] [Google Scholar]
- 29.Barnich N, Carvalho FA, Glasser AL, Darcha C, Jantscheff P, Allez M, Peeters H, Bommelaer G, Desreumaux P, Colombel JF, et al. CEACAM6 acts as a receptor for adherent-invasive E. coli, supporting ileal mucosa colonization in Crohn disease. J Clin Invest. 2007;117:1566–1574. doi: 10.1172/JCI30504. [DOI] [PMC free article] [PubMed] [Google Scholar]
- 30.Doganci A, Neurath MF, Finotto S. Mucosal immunoregulation: transcription factors as possible therapeutic targets. Curr Drug Targets Inflamm Allergy. 2005;4:565–575. doi: 10.2174/156801005774322153. [DOI] [PubMed] [Google Scholar]
- 31.Vivier E, Tomasello E, Baratin M, Walzer T, Ugolini S. Functions of natural killer cells. Nat Immunol. 2008;9:503–510. doi: 10.1038/ni1582. [DOI] [PubMed] [Google Scholar]
- 32.Fuss IJ, Heller F, Boirivant M, Leon F, Yoshida M, Fichtner-Feigl S, Yang Z, Exley M, Kitani A, Blumberg RS, et al. Nonclassical CD1d-restricted NK T cells that produce IL-13 characterize an atypical Th2 response in ulcerative colitis. J Clin Invest. 2004;113:1490–1497. doi: 10.1172/JCI19836. [DOI] [PMC free article] [PubMed] [Google Scholar]
- 33.Baumgart DC, Carding SR. Inflammatory bowel disease: cause and immunobiology. Lancet. 2007;369:1627–1640. doi: 10.1016/S0140-6736(07)60750-8. [DOI] [PubMed] [Google Scholar]
- 34.Fuss IJ, Strober W. The role of IL-13 and NK T cells in experimental and human ulcerative colitis. Mucosal Immunol. 2008;1 Suppl 1:S31–S33. doi: 10.1038/mi.2008.40. [DOI] [PMC free article] [PubMed] [Google Scholar]
- 35.Wells AD, Walsh MC, Sankaran D, Turka LA. T cell effector function and anergy avoidance are quantitatively linked to cell division. J Immunol. 2000;165:2432–2443. doi: 10.4049/jimmunol.165.5.2432. [DOI] [PubMed] [Google Scholar]
- 36.Hedvat CV, Yao J, Sokolic RA, Nimer SD. Myeloid ELF1-like factor is a potent activator of interleukin-8 expression in hematopoietic cells. J Biol Chem. 2004;279:6395–6400. doi: 10.1074/jbc.M307524200. [DOI] [PubMed] [Google Scholar]
- 37.Cattan D, Notarnicola C, Molinari N, Touitou I. Inflammatory bowel disease in non-Ashkenazi Jews with familial Mediterranean fever. Lancet. 2000;355:378–379. doi: 10.1016/S0140-6736(99)02134-0. [DOI] [PubMed] [Google Scholar]
- 38.Villani AC, Lemire M, Louis E, Silverberg MS, Collette C, Fortin G, Nimmo ER, Renaud Y, Brunet S, Libioulle C, et al. Genetic variation in the familial Mediterranean fever gene (MEFV) and risk for Crohn’s disease and ulcerative colitis. PLoS One. 2009;4:e7154. doi: 10.1371/journal.pone.0007154. [DOI] [PMC free article] [PubMed] [Google Scholar]
- 39.Guo HH, Loeb LA. Tumbling down a different pathway to genetic instability. J Clin Invest. 2003;112:1793–1795. doi: 10.1172/JCI20502. [DOI] [PMC free article] [PubMed] [Google Scholar]
- 40.Tahara T, Inoue N, Hisamatsu T, Kashiwagi K, Takaishi H, Kanai T, Watanabe M, Ishii H, Hibi T. Clinical significance of microsatellite instability in the inflamed mucosa for the prediction of colonic neoplasms in patients with ulcerative colitis. J Gastroenterol Hepatol. 2005;20:710–715. doi: 10.1111/j.1440-1746.2005.03803.x. [DOI] [PubMed] [Google Scholar]
- 41.Hofseth LJ, Khan MA, Ambrose M, Nikolayeva O, Xu-Welliver M, Kartalou M, Hussain SP, Roth RB, Zhou X, Mechanic LE, et al. The adaptive imbalance in base excision-repair enzymes generates microsatellite instability in chronic inflammation. J Clin Invest. 2003;112:1887–1894. doi: 10.1172/JCI19757. [DOI] [PMC free article] [PubMed] [Google Scholar]
- 42.Colliver DW, Crawford NP, Eichenberger MR, Zacharius W, Petras RE, Stromberg AJ, Galandiuk S. Molecular profiling of ulcerative colitis-associated neoplastic progression. Exp Mol Pathol. 2006;80:1–10. doi: 10.1016/j.yexmp.2005.09.008. [DOI] [PubMed] [Google Scholar]
- 43.Watanabe T, Kobunai T, Toda E, Kanazawa T, Kazama Y, Tanaka J, Tanaka T, Yamamoto Y, Hata K, Kojima T, et al. Gene expression signature and the prediction of ulcerative colitis-associated colorectal cancer by DNA microarray. Clin Cancer Res. 2007;13:415–420. doi: 10.1158/1078-0432.CCR-06-0753. [DOI] [PubMed] [Google Scholar]