

Abstract
Extensive efforts have recently been devoted to developing noninvasive imaging tools capable of delineating brain tissue viability (penumbra) during acute ischemic stroke. These efforts could have profound clinical implications for identifying patients who may benefit from tPA beyond the currently approved therapeutic time window and/or patients undergoing neuroendovascular treatments. To date, the DWI/PWI MRI and perfusion CT have received the most attention for identifying ischemic penumbra. However, their routine use in clinical settings remains limited. Preclinical and clinical PET studies with [18F]-fluoro-2-deoxy-D-glucose (18F-FDG) have consistently revealed a decreased 18F-FDG uptake in regions of presumed ischemic core. More importantly, an elevated 18F-FDG uptake in the peri-ischemic regions has been reported, potentially reflecting viable tissues. To this end, this paper provides a comprehensive review of the literature on the utilization of 14C-2-DG and 18F-FDG-PET in experimental as well as human stroke studies. Possible cellular mechanisms and physiological underpinnings attributed to the reported temporal and spatial uptake patterns of 18F-FDG are addressed. Given the wide availability of 18F-FDG in routine clinical settings, 18F-FDG PET may serve as an alternative, non-invasive tool to MRI and CT for the management of acute stroke patients.
1. Introduction
In the Western society, stroke is the fourth leading cause of death and a major cause of permanent disability [1, 2]. Ischemic stroke is the most common type of stroke, comprising approximately 87% of all strokes [1]. The main goal of current acute stroke management is to prevent at-risk tissue from infarction by restoring blood flow to ischemic penumbral areas. Intravenous (IV) thrombolysis with recombinant tissue plasminogen activator (tPA) has been well documented offering improved outcomes in ischemic stroke patients who received tPA within 4.5 hours after symptom onset [3–7]. However, this narrow therapeutic time window has substantially limited the amount of all stroke patients receiving tPA. As a result, extensive efforts have been devoted to identifying a subgroup of stroke patients who may benefit from tPA beyond the currently approved therapeutic window and/or to developing more effective therapeutic interventions. Specifically, noninvasive neuroimaging methods have been widely implicated offering insights into the presence or absence of salvageable tissues (penumbra), which could be used, potentially, to extend the tPA therapeutic window beyond 4.5 hours. In contrast, the advent of intra-arterial thrombolysis and the introduction of endovascular clot retrieval devices (e.g., MERCI, Penumbra, and Solitaire) have shown great potential in improving the efficacy of vascular recanalization, which in turn may further extend the therapeutic window [8, 9]. While promising results in extending the tPA time window and utilizing new endovascular clot retrieval devices have been reported, both methods carry additional risks of mortality, morbidity, and serious complications, underscoring the critical role of careful patient selection [10].
In a clinical setting, the accurate determination of stroke onset (time since last seen normal), competent neurological examination, and noncontrast computed tomography (CT) scans to rule out intracerebral hemorrhage are vital for selecting ischemic stroke patients who may benefit from reperfusion therapies [3]. Despite significant advancements in neuroimaging, only non-contrast CT has a proven value for the management of acute stroke patients [3, 11]. Nevertheless, the search for imaging tools capable of providing insights into tissue viability continues to gain interest, which in turn may improve patient selection for reperfusion treatments beyond the currently approved therapeutic window for tPA. The presence of neuroimaging-based evidence of salvageable brain tissue beyond the currently recommended rt-PA therapeutic window further emphasizes the need for identifying such tools [12–15]. Consequently, it was suggested that the currently employed “time-to-treat” approach may not be ideal and should be replaced by “tissue-to-treat” [16]. Clearly, one of the prerequisites for the utilization of the “tissue-to-treat” approach is the availability of accurate neuroimaging-based surrogate markers capable of discerning tissue viability. Such imaging-based biomarkers may distinguish stroke patients who could potentially benefit from tPA beyond 4.5 hour, and/or from neuroendovascular treatments. The optimal imaging modality should be rapid, accurate, and readily available in a busy clinical setting and accompanied by automatic data analysis techniques [16].
In recent years, diffusion-weighted imaging/perfusion-weighted imaging (DWI/PWI) magnetic resonance imaging (MRI) [12, 15] and perfusion CT [17] have received considerable attention and have been suggested as imaging signatures for identifying the presence or absence of salvageable tissues. Specifically, the notion of diffusion/perfusion mismatch (DPM) has gained substantial interest as an effective tool to reveal the presence of ischemic penumbra [11, 12, 15, 18]. The underlying concept of DPM is that the abnormal diffusion areas represent the ischemic core, which will progress to infarction independent of treatments. In contrast, regions with abnormal perfusion represent tissues at risk of infarction if blood flow is not restored in a timely manner. As a result, brain regions with abnormal perfusion that reside outside of the abnormal diffusion areas, known as DPM, may be indicative of viable tissues, but they are at an increased risk of irreversible injury in the absence of timely reperfusion [19, 20]. Conversely, the absence of DPM would suggest no salvageable tissues. Figure 1 shows acute diffusion/perfusion images as well as the final lesions from two representative patients. The upper row shows a patient with matched diffusion/perfusion deficits (imaged at 4.30 hours after onset and no tPA), suggesting the absence of salvageable tissues. Indeed, the acute diffusion/perfusion deficits spatially match with the final lesion. Acute DPM is observed in the patient shown in the bottom row (imaged at 1.19 hours with tPA), suggesting the presence of ischemic penumbra. Consistent with the DPM hypothesis, the mismatched region was not recruited into final infarction, demonstrating the potential clinical utility of DPM in an acute ischemic stroke. However, despite these promising results [12, 15], unacceptable reliability due to acute reversal of DWI lesions and the failure of all lesions to evolve to the final infarct have substantially limited clinical acceptance of DPM [16, 21, 22]. In addition, there is a lack of consensus on the choices of DWI and PWI thresholds delineating diffusion and perfusion abnormalities [23]. Therefore, a well-controlled clinical trial is needed to rigorously determine the clinical values of DPM prior to its routine clinical applications [24]. Although perfusion CT has been employed to identify patients for reperfusion therapies, it is limited by the need for an IV contrast injection, an additional radiation dose, and has less reliable threshold values when compared to DWI/PWI MRI [23, 25, 26].
Figure 1.
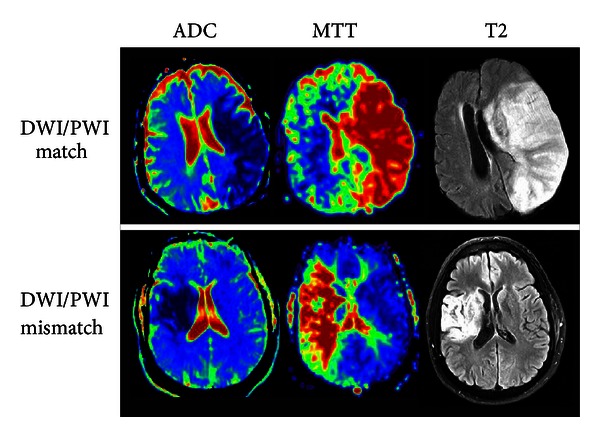
ADC and MTT maps demonstrating DWI/PWI match and mismatch in relation to the MRI T2 lesion.
In addition to MR and CT, PET has also been employed in an attempt to provide insights into brain tissue viability. This is perhaps not surprising, given its ability to provide in vivo measures of oxygen and glucose metabolism, the two main energy substrates of the brain. With 15O-labeled tracers, quantitative measurements of cerebral hemodynamics (cerebral blood flow (CBF) and cerebral blood volume (CBV)) and oxygen metabolism (oxygen extraction fraction (OEF) and cerebral metabolic rate of oxygen utilization (CMRO2)) can be obtained using PET. In particular, a number of seminal PET studies have demonstrated the existence of critical CBF thresholds and duration (Figure 2) below which functional and metabolic processes are disturbed and eventually cease [14, 18, 19, 27–30]. However, CBF alone cannot faithfully predict tissue fate; the duration to which neurons are under compromised perfusion is equally critical for final neuronal fate as shown in Figure 2 [27, 30, 31]. Furthermore, functional CBF threshold values have been shown to vary across neuron populations [30]. Regarding OEF, clinical and preclinical studies have demonstrated that areas with compromised CBF but increased OEF may be indicative of ischemic penumbra [32–35]. However, the final tissue fate of high OEF regions has been variable, suggesting that OEF is not a reliable marker of penumbral tissue [33, 35–37]. Finally, CMRO2 has been suggested as a highly promising parameter in predicting tissue fate in both experimental [38, 39] and human [32, 36] stroke studies. Specifically, it has been shown that brain regions with reduced CBF, but preserved CMRO2, are associated with neuronal survival, whereas brain regions with reduced CBF and CMRO2 likely reflect irreversible tissue damage [29, 32, 36, 38–40]. Collectively, while PET with 15O-labeled tracers provides essential physiological information that could predict tissue final fate during acute cerebral ischemia, the requirement of an in-house cyclotron to produce ultra-short half-life 15O-labeled tracers (~2 min) significantly hampers its clinical utility.
Figure 2.
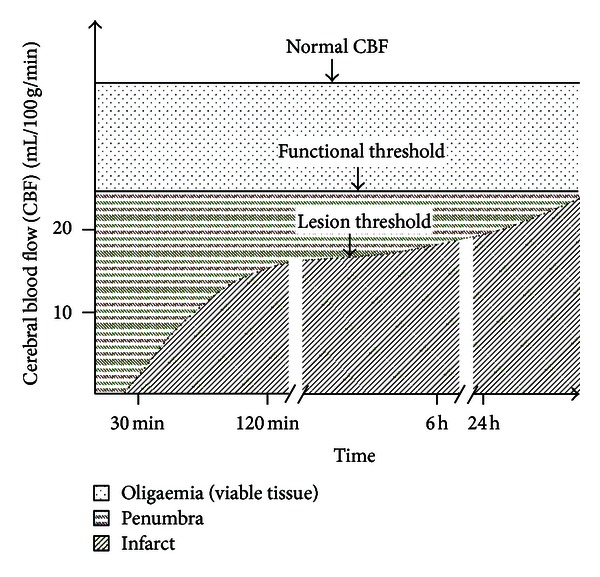
The association of cerebral blood flow thresholds and duration of ischemia with functional and structural tissue fates (adapted from [111, 112]).
Alternatively, fluorine-18 (or 18F) has a half-life of 110 min, and [18F]-fluoro-2-deoxy-D-glucose (18F-FDG) has been utilized extensively to reveal in vivo glucose utilization in different clinical settings, most notably in oncology and cardiology. In myocardial infarction patients, PET with 18F-FDG has been routinely applied to discern viable myocardium (hypoperfused or stunned myocardium with preserved glucose metabolism), before considering coronary artery bypass graft surgery [41–43]. Along those lines, it is highly plausible that 18F-FDG may also offer valuable insights into cerebral glucose metabolism during cerebral ischemia, which consequently discerns tissue viability. In fact, there has been tremendous interest in evaluating the potential of 18F-FDG in cerebral ischemia. The recent innovation of the hybrid PET/MR scanners [44] may further renew interest on the potential clinical utility of PET with 18F-FDG in the management of acute stroke patients. To this end, this review paper will first provide an overview of glucose metabolism, followed by a comprehensive review of both animal and human studies utilizing 18F-FDG in ischemic stroke. Special attention is given to discussing temporal and spatial 18F-FDG uptake patterns during cerebral ischemia. Finally, the possible underlying biological mechanisms associated with the reported temporal and spatial 18F-FDG uptake patterns will be discussed.
2. Cerebral Glucose Metabolism
Maintaining normal brain homeostasis is an energy-consuming process that depends on a continuous supply of oxygen and glucose, since the brain cannot store energy substrates. Despite its relatively low weight (about 2% of the body weight), the brain receives 15% of the total cardiac output, 20% of the total oxygen consumption, and 25% of the total glucose utilization. The majority of energy in the brain (87%) is consumed for signaling; only about 13% of its total energy consumption is deferred for maintaining resting membrane potential [14].
Normally, glucose is the primary metabolic substrate of brain cells. However, under certain conditions, brain cells can utilize other substrates, such as lactate, pyruvate, glutamate, and glutamine, which are endogenously synthesized and require glucose as their source of carbon. Under normal conditions, the glucose extraction fraction is approximately 10% [45, 46]. To enter brain cells, blood glucose is transported across the blood-brain barrier (BBB) and then across the plasma membranes of neurons and glial cells. This energy consuming process is mediated by glucose transporter (GLUT) proteins (Figure 3). Three major isoforms of GLUTs are considered important for glucose delivery to brain cells: GLUT1 is the primary glucose transporter in the blood-brain barrier, choroid plexus, ependyma, and glial cells and is not sensitive to insulin; GLUT3 is the predominant glucose transporter in neurons; GLUT5 is highly expressed in microglia [47]. Other types of GLUTs (2, 4, and 7) are expressed in lesser amounts and in more discrete brain regions [47]. When in cells, glucose is phosphorylated to glucose-6-phosphate (glucose-6P) by an enzyme, hexokinase. Once phosphorylated, glucose-6P is unable to exit the cell via the GLUTs and is trapped. Hence, phosphorylation of glucose is critical for the maintenance of the glucose concentration gradient across membranes ensuring a constant flow of glucose into cells via GLUTs [48]. Phosphorylation is also the rate-limiting step of glycolysis. Subsequently, glucose-6P can be processed into three metabolic pathways: (1) glycolysis; (2) glycogenesis; (3) pentose phosphate pathway. Glycolysis gives rise to two molecules of pyruvate, ATP and NADH. Pyruvate can then enter mitochondria and undergo the tricarboxylic acid (TCA) cycle and oxidative phosphorylation to produce 30 to 34 ATP molecules, CO2, and water. Oxygen is critical for the TCA cycle and oxidative phosphorylation. In healthy brains, OEF ranges from 30% to 40%, and CMRO2 averages from 3.0 to 3.8 ml/100 g tissue/min [27, 45, 46]. Finally, minute quantities of glucose-6P can be processed via the pentose phosphate pathway producing NADPH (a reducing equivalent), and glucose-6P can also undergo glycogenesis in astrocytes.
Figure 3.
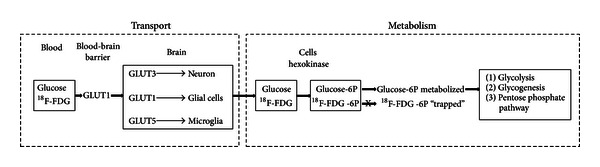
Transport and metabolism of glucose and 18F-FDG.
3. Evaluation of Glucose Metabolism in Ischemic Stroke
This section will provide a comprehensive overview of representative studies where glucose metabolism was employed for the study of ischemic strokes. A summary of these representative studies using 18F-FDG is provided in Table 1.
Table 1.
Published studies in experimental and human stroke studies evaluating 18F-FDG uptake.
| Study | Stroke model/number of patients | Procedures | Poststroke timing | Relevant findings |
|---|---|---|---|---|
| Animals | ||||
|
| ||||
| Walberer et al., 2012 [54] | Embolic MCAO in rats |
18F-FDG PET MRI and histological examination (final infarct volume) 15O-H2O PET (CBF) |
75 minutes 24 hours Before, and at 5, 30, and 60 minutes |
(i) At 60 minutes, rCBF correlated positively with K1 (FDG transport from blood to brain). (ii) Infarcted tissue at 24 hours could be predicted by Ki (net influx rate constant) at 75 min. (iii) Parts of hypoperfused tissue that was infarcted at 24 hours had normal or elevated Ki at 1 hour. |
|
| ||||
| Sobrado et al., 2011 [55] | Transient and permanent MCAO in rats |
18F-FDG PET MRI (T2WI, DWI and PWI) Nissl staining |
Before and at 3, 24, and 48 hours 3 hours |
(i) 18F-FDG uptake in ischemic core regions was reduced for all time points after MCAO. (ii) At 3 hours after MCAO, areas that recovered with reperfusion at 24 hours had greater 18F-FDG uptake when compared to brain areas that progressed to infarction at 24 hours. |
|
| ||||
| Kuge et al., 2000 [57] | Thromboembolic MCAO in primates |
18F-FDG PET 12O-H2O PET (CBF) 2,3,5-triphenyltetrazolium chloride (TTC) staining |
24 hours Before and 1, 2, 4, 6, and 24 hours 24 hours |
(i) Ischemic core: reduced CBF, CMRglc, and negative TCC. (ii) Ischemic penumbra: moderate decrease of CBF, increase of CMRglc, and positive TCC staining. |
|
| ||||
| Fukumoto et al., 2011 [58] | Thrombotic MCAO in rats |
18F-FDG PET 11C-PK11195 PET (neuroinflammation) 11C-FMZ PET (neuronal integrity) 11C-PK11195; 11C-FMZ and 18F-FDG autoradiography Iba1 (microglia activation) and NeuN (neuronal damage) immunohistochemistry |
Before and days 1, 3, 7, and 14 7 days |
(i) Peri-infarct areas: significantly increased PET uptake of 18F-FDG at days 7 and 14 and of 11C-PK11195 at days 3, 7, and 14, plus Iba1 staining at day 7. (ii) Infarct core: reduced uptake of 18F-FDG at days 1–14, increased 11C-(R)PK11195 bindings at days 7 and 14 and reduced 11C-FMZ binding at days 7 and 14. |
|
| ||||
| Humans | ||||
|
| ||||
| Heiss et al., 1992 [40] | 16 hemispheric stroke patients | 18F-FDG, H2 15O, 15O2, and C15O PET | 6–48 hours 13–25 days |
(i) Core: severely reduced OEF, CMRO2, CBF, and CMRglc. (ii) Penumbra: reduced CMRO2, CMRglc, and CBF. (iii) Some penumbral areas had increased CMRO2, OEF, CMRglc and GEF and did not progress to final infarct. (iv) When compared to the first scan: Core—increased CBF; penumbra: reduced CMRO2, CMRglc, and OEF. |
|
| ||||
| Nasu et al., 2002 [60] | 24 ischemic stroke patients | 18F-FDG PET, MRI, and CT | 1–7 days Later time points |
(i) In the acute phase 18F-FDG hyperaccumulation foci around hypoaccumulation areas were evident in 7 out of 20 patients. (ii) Final tissue fate of hyper-accumulation areas was variable. |
3.1. 2-Deoxy-D-Glucose (2-DG) Autoradiography in Ischemic Stroke
Early studies employed 2-DG as a surrogate marker of glucose metabolism. The 2-DG is a glucose analog with the 2-hydroxyl group replaced by hydrogen. Like glucose, the 2-DG is taken up by cells via GLUTs and phosphorylated by hexokinase. The 2-DG-6-phosphate cannot be further metabolized and is trapped in cells. The 2-DG is commonly marked with carbon-14 (14C) and is used in animal models to assess 2-DG distribution by means of autoradiography. Using 14C-2-DG, Ginsberg and colleagues demonstrated regions with decreased 14C-2-DG uptake in the presumed ischemic core. More importantly, their results showed a concurrent increase of 14C-2-DG uptake around the border of the ischemic core 60 minutes after a middle cerebral artery occlusion (MCAO) [49]. This unexpected finding could be of critical importance, particularly if the hyper 14C-2-DG uptake regions represent probable ischemic penumbrae. Paschen et al. further investigated the relationship between blood flow, glucose metabolism, and energy status in a permanent gerbil MCAO model [50]. They found that normal CMRglc was maintained at rCBF > 40 ml/100 g/min but markedly increased at rCBF from 35 to 20 ml/100 g/min, sharply reduced, and eventually ceased at rCBF < 20 ml/100 g/min (Figure 4). Importantly, tissue ATP content was normal until rCBF fell below 20 ml/100 g/min. Comparing the relation between CMRglc versus CBF and ATP versus CBF, it is evident that the compensatory increase of CMRglc at rCBF between 20 and 35 ml/100 g/min was sufficient to replenish cellular energy content, leading to unsalted ATP even with compromised CBF. This elevation of glucose metabolism in regions with compromised CBF can potentially have profound clinical implications and serve as an imaging signature of ischemic penumbra.
Figure 4.
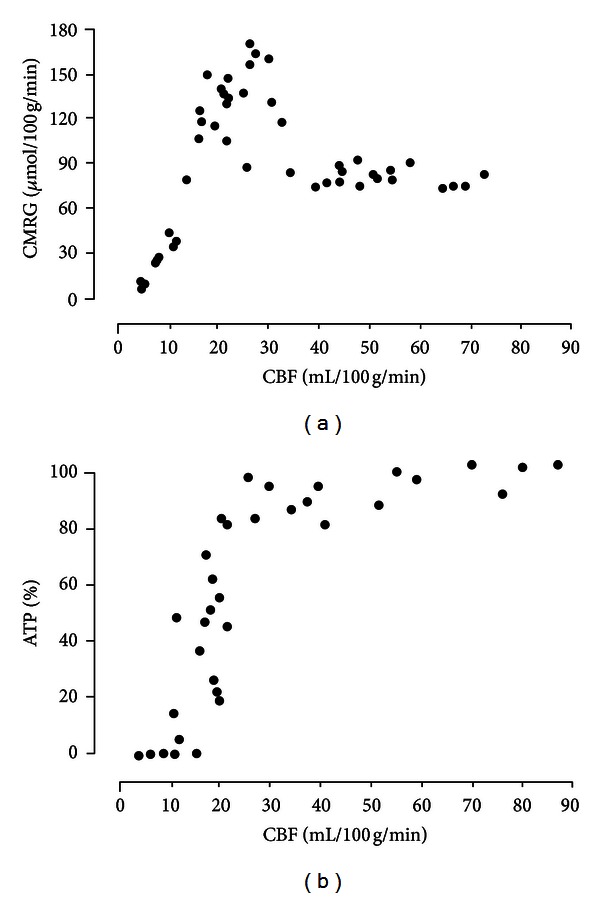
The association of cerebral blood flow (CBF) with cerebral metabolic rate of glucose (CMRglc) and ATP content in a gerbil stroke model (adapted from [50], with permission).
The utilization of 14C-2-DG for probing in vivo glucose metabolism is limited by its inapplicability for human studies, as well as for longitudinal evaluations of glucose metabolism. Thus, noninvasive markers of glucose metabolism are important for the assessment of temporal and spatial changes of glucose metabolism in ischemic stroke.
3.2. 18F-FDG PET in Ischemic Stroke
18F-FDG is a glucose analog in which the normal hydroxyl group in position 2′ is replaced by a positron-emitting radioactive isotope 18F [51]. Like glucose, the 18F-FDG is transported by GLUTs and is phosphorylated by hexokinase into 18F-FDG-6-phosphate (18F-FDG-6P) (Figure 3). The majority of 18F-FDG is trapped in brain cells ~1 hour after the injection, and thus PET scanning is usually initiated 40 minutes after the injection. The lack of the hydroxyl group prevents the 18F-FDG-6P from further metabolism and is thus trapped in cells. For this reason, the 18F-FDG-6P serves as a good marker revealing the in vivo distribution of glucose uptake by cells. Under normal physiologic conditions, neurons residing in the cortical gray matter, basal ganglia, cerebellum, and brain stem have the greatest glucose demand, resulting in the most intense 18F-FDG uptake [52, 53]. As mentioned previously, one of the major advantages of 18F-FDG is its long half-life, ~110 min. Therefore, an onsite cyclotron is not needed. With its long half-life, 18F-FDG has been widely used in experimental neurosciences and is the most commonly used radioisotope in clinical settings.
In the context of this review paper, we will focus our discussion on how 18F-FDG has been employed in the study of cerebral ischemia, particularly in predicting tissue fate. Experimental stroke studies will first be discussed, followed by patient studies. We will also determine if a similar elevated glucose metabolism in peri-ischemic regions as reported by Gingsberg et al. and Paschen et al. using 14C-2-DG was also reported using 18F-FDG.
3.2.1. Animal Studies
18F-FDG has been widely used in experimental stroke research for more than two decades. However, early studies did not specifically investigate how 18F-FDG uptake and metabolism can be used to discern ischemic penumbra [32] and thus they will not be discussed here.
Two recent studies evaluated 18F-FDG metabolism 75 minutes [54] and 3 hours [55] after MCAO using an ischemic stroke model, respectively. Sobrado et al. carried out a longitudinal evaluation of 18F-FDG metabolism and infarct size [55]. Both permanent (right MCA + bilateral ICA occlusion followed by reperfusion of contralateral CCA after 75 mins) and transient (right MCA + bilateral ICA occlusion followed by reperfusion of all 3 vessels at 75 mins) ischemia were studied. MRI was acquired at 3, 24, and 48 hours after MCAO [55]. They found that relative to the contralateral hemisphere, areas corresponding to ischemic core had decreased 18F-FDG uptake in both transient and permanent MCAO models for all three time points. To further determine if 18F-FDG could predict final tissue fates, abnormal ADC regions in the transient MCAO group were divided into two subcategories: progressed (recruited tissue) versus did not progressed (recoverable tissue) to final infarction at 24 hours. Although a reduced 18F-FDG uptake was observed in both categories, 18F-FDG uptake was significantly greater in recoverable tissue when compared to the recruited tissue, suggesting that 18F-FDG may provide a means of predicting final tissue fate. In addition to measuring 18F-FDG uptake, Walberer et al. further evaluated how quantitative measures of the rate constants of 18F-FDG uptake correlated with CBF and tissue fates in a rat embolic MCAO model [54]. Specifically, 18F-FDG K1 (18F-FDG transports from blood to the brain) and Ki (18F-FDG net influx rate constraint) kinetic constants were measured 75 min after stroke, and their ability in predicting final tissue outcome (MR T2 images) at 24 hours was evaluated. Two major findings were reported in this study. First, a strong correlation (r = 0.89) between K1 and rCBF 60 minutes after MCAO was observed, suggesting that K1 of 18F-FDG can be a reliable estimate of rCBF during the hyperacute phase of a stroke. Second, elevated Ki (preserved glucose consumption) and reduced K1 (reduced rCBF) were observed 75 min after stroke, suggesting the presence of viable tissues through a compensatory increase of glucose uptake and phosphorylation in the hypo-perfused tissue.
In contrast to utilizing 18F-FDG during hyperacute stroke, Kuge et al. investigated 18F-FDG uptake in a primate thromboembolic stroke model (autologous blood injection into the left ICA) 24 hours after MCAO [56]. They found that regions with a decrease of CBF and significant reduction of CMRglc at 24 hours after MCAO were consistent with negative 2,3,5-triphenyltetrazolium chloride (TTC) staining indicating infarction [57]. More importantly, several areas surrounding the ischemic core had moderately decreased CBF (40%–80% of contralateral values) and increased CMRglc at 24 hours, which corresponded to TTC positive staining.
More recently, Fukumoto et al. carried out a serial PET study (before and 1, 3, 7, and 14 days after stroke) using multiple radiotracers, including 18F-FDG for glucose metabolism, 11C-(R)PK11195 (peripheral benzodiazepine receptors) for neuroinflammation, and 11C-FMZ (central benzodiazepine receptor) for neuronal integrity in a photochemically induced thrombosis (PIT) MCAO rat model [58]. In the core, there was a significant reduction of 18F-FDG uptake in all study time points that was accompanied by an increased 11C-(R)PK11195 binding (suggesting neuroinflammation) at days 7 and 14 and reduced 11C-FMZ binding (suggesting neuronal loss) at days 7 and 14. On the other hand, 18F-FDG uptake in the peri-ischemic areas was comparable to the normal brain regions at days 1 and 3 and was significantly increased on days 7 and 14. The latter increase of 18F-FDG coincided with increased 11C-(R)PK11195 uptake at days 3 through 14. These findings suggest that the delayed increased FDG uptake in the peri-ischemic regions was largely attributed to inflammation. Furthermore, at poststroke day 7, there was a significant overlap between increased 18F-FDG and 11C-(R)PK11195 uptake on autoradiography, as well as increased Iba1 immunohistochemistry staining. Together, these findings imply microglial activation at post-MCAO day 7. Similar results were also reported by Rojas et al. [59] although neuroinflammation was more pronounced in the ischemic core when compared to penumbra at day 4 after stroke. The difference in animal models may account for the discrepancies between these two studies. Specifically, in the transient MCAO model, collateral circulation is significantly reduced by transient occlusion of both CCAs, possibly preventing activation of neuroinflammatory cascade in penumbral areas. Furthermore, reperfusion injury in the PIT model can damage microglial cells, leading to silenced neuroinflammation [58].
3.2.2. Clinical Studies
Despite promising findings from experimental stroke studies suggesting the potential clinical utility of 18F-FDG in discerning viable brain tissues, the applications of 18F-FDG in acute stroke patients are surprisingly scant; the majority of 18F-FDG studies in human ischemic stroke have been conducted in subacute or chronic phases of stroke. Nevertheless, some interesting findings and indirect evidence of elevated 18F-FDG uptake in the peri-ischemic areas similar to observations in animal studies have been reported [40, 60]. Several representative studies are reviewed below.
In 16 hemispheric ischemic stroke patients, Heiss and colleagues carried out multitracer PET, including 18F-FDG, H2 15O, 15O2, and C15O, at 6–48 hours (tp1, mean = 23 hours) and again 13–25 days (tp2, mean = 15.6 days) after stroke [40]. Probable core was defined as brain areas with the greatest reduction of CMRO2 and CBF, whereas border zones of peri-infarct tissues were defined as 2 rims of 7.65 mm (or 3 pixels) surrounding the infarct core. Each rim was divided into 4 sectors, rendering 8 peri-infarct regions per patient. Not surprisingly, a significant reduction of OEF, CMRO2, CBF, and CMRglc in the infarct core relative to the contralateral mirror region was observed at tp1, followed by hyperemia at tp2. For the border zone areas, although a significant reduction of CMRO2, CMRglc, and CBF at tp1 was observed which continued to decrease at tp2, the authors noted that the observed changes were highly heterogeneous. Qualitative examination of the peri-infarct regions revealed different outcomes with metabolic derangements. Specifically, peri-infarct regions with a stable or increased CMRO2, OEF, CMRglc, and glucose extraction fraction (GEF) at 24 hours after stroke were not infarcted, while low CMRO2, OEF, CMRglc, and OEF were consistent with CT evidence of infarction 4 days after stroke. More recently, Nasu et al. conducted 18F-FDG PET, MRI, and CT in 24 ischemic stroke patients 1 to 7 days after stroke onset [60]. Colocalized reduction of 18F-FDG uptake and an abnormal MR was noted in 20 patients. Of which, hyper uptake of 18F-FDG around the areas of decreased 18F-FDG was noted in 7 patients. Unfortunately, final tissue fates of the hyperuptake 18F-FDG regions were not evaluated in this study. Finally, chronic 18F-FDG studies (days and months after ischemic stroke) in stroke patients were also reported by several groups, and a reduction of 18F-FDG in the infarct areas is consistently reported [32, 45, 60, 61].
In summary, experimental studies of small animal [54, 55, 58] and primate [56] ischemic stroke models have revealed a consistent pattern of reduced 18F-FDG uptake in the presumed ischemic core regions. However, the temporal and spatial patterns of 18F-FDG uptake in the peri-ischemic regions are more variable in the literature. An acute elevated 14C-2-DG uptake in the peri-infarct area was reported by Ginsberg et al. [49]. Paschen et al. [50] further demonstrated that this increased uptake region corresponded to the ischemic penumbra. Interestingly, 18F-FDG studies conducted by Sobrado et al. [55] and Walberer et al. [54], both conducted during acute ischemia, failed to observe elevated 18F-FDG uptake in the peri-infarct area. Instead, an elevated uptake was observed at later times, >1 day after MCAO, which is more consistent with neuroinflammation. Attempting to discern the potential discrepancies in the temporal and spatial uptake patterns of glucose at the peri-ischemic region, we recently conducted 18F-FDG PET study using a transient intraluminal MCAO ischemic stroke rat model. 18F-FDG uptake patterns 30, 60, 90, 120, and 150 mins after MCAO were revealed. Final tissue fate was determined using 24 hours T2-weighted MR images. In concert to findings reported in the literature, we observed reduced 18F-FDG uptake in the ischemic core regions immediately after MCAO that remained low across all time points (Figure 5). Elevated 18F-FDG uptake in the peri-ischemic region was evident from 30 to 120 minutes, but largely diminished at 150 minutes after MCAO. More importantly, the majority of 18F-FDG hyper-uptake regions were not recruited in the final infarction at 24 hours, suggesting that the compensatory increase of 18F-FDG uptake may be associated with neuronal survival and is consistent with that reported by Paschen et al. [50]. Although additional studies are needed to further confirm our findings, our study suggests that acute elevated 18F-FDG uptake may offer a pathophysiologically relevant marker of tissue viability.
Figure 5.
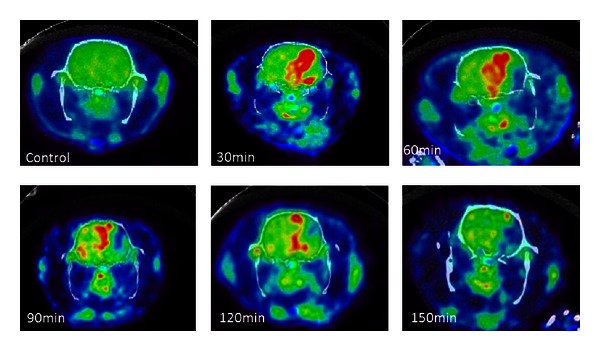
18F-FDG uptake prior to MCAO (control) and at different times after MCAO in a transient intraluminal MCAO rat model.
Similar to the experimental stroke studies, a severe reduction of 18F-FDG uptake at the presumed core area has also been consistently reported in human stroke studies [40, 45, 60, 61]. However, results on quantitative and qualitative temporal and spatial patterns of 18F-FDG uptake in stroke patients, particularly during the acute phase, are lacking. With ongoing technological advancements of PET imaging that allow more precise evaluation of spatial 18F-FDG uptake patterns, further studies specifically assessing 18F-FDG metabolisms in acute ischemic stroke patients are warranted.
4. Possible Mechanisms Underlying Increased 18F-FDG Uptake in the Probable Penumbral Tissue
In light of the potential clinical utility of the observed acute 18F-FDG hyper uptake in revealing the presence of ischemic penumbra, this section will discuss potential cellular and physiological mechanisms that may contribute to such 18F-FDG hyper-uptake at the peri-ischemic regions (Table 2).
Table 2.
Possible mechanisms of increased 18F-FDG utilization in penumbral areas.
| Cellular mechanisms | Time course | |
|---|---|---|
| Increased FDG transport | ||
| GLUT1 upregulation | Increased 18F-FDG transport across the blood-brain barrier | Acute |
| GLUT3 upregulation | Increased 18F-FDG uptake by neurons | Acute |
| GLUT5 upregulation | Increased 18F-FDG uptake by microglia cells | Subacute to chronic |
| Increased FDG phosphorylation | ||
| Hexokinase upregulation | Increased 18F-FDG-6P “trapping” in cells | Acute |
| Neuroinflammation | ||
| Microglia activation | Increased 18F-FDG uptake by activated cells | Acute |
| Leukocyte migration | Increased 18F-FDG uptake by activated cells | Sub-acute |
| Macrophage migration | Increased 18F-FDG uptake by activated cells | Sub-acute |
|
| ||
| Physiologic associations | ||
|
| ||
| Peri-infarct speeding depression-like depolarization (PID) | Increased metabolic demand | Acute to sub-acute |
| Neuronal regeneration | Increased metabolic demand | Acute to sub-acute |
4.1. Cellular Mechanisms
4.1.1. Activation of GLUTs
As discussed previously, GLUTs play a critical role in transporting glucose from blood to the brain. Therefore, an upregulation of GLUTs expression may lead to an increased 18F-FDG uptake in PET images. A number of studies have reported that GLUTs can be up-regulated in response to cerebral ischemia in a manner similar to the observed temporal and spatial patterns of 18F-FDG uptake in ischemic stroke studies [54, 55]. Specifically, experimental studies of neuronal gene therapy have demonstrated that induction of brain GLUT1 overexpression during ischemic insult was associated with a significant increase of glucose transport using 2-DG autoradiography [62], as well as improved neuronal survival [63, 64]. Lee and Bondy reported that MCAO in rats induced a global and immediate (within an hour) increase of GLUT1 glial and neuronal mRNA expressions even in brain regions that normally do not express GLUT1 [65]. GLUT1 mRNA expression subsequently lateralized to the ischemic hemisphere and was mainly evident in the cortical regions surrounding the ischemic core at 24 hours. McCall et al. demonstrated an increased number of parenchymal and microvascular GLUT1s 24 hours and 4 days after MCAO [66]. Vannucci et al. studied changes of GLUT1 and GLUT3 mRNAs expressions after 2.5 hours of severe hypoxic-ischemic insult in 7-day-old rat brains [67]. They found elevated BBB GLUT1 mRNA expressions in both hemispheres 1 hour after ischemic insults. In addition, similar to observations by Lee and Bondy [65], this elevated GLU1 mRNA expression only persisted in the ipsilateral hemisphere during 24 hours of recovery. In the same study, the authors further reported that the temporal expression of neuronal GLUT3 mRNA appeared tissue fate dependent. The GLUT3 mRNAs expression continued to decrease in the core throughout the entire study, while the penumbral areas exhibited an increase of GLUT3 mRNA expression at 1 hour but started to decrease 3 hours after ischemic insults. Finally, maximally increased GLUT5 expression at the peri-infarct areas has been reported in a rat MCAO model 5 days after stroke that remained elevated until 15 days after the insult [68], suggesting that GLUT5 activation is consistent with neuroinflammation in response to neuronal necrosis [47].
In summary, temporospatial changes of GLUTs 1 and 3 mRNA expressions in ischemic conditions may partially account for acutely increased 18F-FDG PET uptake in the peri-ischemic regions [40, 54–56, 58, 60]. This up-regulation of GLUTs can serve as an important compensatory mechanism to facilitate glucose transport via the BBB and into cells in order to replenish energy stores and promote neuronal survival. In contrast, increased GLUT5 expression may be more associated with inflammation during the sub-acute phase.
4.1.2. Activation of Hexokinase
Phosphorylation by hexokinase is one of the principal steps in 18F-FDG metabolism and is also a rate-limiting step of glucose metabolism. Up-regulation of phosphorylation in response to reduced oxygen availability has been suggested. Specifically, Paschen et al. demonstrated that a greater proportion of 14C-2-DG was phosphorylated in ischemic regions when compared to healthy brain regions (90% versus 80%) in an MCAO gerbil model [50]. As discussed previously, Walberer et al. demonstrated that part of the peri-infarct tissues had reduced K1 and increased Ki 18F-FDG rate constants 1 hour after MCAO, suggesting a compensatory increase of the glucose phosphorylation rate that requires both hexokinase and ATP [54]. Studies of brain tumor cell cultures and in myocardial infarction animal models reported upregulated hexokinase mRNA expression in response to hypoxia [69–71]. Similarly, a study of cerebrocortical cell cultures found that 3 days of exposure to 1% oxygen increased activities of glycolytic and its related enzymes (hexokinase, lactate dehydrogenase, and pyruvate kinase), as well as decreased activities of the TCA cycle related enzymes (citrate synthase and glutamate dehydrogenase), suggesting that neurons are capable of adapting to prolonged hypoxia by upregulating glycolysis and downregulating oxidative energy metabolism [72]. Finally, upregulation of hexokinase was observed in a global cerebral ischemic model using 7-day postnatal rats [73]. Collectively, these findings suggest that changes of hexokinase activity and expression in response to hypoxia may contribute to the increased “trapping” of 18F-FDG-6P in the peri-ischemic regions.
4.1.3. Neuroinflammation
Neuroinflammation is a temporally and spatially dynamic process that includes resident brain cells (most importantly microglia) and blood-borne leukocytes and monocytes (for comprehensive review on neuroinflammation, see [74, 75]). It is generally believed that microglial activation is the first step of the neuroinflammatory process, followed by an influx of neutrophils 1 day after-stroke, and infiltration of macrophages 2 days after-stroke [74]. Since immune cells participating in acute (neutrophils) and chronic (macrophages) inflammatory responses have high metabolic demands, it may not be surprising that neuroinflammation results in an increased uptake of 18F-FDG [76–79].
Temporal and spatial progression of neuroinflammation was extensively studied in experimental stroke models. It was shown that mRNA expression of glial fibrillary acidic protein, a marker of reactive astrocytes, started to increase at 6 hours and continued to increase until day 3 after MCAO [80]. Using a permanent MCAO rat model, Mabuchi et al. found that activated microglia was evident in the peripheral area surrounding the infarction at 6 hours and continued to increase in number up to 48 hours after stroke, which coincided with a peak of macrophage accumulation along the boundary of infarction [81]. Furthermore, significant elevation of neuroinflammation 7 days after MCAO was demonstrated by an increased 11C-(R)PK11195 uptake in activated microglia cells as well as by increased number and activation of microglial cells and macrophages using immunohistochemical examination in ischemic penumbra [58, 82] and core [59].
In contrast to experimental stroke studies, temporal progression and spatial distribution of neuroinflammation in humans are most likely different [74]. Postmortem autopsy studies demonstrated the appearance of neutrophils at day 1 and peaked at days 2-3, as well as invasion of macrophages at day 5 (peak at 3 weeks) after stroke [83, 84]. However, post mortem studies are limited by their inability to provide temporal changes of neuroinflammation. In contrast, non-invasive imaging approaches have been employed to provide insights into the temporal behaviors of neuroinflammation [85–88]. Akopov et al. used SPECT to image 88 acute hemispheric stroke patients with technetium-99 m hexamethylpropyleneamine oxime-labeled leukocytes. An increased leukocyte accumulation was evident at 6 hours, progressively increased until 24 hours, and remained high up to 9 days after stroke [86]. Furthermore, 11C-PK11195 PET has been employed to study microglial activation [87, 88]. Price et al. performed 11C-PK11195 PET in 4 patients with left MCA territory strokes [88]. Significant binding potential of 11C-PK11195 was evident in the core and penumbral regions at 2 days and remained evident up to 30 days after stroke. The 11C-PK11195, however, lacks specificity to different subtypes of neuroinflammatory cells since it binds to mitochondrial peripheral benzodiazepine receptors that are expressed in astrocytes, macrophages, activated microglia, granulocytes, and lymphocytes [89, 90].
Activation of resident brain cells and transmigration of blood-borne immune cells can also be important determinants of the observed increased 18F-FDG uptake in the peri-infarct areas. However, to the best of our knowledge, there have been no studies systematically investigating temporal and spatial progression of in vivo neuroinflammation and its association with glucose metabolism in humans.
4.2. Physiological Associations
It is important to note that direct empirical evidence linking increased 18F-FDG uptake and to be discussed physiological mechanisms is currently lacking. Therefore, the proposed associations should be considered speculative rather than determinative. Nonetheless, we believe that it is important to discuss them because these mechanisms are physiologically relevant and are associated with cell activation that could lead to increased energy demand and thus 18F-FDG hyper-uptake.
4.2.1. Peri-Infarct Spreading Depression-Like Depolarization
Peri-infarct spreading depression-like depolarizations (PIDs) are characterized as cortical DC shifts (about 20 mV) that spread along the cerebral cortex at a regular interval with a speed of 3–5 mm/min [91, 92]. Increased neuronal energy demands in PIDs could potentially be associated with 18F-FDG hyper-uptake. Results from experimental stroke models revealed that PIDs are triggered by the anoxic release of potassium and excitatory amino acids, tend to occur in clusters, and are associated with a significantly increased metabolic rate and energy demands that are not coupled with increase of blood flow. As a result, PIDs could lead to transient episodes of ischemia and the growth of an infarct core into the penumbral zone [91–93]. Therefore, it is plausible that PIDs induced neuronal activation, and thus the increased metabolic demand in the penumbral areas can be associated with the observed increased 18F-FDG uptake. For example, repeated cortical spreading depression (induced by cortical application of 3.3 M KCl solution) in cats was associated with increased cortical 18F-FDG uptake and rCBF in PET 60–120 minutes after the experimental procedure [57]. With regards to the temporal relation between PIDs and the onset of ischemia, studies in animal MCAO models indicated that PIDs occur immediately after stroke and progress until the terminal injury [94, 95].
Dohmen et al. were the first to demonstrate PIDs in ischemic stroke patients [96]. Specifically, electrodes were placed at the peri-infarct region of 16 patients undergoing decompressive craniectomy between 9 and 105 hours (mean = 39.8 ± 27.3 hours) after malignant MCA strokes. Spontaneous PIDs were recorded in all but two patients, who were later found to have electrode strips placed over the infarcted tissue. Interestingly, the frequency of PIDs (25 PIDs in 198 hours or 1 PID per 8 hours of monitoring) was the greatest in the patient with the shortest time interval between stroke onset and monitoring (13 hours). Not surprisingly, an increasing ECoG recovery time was observed over time, indicating progressive hemodynamic and metabolic deterioration. These findings suggest that PIDs seem to occur more frequently during acute strokes and decrease with time. PIDs were also recorded in humans with traumatic brain injury and intracerebral hemorrhage, albeit with a lower frequency than those in ischemic stroke patients [97], suggesting that these electrophysiological abnormalities are common in response to impeding functional and structural damage.
4.2.2. Neuronal Regeneration
Neuronal regeneration starts early after ischemic insults and could also contribute to the observed increase of 18F-FDG utilization in the peri-infarct areas. For example, increased expression of mRNA encoding neuropilin-(Npn-) 1, Npn-2, and semaphorin 3A (Sema3A), proteins involved in axonal growth, was reported within hours after MCAO in rats [98]. Furthermore, mRNA expression of brain-derived neurotrophic factor, a member of the neurotrophin family promoting survival and growth of various nerve cell populations [99] and modulating glutamine excitotoxicity in penumbral areas [100], and its full-length receptor have been shown to increase in ischemic penumbrae and reduce in ischemic cores 12 hours after MCAO [101]. However, the temporal and spatial relationship between neuronal regeneration and glucose metabolism in ischemic stroke has not been fully explored to date.
5. Increased 18F-FDG Uptake versus Increased Glucose Metabolism
While the previous discussion offers some of the potential underlying biological mechanisms attributed to the observed hyper uptake of 18F-FDG in the peri-ischemic areas, one remaining major question is whether or not the increased 18F-FDG uptake truly reflects an increased glucose metabolism. To this end, it is important to discuss the lumped constant (LC), that is, the ratio of the metabolic rate of 18F-FDG and the metabolic rate of glucose. LC accounts for the differences in transportation, phosphorylation, and volume of distribution between 18F-FDG and glucose [102]. Therefore, an LC of 1 indicates that there are no changes between the metabolic rates of 18F-FDG and glucose; that is, the metabolic rate of 18F-FDG is equal to the metabolic rate of glucose. However, there are significant differences between phosphorylation of 18F-FDG and glucose. As a result, CMRglc is usually estimated using a LC of 0.42. More recent studies in a cat MCAO model [103], and an in vitro cell model [104] separately demonstrated that ischemic or hypo-perfused tissues can result in a 20% to 78% increase of LC when compared to the normal brain tissue. These findings have profound implications on the utilization of 18F-FDG for assessing glucose metabolism. Specifically, in the event when concurrently increased 18F-FDG uptake and LC occurs, the increased 18F-FDG uptake might not reflect increased glucose metabolism. To make the matter worse, the extent to which LC is altered in response to ischemia can be time and species dependent [105]. Therefore, one must be cautious in the interpretation of 18F-FDG uptake as a marker of glucose metabolism.
6. Limitations of 18F-FDG PET
Despite its potential clinical values, limitations on using 18F-FDG PET for acute stroke patients should be acknowledged. Widely accepted standardized protocols for the acquisition and analysis of 18F-FDG PET remain lacking, limiting the quantitative evaluation of 18F-FDG PET across centers [106, 107]. Technical factors including optimal timing between 18F-FDG injection and PET imaging, the partial-volume effects [108], and uniform determination of ROIs should be considered [106]. Furthermore, the relatively long time interval between injection and PET imaging could make it impractical for the management of acute stroke patients. Radiolabeled tracers are sources of radiation, and the combination of PET with CT further increases radiation doses. Finally, ensuring 24/7 availability of 18F-FDG can impose challenges in some clinical centers.
Certain clinical situations that are common in the acute ischemic stroke settings can also dampen the clinical utility of 18F-FDG-PET. Transient hyperglycemia is common in acute ischemic stroke patients [109], which can impact the 18F-FDG PET results [107, 110]. Acute correction of hyperglycemia with insulin does not substantially improve 18F-FDG PET image quality because of different dynamics of normalization of plasma versus intracellular glucose concentrations [107]. Sedative medications that alter global metabolism of glucose should be considered. Finally, the inability of acute stroke patients holding still during PET images can also lead to compromised PET image quality.
7. Conclusions
Although 18F-FDG PET is widely available in clinical settings, its potential clinical utility for the management of acute stroke patients has not been extensively studied. Specifically, both experimental and clinical stroke studies have consistently demonstrated a reduction of 18F-FDG uptake in the presumed core regions, whereas the 18F-FDG uptake patterns in the peri-infarct regions are less consistent in the literature. This paper comprehensively reviews the temporal and spatial variations of glucose metabolism in response to cerebral ischemia with special attention on the peri-infarct regions. In particular, an elevated 18F-FDG (14C-2-DG) uptake in the presumed ischemic penumbra regions has been observed, which appears capable of predicting final tissue fate. The potential cellular mechanisms accounting for the increased glucose utilization and 18F-FDG uptake in the peri-infarct areas (activation of GLUTs, hexokinase, and neuroinflammation) were discussed. In addition, the possible physiological associations (PIDs and neuroregeneration) were proposed. Although the clinical utility of 18F-FDG PET in managing acute stroke patients remains to be seen, rigorous and systematic evaluations of 18F-FDG uptake patterns in acute ischemic stroke patients are warranted.
References
- 1.Go AS, Mozaffarian D, Roger VL, et al. Heart disease and stroke statistics—2013 update: a report from the American Heart Association. Circulation. 2013;127(1):e6–e245. doi: 10.1161/CIR.0b013e31828124ad. [DOI] [PMC free article] [PubMed] [Google Scholar]
- 2.Donnan GA, Fisher M, Macleod M, Davis SM. Stroke. The Lancet. 2008;371(9624):1612–1623. doi: 10.1016/S0140-6736(08)60694-7. [DOI] [PubMed] [Google Scholar]
- 3.Adams HP, del Zoppo G, Alberts MJ, et al. Guidelines for the early management of adults with ischemic stroke: a guideline from the American Heart Association/American Stroke Association Stroke Council, Clinical Cardiology Council, Cardiovascular Radiology and Intervention Council, and the Atherosclerotic Peripheral Vascular Disease and Quality of Care Outcomes in Research Interdisciplinary Working Groups: The American Academy of Neurology affirms the value of this guideline as an educational tool for neurologists. Circulation. 2007;115(20):e478–534. doi: 10.1161/CIRCULATIONAHA.107.181486. [DOI] [PubMed] [Google Scholar]
- 4.Tissue plasminogen activator for acute ischemic stroke. The National Institute of Neurological Disorders and Stroke rt-PA Stroke Study Group. New England Journal of Medicine. 1995;333(24):1581–1587. doi: 10.1056/NEJM199512143332401. [DOI] [PubMed] [Google Scholar]
- 5.Kwiatkowski TG, Libman RB, Frankel M, et al. Effects of tissue plasminogen activator for acute ischemic stroke at one year. National Institute of Neurological Disorders and Stroke Recombinant Tissue Plasminogen Activator Stroke Study Group. New England Journal of Medicine. 1999;340(23):1781–1787. doi: 10.1056/NEJM199906103402302. [DOI] [PubMed] [Google Scholar]
- 6.Hacke W, Kaste M, Bluhmki E, et al. Thrombolysis with alteplase 3 to 4.5 hours after acute ischemic stroke. New England Journal of Medicine. 2008;359(13):1317–1329. doi: 10.1056/NEJMoa0804656. [DOI] [PubMed] [Google Scholar]
- 7.Lees KR, Bluhmki E, von Kummer R, et al. Time to treatment with intravenous alteplase and outcome in stroke: an updated pooled analysis of ECASS, ATLANTIS, NINDS, and EPITHET trials. The Lancet. 2010;375(9727):1695–1703. doi: 10.1016/S0140-6736(10)60491-6. [DOI] [PubMed] [Google Scholar]
- 8.Blackham KA, Meyers PM, Abruzzo TA, et al. Endovascular therapy of acute ischemic stroke: report of the Standards of Practice Committee of the Society of NeuroInterventional Surgery. Journal of NeuroInterventional Surgery. 2012;4(2):87–93. doi: 10.1136/neurintsurg-2011-010243. [DOI] [PubMed] [Google Scholar]
- 9.Smith WS, Sung G, Saver J, et al. Mechanical thrombectomy for acute ischemic stroke: final results of the multi MERCI trial. Stroke. 2008;39(4):1205–1212. doi: 10.1161/STROKEAHA.107.497115. [DOI] [PubMed] [Google Scholar]
- 10.Darkhabani Z, Nguyen T, Lazzaro MA, et al. Complications of endovascular therapy for acute ischemic stroke and proposed management approach. Neurology. 2012;79(13, supplement 1):S192–S198. doi: 10.1212/WNL.0b013e31826958e3. [DOI] [PubMed] [Google Scholar]
- 11.Merino JG, Warach S. Imaging of acute stroke. Nature Reviews Neurology. 2010;6(10):560–571. doi: 10.1038/nrneurol.2010.129. [DOI] [PubMed] [Google Scholar]
- 12.Albers GW, Thijs VN, Wechsler L, et al. Magnetic resonance imaging profiles predict clinical response to early reperfusion: the diffusion and perfusion imaging evaluation for understanding stroke evolution (DEFUSE) study. Annals of Neurology. 2006;60(5):508–517. doi: 10.1002/ana.20976. [DOI] [PubMed] [Google Scholar]
- 13.Paciaroni M, Caso V, Agnelli G. The concept of ischemic penumbra in acute stroke and therapeutic opportunities. European Neurology. 2009;61(6):321–330. doi: 10.1159/000210544. [DOI] [PubMed] [Google Scholar]
- 14.Heiss WD. The ischemic penumbra: correlates in imaging and implications for treatment of ischemic stroke. The Johann Jacob Wepfer award 2011. Cerebrovascular Diseases. 2011;32(4):307–320. doi: 10.1159/000330462. [DOI] [PubMed] [Google Scholar]
- 15.Davis SM, Donnan GA, Parsons MW, et al. Effects of alteplase beyond 3 h after stroke in the Echoplanar Imaging Thrombolytic Evaluation Trial (EPITHET): a placebo-controlled randomised trial. The Lancet Neurology. 2008;7(4):299–309. doi: 10.1016/S1474-4422(08)70044-9. [DOI] [PubMed] [Google Scholar]
- 16.Lin WL, Powers WJ. Special issue: clinical imaging of hyperacute stroke. Translational Stroke Research. 2012;3(2):173–177. doi: 10.1007/s12975-012-0173-x. [DOI] [PubMed] [Google Scholar]
- 17.Konstas AA, Wintermark M, Lev MH. CT perfusion imaging in acute stroke. Neuroimaging Clinics of North America. 2011;21(2):215–238. doi: 10.1016/j.nic.2011.01.008. [DOI] [PubMed] [Google Scholar]
- 18.Fisher M, Bastan B. Identifying and utilizing the ischemic penumbra. Neurology. 2012;79(13, supplement 1):S79–S85. doi: 10.1212/WNL.0b013e3182695814. [DOI] [PubMed] [Google Scholar]
- 19.Sobesky J. Refining the mismatch concept in acute stroke: lessons learned from PET and MRI. Journal of Cerebral Blood Flow & Metabolism. 2012;32(7):1416–1425. doi: 10.1038/jcbfm.2012.54. [DOI] [PMC free article] [PubMed] [Google Scholar]
- 20.Ebinger M, De Silva DA, Christensen S, et al. Imaging the penumbra—strategies to detect tissue at risk after ischemic stroke. Journal of Clinical Neuroscience. 2009;16(2):178–187. doi: 10.1016/j.jocn.2008.04.002. [DOI] [PubMed] [Google Scholar]
- 21.Schlaug G, Benfield A, Baird AE, et al. The ischemic penumbra: operationally defined by diffusion and perfusion MRI. Neurology. 1999;53(7):1528–1537. doi: 10.1212/wnl.53.7.1528. [DOI] [PubMed] [Google Scholar]
- 22.Engelter ST, Wetzel SG, Bonati LH, Fluri F, Lyrer PA. The clinical significance of diffusion-weighted MR imaging in stroke and TIA patients. Swiss Medical Weekly. 2008;138(49-50):729–740. doi: 10.4414/smw.2008.12249. [DOI] [PubMed] [Google Scholar]
- 23.Dani KA, Thomas RG, Chappell FM, et al. Computed tomography and magnetic resonance perfusion imaging in ischemic stroke: definitions and thresholds. Annals of Neurology. 2011;70(3):384–401. doi: 10.1002/ana.22500. [DOI] [PubMed] [Google Scholar]
- 24.Powers WJ. Perfusion-diffusion mismatch: does it identify who will benefit from reperfusion therapy? Translational Stroke Research. 2012;3(2):182–187. doi: 10.1007/s12975-012-0160-2. [DOI] [PubMed] [Google Scholar]
- 25.Allmendinger AM, Tang ER, Lui YW, et al. Imaging of stroke: part 1, Perfusion CT—overview of imaging technique, interpretation pearls, and common pitfalls. American Journal of Roentgenology. 2012;198(1):52–62. doi: 10.2214/AJR.10.7255. [DOI] [PubMed] [Google Scholar]
- 26.Bivard A, Levi C, Spratt N, et al. Perfusion CT in acute stroke: a comprehensive analysis of infarct and penumbra. Radiology. 2012 doi: 10.1148/radiol.12120971. [DOI] [PubMed] [Google Scholar]
- 27.Powers WJ, Zazulia AR. PET in cerebrovascular disease. PET Clinics. 2010;5(1) doi: 10.1016/j.cpet.2009.12.007.83106 [DOI] [PMC free article] [PubMed] [Google Scholar]
- 28.Astrup J, Siejo BK, Symon L. Thresholds in cerebral ischemia—the ischemic penumbra. Stroke. 1981;12(6):723–725. doi: 10.1161/01.str.12.6.723. [DOI] [PubMed] [Google Scholar]
- 29.Baron JC, Bousser MG, Rey A. Reversal of focal “misery-perfusion syndrome” by extra-intracranial arterial bypass in hemodynamic cerebral ischemia. A case study with 15O positron emission tomography. Stroke. 1981;12(4):454–459. doi: 10.1161/01.str.12.4.454. [DOI] [PubMed] [Google Scholar]
- 30.Heiss WD, Rosner G. Functional recovery of cortical neurons as related to degree and duration of ischemia. Annals of Neurology. 1983;14(3):294–301. doi: 10.1002/ana.410140307. [DOI] [PubMed] [Google Scholar]
- 31.Marcoux FW, Morawetz RB, Crowell RM. Differential regional vulnerability in transient focal cerebral ischemia. Stroke. 1982;13(3):339–346. doi: 10.1161/01.str.13.3.339. [DOI] [PubMed] [Google Scholar]
- 32.Heiss WD, Graf R, Wienhard K, et al. Dynamic penumbra demonstrated by sequential multitracer PET after middle cerebral artery occlusion in cats. Journal of Cerebral Blood Flow and Metabolism. 1994;14(6):892–902. doi: 10.1038/jcbfm.1994.120. [DOI] [PubMed] [Google Scholar]
- 33.Giffard C, Young AR, Kerrouche N, Derlon JM, Baron JC. Outcome of acutely ischemic brain tissue in prolonged middle cerebral artery occlusion: a serial positron emission tomography investigation in the baboon. Journal of Cerebral Blood Flow and Metabolism. 2004;24(5):495–508. doi: 10.1097/00004647-200405000-00003. [DOI] [PubMed] [Google Scholar]
- 34.Pappata S, Fiorelli M, Rommel T, et al. PET study of changes in local brain hemodynamics and oxygen metabolism after unilateral middle cerebral artery occlusion in baboons. Journal of Cerebral Blood Flow and Metabolism. 1993;13(3):416–424. doi: 10.1038/jcbfm.1993.56. [DOI] [PubMed] [Google Scholar]
- 35.Touzani O, Young AR, Derlon JM, et al. Sequential studies of severely hypometabolic tissue volumes after permanent middle cerebral artery occlusion: a positron emission tomographic investigation in anesthetized baboons. Stroke. 1995;26(11):2112–2119. doi: 10.1161/01.str.26.11.2112. [DOI] [PubMed] [Google Scholar]
- 36.Shimosegawa E, Hatazawa J, Ibaraki M, Toyoshima H, Suzuki A. Metabolic penumbra of acute brain infarction: a correlation with infarct growth. Annals of Neurology. 2005;57(4):495–504. doi: 10.1002/ana.20427. [DOI] [PubMed] [Google Scholar]
- 37.Furlan M, Marchai G, Viader F, Derlon JM, Baron JC. Spontaneous neurological recovery after stroke and the fate of the ischemic penumbra. Annals of Neurology. 1996;40(2):216–226. doi: 10.1002/ana.410400213. [DOI] [PubMed] [Google Scholar]
- 38.Frykholm P, Andersson JLR, Valtysson J, et al. A metabolic threshold of irreversible ischemia demonstrated by PET in a middle cerebral artery occlusion—reperfusion primate model. Acta Neurologica Scandinavica. 2000;102(1):18–26. doi: 10.1034/j.1600-0404.2000.102001018.x. [DOI] [PubMed] [Google Scholar]
- 39.Sakoh M, Østergaard L, Røhl L, et al. Relationship between residual cerebral blood flow and oxygen metabolism as predictive of ischemic tissue viability: sequential multitracer positron emission tomography scanning of middle cerebral artery occlusion during the critical first 6 hours after stroke in pigs. Journal of Neurosurgery. 2000;93(4):647–657. doi: 10.3171/jns.2000.93.4.0647. [DOI] [PubMed] [Google Scholar]
- 40.Heiss WD, Huber M, Fink GR, et al. Progressive derangement of periinfarct viable tissue in ischemic stroke. Journal of Cerebral Blood Flow and Metabolism. 1992;12(2):193–203. doi: 10.1038/jcbfm.1992.29. [DOI] [PubMed] [Google Scholar]
- 41.Tillisch J, Brunken R, Marshall R. Reversibility of cardial wall-motion abnormalities predicted by positron tomography. New England Journal of Medicine. 1986;314(14):884–888. doi: 10.1056/NEJM198604033141405. [DOI] [PubMed] [Google Scholar]
- 42.Tamaki N, Kawamoto M, Tadamura E, et al. Prediction of reversible ischemia after revascularization: perfusion and metabolic studies with positron emission tomography. Circulation. 1995;91(6):1697–1705. doi: 10.1161/01.cir.91.6.1697. [DOI] [PubMed] [Google Scholar]
- 43.Positron emission tomography for the assessment of myocardial viability: an evidence-based analysis. Ontario Health Technology Assessment Series. 2010;10(16):1–80. [PMC free article] [PubMed] [Google Scholar]
- 44.Garibotto V, Heinzer S, Vulliemoz S, et al. Clinical applications of hybrid PET/MRI in neuroimaging. Clinical Nuclear Medicine. 2013;38(1):e13–e18. doi: 10.1097/RLU.0b013e3182638ea6. [DOI] [PubMed] [Google Scholar]
- 45.Baron JC, Rougemont D, Soussaline F. Local interrelationships of cerebral oxygen consumption and glucose utilization in normal subjects and in ischemic stroke patients: a positron tomography study. Journal of Cerebral Blood Flow and Metabolism. 1984;4(2):140–149. doi: 10.1038/jcbfm.1984.22. [DOI] [PubMed] [Google Scholar]
- 46.Lebrun Grandie P, Baron JC, Soussaline F. Coupling between regional blood flow and oxygen utilization in the normal human brain. A study with positron tomography and oxygen 15. Archives of Neurology. 1983;40(4):230–236. doi: 10.1001/archneur.1983.04050040060010. [DOI] [PubMed] [Google Scholar]
- 47.Vannucci SJ, Maher F, Simpson IA. Glucose transporter proteins in brain: delivery of glucose to neurons and glia. Glia. 1997;21(1):2–21. doi: 10.1002/(sici)1098-1136(199709)21:1<2::aid-glia2>3.0.co;2-c. [DOI] [PubMed] [Google Scholar]
- 48.Wilson JE. Isozymes of mammalian hexokinase: structure, subcellular localization and metabolic function. Journal of Experimental Biology. 2003;206(12):2049–2057. doi: 10.1242/jeb.00241. [DOI] [PubMed] [Google Scholar]
- 49.Ginsberg MD, Reivich M, Giandomenico A, Greenberg JH. Local glucose utilization in acute focal cerebral ischemia: local dysmetabolism and diaschisis. Neurology. 1977;27(11):1042–1048. doi: 10.1212/wnl.27.11.1042. [DOI] [PubMed] [Google Scholar]
- 50.Paschen W, Mies G, Hossmann KA. Threshold relationship between cerebral blood flow, glucose utilization, and energy metabolites during development of stroke in gerbils. Experimental Neurology. 1992;117(3):325–333. doi: 10.1016/0014-4886(92)90142-d. [DOI] [PubMed] [Google Scholar]
- 51.Fowler JS, Ido T. Initial and subsequent approach for the synthesis of 18FDG. Seminars in Nuclear Medicine. 2002;32(1):6–12. doi: 10.1053/snuc.2002.29270. [DOI] [PubMed] [Google Scholar]
- 52.Schulthess GKV. Molecular Anatomic Imaging : PET-CT and SPECT-CT Integrated Modality. 2nd edition. Philadelphia, Pa, USA: Lippincott Williams & Wilkins; 2007. [Google Scholar]
- 53.Cook GJR, Maisey MN, Fogelman I. Normal variants, artefacts and interpretative pitfalls in PET imaging with 18-fluoro-2-deoxyglucose and carbon-11 methionine. European Journal of Nuclear Medicine. 1999;26(10):1363–1378. doi: 10.1007/s002590050597. [DOI] [PubMed] [Google Scholar]
- 54.Walberer M, Backes H, Rueger MA, et al. Potential of early [(18)F]-2-fluoro-2-deoxy-D-glucose positron emission tomography for identifying hypoperfusion and predicting fate of tissue in a rat embolic stroke model. Stroke. 2012;43(1):193–198. doi: 10.1161/STROKEAHA.111.624551. [DOI] [PubMed] [Google Scholar]
- 55.Sobrado M, Delgado M, Fernández-Valle E, et al. Longitudinal studies of ischemic penumbra by using 18F-FDG PET and MRI techniques in permanent and transient focal cerebral ischemia in rats. NeuroImage. 2011;57(1):45–54. doi: 10.1016/j.neuroimage.2011.04.045. [DOI] [PubMed] [Google Scholar]
- 56.Kuge Y, Yokota C, Tagaya M, et al. Serial changes in cerebral blood flow and flow-metabolism uncoupling in primates with acute thromboembolic stroke. Journal of Cerebral Blood Flow and Metabolism. 2001;21(3):202–210. doi: 10.1097/00004647-200103000-00003. [DOI] [PubMed] [Google Scholar]
- 57.Kuge Y, Hasegawa Y, Yokota C, et al. Effects of single and repetitive spreading depression on cerebral blood flow and glucose metabolism in cats: a PET study. Journal of the Neurological Sciences. 2000;176(2):114–123. doi: 10.1016/s0022-510x(00)00327-0. [DOI] [PubMed] [Google Scholar]
- 58.Fukumoto D, Hosoya T, Nishiyama S, et al. Multiparametric assessment of acute and subacute ischemic neuronal damage: a small animal positron emission tomography study with rat photochemically induced thrombosis model. Synapse. 2011;65(3):207–214. doi: 10.1002/syn.20836. [DOI] [PubMed] [Google Scholar]
- 59.Rojas S, Martín A, Arranz MJ, et al. Imaging brain inflammation with [11C]PK11195 by PET and induction of the peripheral-type benzodiazepine receptor after transient focal ischemia in rats. Journal of Cerebral Blood Flow and Metabolism. 2007;27(12):1975–1986. doi: 10.1038/sj.jcbfm.9600500. [DOI] [PubMed] [Google Scholar]
- 60.Nasu S, Hata T, Nakajima T, Suzuki Y. Evaluation of 18F-FDG PET in acute ischemic stroke: assessment of hyper accumulation around the lesion. Kaku Igaku. 2002;39(2):103–110. [PubMed] [Google Scholar]
- 61.Kuhl DE, Phelps ME, Kowell AP. Effects of stroke on local cerebral metabolism and perfusion: mapping by emission computed tomography of 18FDG and 13NH3 . Annals of Neurology. 1980;8(1):47–60. doi: 10.1002/ana.410080108. [DOI] [PubMed] [Google Scholar]
- 62.Ho DY, Mocarski ES, Sapolsky RM. Altering central nervous system physiology with a defective herpes simplex virus vector expressing the glucose transporter gene. Proceedings of the National Academy of Sciences of the United States of America. 1993;90(8):3655–3659. doi: 10.1073/pnas.90.8.3655. [DOI] [PMC free article] [PubMed] [Google Scholar]
- 63.Yenari MA, Dumas TC, Sapolsky RM, Steinberg GK. Gene therapy for treatment of cerebral ischemia using defective herpes simplex viral vectors. Annals of the New York Academy of Sciences. 2001;939:340–357. doi: 10.1111/j.1749-6632.2001.tb03643.x. [DOI] [PubMed] [Google Scholar]
- 64.Lawrence MS, Sun GH, Kunis DM, et al. Overexpression of the glucose transporter gene with a herpes simplex viral vector protects striatal neurons against stroke. Journal of Cerebral Blood Flow and Metabolism. 1996;16(2):181–185. doi: 10.1097/00004647-199603000-00001. [DOI] [PubMed] [Google Scholar]
- 65.Lee WH, Bondy CA. Ischemic injury induces brain glucose transporter gene expression. Endocrinology. 1993;133(6):2540–2544. doi: 10.1210/endo.133.6.8243275. [DOI] [PubMed] [Google Scholar]
- 66.McCall AL, Van Bueren AM, Nipper V, Moholt-Siebert M, Downes H, Lessov N. Forebrain ischemia increases GLUT1 protein in brain microvessels and parenchyma. Journal of Cerebral Blood Flow and Metabolism. 1996;16(1):69–76. doi: 10.1097/00004647-199601000-00008. [DOI] [PubMed] [Google Scholar]
- 67.Vannucci SJ, Seaman LB, Vannucci RC. Effects of hypoxia-ischemia on GLUT1 and GLUT3 glucose transporters in immature rat brain. Journal of Cerebral Blood Flow and Metabolism. 1996;16(1):77–81. doi: 10.1097/00004647-199601000-00009. [DOI] [PubMed] [Google Scholar]
- 68.Li K, Vannucci SJ, Maher F, et al. GLUT5 microglial response in adult and immature rat brain following stroke. Society For Neuroscience Abstracts. 1996;22(1–3):p. 1423. [Google Scholar]
- 69.Greijer AE, van der Groep P, Kemming D, et al. Up-regualtion of gene expression by hypoxia is mediated predominantly by hypoxia-inducible factor I (HIF-I) Journal of Pathology. 2005;206(3):291–304. doi: 10.1002/path.1778. [DOI] [PubMed] [Google Scholar]
- 70.Southworth R. Hexokinase-mitochondrial interaction in cardiac tissue: implications for cardiac glucose uptake, the 18FDG lumped constant and cardiac protection. Journal of Bioenergetics and Biomembranes. 2009;41(2):187–193. doi: 10.1007/s10863-009-9207-9. [DOI] [PubMed] [Google Scholar]
- 71.Clanton TL, Klawitter PF. Physiological and genomic consequences of intermittent hypoxia: invited review: adaptive responses of skeletal muscle to intermittent hypoxia: the known and the unknown. Journal of Applied Physiology. 2001;90(6):2476–2487. doi: 10.1152/jappl.2001.90.6.2476. [DOI] [PubMed] [Google Scholar]
- 72.Malthankar-Phatak GH, Patel AB, Xia Y, et al. Effects of continuous hypoxia on energy metabolism in cultured cerebro-cortical neurons. Brain Research. 2008;1229(1):147–154. doi: 10.1016/j.brainres.2008.06.074. [DOI] [PMC free article] [PubMed] [Google Scholar]
- 73.Vannucci RC, Brucklacher RM, Vannucci SJ. Glycolysis and perinatal hypoxic-ischemic brain damage. Developmental Neuroscience. 2005;27(2–4):185–190. doi: 10.1159/000085991. [DOI] [PubMed] [Google Scholar]
- 74.Weinstein JR, Koerner IP, Moller T. Microglia in ischemic brain injury. Future Neurology. 2010;5(2):227–246. doi: 10.2217/fnl.10.1. [DOI] [PMC free article] [PubMed] [Google Scholar]
- 75.Lambertsen KL, Biber K, Finsen B. Inflammatory cytokines in experimental and human stroke. Journal of Cerebral Blood Flow & Metabolism. 2012;32(9):1677–1698. doi: 10.1038/jcbfm.2012.88. [DOI] [PMC free article] [PubMed] [Google Scholar]
- 76.Yamada S, Kubota K, Kubota R, Ido T, Tamahashi N. High accumulation of fluorine-18-fluorodeoxyglucose in turpentine-induced inflammatory tissue. Journal of Nuclear Medicine. 1995;36(7):1301–1306. [PubMed] [Google Scholar]
- 77.Sugawara Y, Gutowski TD, Fisher SJ, Brown RS, Wahl RL. Uptake of positron emission tomography tracers in experimental bacterial infections: a comparative biodistribution study of radiolabeled FDG, thymidine, L-methionine, 67Ga-citrate, and 125I-HSA. European Journal of Nuclear Medicine. 1999;26(4):333–341. doi: 10.1007/s002590050395. [DOI] [PubMed] [Google Scholar]
- 78.Kaim AH, Weber B, Kurrer MO, Gottschalk J, Von Schulthess GK, Buck A. Autoradiographic quantification of 18F-FDG uptake in experimental soft-tissue abscesses in rats. Radiology. 2002;223(2):446–451. doi: 10.1148/radiol.2232010914. [DOI] [PubMed] [Google Scholar]
- 79.Kubota K, Ito K, Morooka M, et al. FDG PET for rheumatoid arthritis: basic considerations and whole-body PET/CT. Annals of the New York Academy of Sciences. 2011;1228(1):29–38. doi: 10.1111/j.1749-6632.2011.06031.x. [DOI] [PubMed] [Google Scholar]
- 80.Yamashita K, Vogel P, Fritze K, Back T, Hossmann KA, Wiessner C. Monitoring the temporal and spatial activation pattern of astrocytes in focal cerebral ischemia using in situ hybridization of GFAP mRNA: comparison with sgp-2 and hsp70 mRNA and the effect of glutamate receptor antagonists. Brain Research. 1996;735(2):285–297. doi: 10.1016/0006-8993(96)00578-1. [DOI] [PubMed] [Google Scholar]
- 81.Mabuchi T, Kitagawa K, Ohtsuki T, et al. Contribution of microglia/macrophages to expansion of infarction and response of oligodendrocytes after focal cerebral ischemia in rats. Stroke. 2000;31(7):1735–1743. doi: 10.1161/01.str.31.7.1735. [DOI] [PubMed] [Google Scholar]
- 82.Schroeter M, Dennin MA, Walberer M, et al. Neuroinflammation extends brain tissue at risk to vital peri-infarct tissue: a double tracer [11C]PK11195- and [18F]FDG-PET study. Journal of Cerebral Blood Flow and Metabolism. 2009;29(6):1216–1225. doi: 10.1038/jcbfm.2009.36. [DOI] [PubMed] [Google Scholar]
- 83.Chuaqui R, Tapia J. Histologic assessment of the age of recent brain infarcts in man. Journal of Neuropathology and Experimental Neurology. 1993;52(5):481–489. doi: 10.1097/00005072-199309000-00006. [DOI] [PubMed] [Google Scholar]
- 84.Lindsberg PJ, Carpén O, Paetau A, Karjalainen-Lindsberg ML, Kaste M. Endothelial ICAM-1 expression associated with inflammatory cell response in human ischemic stroke. Circulation. 1996;94(5):939–945. doi: 10.1161/01.cir.94.5.939. [DOI] [PubMed] [Google Scholar]
- 85.Pozzilli C, Lenzi GL, Argentino C. Imaging of leukocytic infiltration in human cerebral infarcts. Stroke. 1985;16(2):251–255. doi: 10.1161/01.str.16.2.251. [DOI] [PubMed] [Google Scholar]
- 86.Akopov SE, Simonian NA, Grigorian GS. Dynamics of polymorphonuclear leukocyte accumulation in acute cerebral infarction and their correlation with brain tissue damage. Stroke. 1996;27(10):1739–1743. doi: 10.1161/01.str.27.10.1739. [DOI] [PubMed] [Google Scholar]
- 87.Gerhard A, Schwarz J, Myers R, Wise R, Banati RB. Evolution of microglial activation in patients after ischemic stroke: a [11C](R)-PK11195 PET study. NeuroImage. 2005;24(2):591–595. doi: 10.1016/j.neuroimage.2004.09.034. [DOI] [PubMed] [Google Scholar]
- 88.Price CJS, Wang D, Menon DK, et al. Intrinsic activated microglia map to the peri-infarct zone in the subacute phase of ischemic stroke. Stroke. 2006;37(7):1749–1753. doi: 10.1161/01.STR.0000226980.95389.0b. [DOI] [PubMed] [Google Scholar]
- 89.Syapin PJ, Skolnick P. Characterization of benzodiazepine binding sites in cultured cells of neural origin. Journal of Neurochemistry. 1979;32(3):1047–1051. doi: 10.1111/j.1471-4159.1979.tb04592.x. [DOI] [PubMed] [Google Scholar]
- 90.Canat X, Carayon P, Bouaboula M, et al. Distribution profile and properties of peripheral-type benzodiazepine receptors on human hemopoietic cells. Life Sciences. 1993;52(1):107–118. doi: 10.1016/0024-3205(93)90293-c. [DOI] [PubMed] [Google Scholar]
- 91.Hossmann KA. Periinfarct depolarizations. Cerebrovascular and Brain Metabolism Reviews. 1996;8(3):195–208. [PubMed] [Google Scholar]
- 92.Lauritzen M, Dreier JP, Fabricius M, Hartings JA, Graf R, Strong AJ. Clinical relevance of cortical spreading depression in neurological disorders: migraine, malignant stroke, subarachnoid and intracranial hemorrhage, and traumatic brain injury. Journal of Cerebral Blood Flow and Metabolism. 2011;31(1):17–35. doi: 10.1038/jcbfm.2010.191. [DOI] [PMC free article] [PubMed] [Google Scholar]
- 93.Somjen GG. Mechanisms of spreading depression and hypoxic spreading depression-like depolarization. Physiological Reviews. 2001;81(3):1065–1096. doi: 10.1152/physrev.2001.81.3.1065. [DOI] [PubMed] [Google Scholar]
- 94.Mies G, Iijima T, Hossmann KA. Correlation between peri-infarct DC shifts and ischaemic neuronal damage in rat. NeuroReport. 1993;4(6):709–711. doi: 10.1097/00001756-199306000-00027. [DOI] [PubMed] [Google Scholar]
- 95.Ohta K, Graf R, Rosner G, Heiss WD. Calcium ion transients in peri-infarct depolarizations may deteriorate ion homeostasis and expand infarction in focal cerebral ischemia in cats. Stroke. 2001;32(2):535–543. doi: 10.1161/01.str.32.2.535. [DOI] [PubMed] [Google Scholar]
- 96.Dohmen C, Sakowitz OW, Fabricius M, et al. Spreading depolarizations occur in human ischemic stroke with high incidence. Annals of Neurology. 2008;63(6):720–728. doi: 10.1002/ana.21390. [DOI] [PubMed] [Google Scholar]
- 97.Fabricius M, Fuhr S, Bhatia R, et al. Cortical spreading depression and peri-infarct depolarization in acutely injured human cerebral cortex. Brain. 2006;129(3):778–790. doi: 10.1093/brain/awh716. [DOI] [PubMed] [Google Scholar]
- 98.Fujita H, Zhang B, Sato K, Tanaka J, Sakanaka M. Expressions of neuropilin-1, neuropilin-2 and semaphorin 3A mRNA in the rat brain after middle cerebral artery occlusion. Brain Research. 2001;914(1-2):1–14. doi: 10.1016/s0006-8993(01)02765-2. [DOI] [PubMed] [Google Scholar]
- 99.Barde YA. Neurotrophins: a family of proteins supporting the survival of neurons. Progress in Clinical and Biological Research. 1994;390:45–56. [PubMed] [Google Scholar]
- 100.Sommer C, Kollmar R, Schwab S, Kiessling M, Schäbitz WR. Exogenous brain-derived neurotrophic factor prevents postischemic downregulation of [3H]muscimol binding to GABAA receptors in the cortical penumbra. Molecular Brain Research. 2003;111(1-2):24–30. doi: 10.1016/s0169-328x(02)00666-6. [DOI] [PubMed] [Google Scholar]
- 101.Ferrer I, Krupinski J, Goutan E, Martí E, Ambrosio S, Arenas E. Brain-derived neurotrophic factor reduces cortical cell death by ischemia after middle cerebral artery occlusion in the rat. Acta Neuropathologica. 2001;101(3):229–238. doi: 10.1007/s004010000268. [DOI] [PubMed] [Google Scholar]
- 102.Phelps ME. Positron computed tomography studies of cerebral glucose metabolism in man: theory and application in nuclear medicine. Seminars in Nuclear Medicine. 1981;11(1):32–49. doi: 10.1016/s0001-2998(81)80051-7. [DOI] [PubMed] [Google Scholar]
- 103.Nakai H, Yamamoto YL, Diksic M, Worsley KJ, Takara E. Triple-tracer autoradiography demonstrates effects of hyperglycemia on cerebral blood flow, pH, and glucose utilization in cerebral ischemia of rats. Stroke. 1988;19(6):764–772. doi: 10.1161/01.str.19.6.764. [DOI] [PubMed] [Google Scholar]
- 104.Noll T, Mühlensiepen H, Engels R, et al. A cell-culture reactor for the on-line evaluation of radiopharmaceuticals: evaluation of the lumped constant of FDG in human glioma cells. Journal of Nuclear Medicine. 2000;41(3):556–564. [PubMed] [Google Scholar]
- 105.Nakai H, Matsuda H, Takara E. Simultaneous in vivo measurement of lumped constant and rate constants in experimental cerebral ischemia using F-18 FDG. Stroke. 1987;18(1):158–167. doi: 10.1161/01.str.18.1.158. [DOI] [PubMed] [Google Scholar]
- 106.Shankar LK, Hoffman JM, Bacharach S, et al. Consensus recommendations for the use of 18F-FDG PET as an indicator of therapeutic response in patients in National Cancer Institute Trials. Journal of Nuclear Medicine. 2006;47(6):1059–1066. [PubMed] [Google Scholar]
- 107.Varrone A, Asenbaum S, Vander Borght T, et al. EANM procedure guidelines for PET brain imaging using [18F]FDG, version 2. European Journal of Nuclear Medicine and Molecular Imaging. 2009;36(12):2103–2110. doi: 10.1007/s00259-009-1264-0. [DOI] [PubMed] [Google Scholar]
- 108.Videen TO, Dunford-Shore JE, Diringer MN, Powers WJ. Correction for partial volume effects in regional blood flow measurements adjacent to hematomas in humans with intracerebral hemorrhage: implementation and validation. Journal of Computer Assisted Tomography. 1999;23(2):248–256. doi: 10.1097/00004728-199903000-00014. [DOI] [PubMed] [Google Scholar]
- 109.Melamed E. Reactive hyperglycaemia in patients with acute stroke. Journal of the Neurological Sciences. 1976;29(2–4):267–275. doi: 10.1016/0022-510x(76)90176-3. [DOI] [PubMed] [Google Scholar]
- 110.Thie JA, Smith GT, Hubner KF. 2-deoxy-2-[F-18]fluoro-D-glucose-positron emission tomography sensitivity to serum glucose: a survey and diagnostic applications. Molecular Imaging and Biology. 2005;7(5):361–368. doi: 10.1007/s11307-005-0018-z. [DOI] [PubMed] [Google Scholar]
- 111.Florence G, Guerit JM, Gueguen B. Electroencephalography (EEG) and somatosensory evoked potentials (SEP) to prevent cerebral ischaemia in the operating room. Neurophysiologie Clinique. 2004;34(1):17–32. doi: 10.1016/j.neucli.2004.01.001. [DOI] [PubMed] [Google Scholar]
- 112.Haupt WF, Horsch S. Evoked potential monitoring in carotid surgery: a review of 994 cases. Neurology. 1992;42(4):835–838. doi: 10.1212/wnl.42.4.835. [DOI] [PubMed] [Google Scholar]