Abstract
Study Objectives:
To assess the validity and efficacy of using electronic health data to identify a physician diagnosis of insomnia in a population of patients referred for testing at a tertiary sleep center.
Methods:
Retrospective cohort study in a tertiary sleep center in Calgary, Alberta, Canada. Cohort consisted of 1,207 patients referred for sleep diagnostic testing and/or assessment by a sleep physician. Two sleep physicians independently assigned each patient a primary sleep diagnosis. Univariate logistic regression was used to identify variables that were predictive for insomnia from online questionnaire and diagnostic testing data. Diagnostic algorithms derived from these predictors and from the Insomnia Severity Index were evaluated against physician diagnosis as a reference standard.
Results:
The combination of self-reported sleep latency > 20 minutes, total sleep time < 6.5 hours per night, the inability to fall asleep after waking, BMI < 27 kg/m2, and Epworth Sleepiness Scale score < 9 had very high specificity (99.3%) for diagnosing insomnia; however, sensitivity was poor (11.8%). Other algorithms derived from these data had either high sensitivity or high specificity. No combination of variables yielded simultaneous high sensitivity and specificity. Likewise, the Insomnia Severity Index can be highly sensitive or highly specific at identifying insomnia, but not both.
Conclusions:
Diagnostic algorithms derived from electronic data can provide high specificity or high sensitivity for identifying insomnia.
Citation:
Severson CA; Tsai WH; Ronksley PE; Pendharkar SR. Identification of insomnia in a sleep center population using electronic health data sources and the insomnia severity index. J Clin Sleep Med 2013;9(7):655-660.
Keywords: Insomnia, clinical prediction, decision rule, diagnostic algorithm
The prevalence of chronic insomnia is as high as 30%, but estimates range considerably, depending on the criteria used to define insomnia and the sample population used.1–3 Insomnia has also been associated with high levels of healthcare utilization, and increased direct and indirect healthcare costs. For instance, Ozminkowski et al.4 estimated that the combined direct and indirect costs over a 6-month time-period for adults in the U.S. with insomnia were, per person, $1253.00 more than matched controls. Similarly, Morin et al.5 estimated the cumulative costs of insomnia in the Canadian province of Quebec (population approximately 8 million6) to exceed six billion dollars (Cdn) per annum.
A diagnosis of insomnia is typically established through assessment by an experienced clinician. Several efficacious treatments for insomnia, such as cognitive behavioral therapy (CBT), exist. Yet wait times and lack of access to insomnia specialists can be a barrier to diagnosis and treatment. Moreover, insomnia may occur independently, or may coexist with other sleep disorders, which can complicate diagnosis and treatment. Screening tools that can accurately and reliably identify primary insomnia could help from a triage standpoint, as they may direct newly referred patients to the appropriate specialists and/ or diagnostic testing. In a research setting, an insomnia screening tool would be desirable for case finding. While a breadth of insomnia questionnaires and screening tools exist, most of these tools were developed for use in large epidemiologic studies and lack validation in a clinic setting. Moreover, very few have used a clinician defined reference standard for insomnia.7–9
BRIEF SUMMARY
Current knowledge/Study Rationale: While a breadth of insomnia questionnaires and screening tools exist, most of these tools were developed for use in large epidemiologic studies and lack validation in a clinic setting. We sought to assess the validity of using electronic health data for identifying patients with insomnia in a tertiary sleep centre.
Study Impact: Diagnostic algorithms derived from electronic data can provide high specificity or high sensitivity for identifying insomnia. When used to direct patients to the correct provider, or to preclude the need for polysomnography, this could have significant impact on centralized triage processes, clinician decision support, and healthcare costs.
The aim of this study was to assess the validity and efficacy of using electronic health data to identify a physician diagnosis of insomnia in a population of patients referred for testing at a tertiary sleep center.
METHODS
Patients
We identified all patients who completed an online questionnaire and underwent clinical assessment and/or sleep diagnostic testing at the Foothills Medical Center (FMC) Sleep Center between January 1, 2009, and January 1, 2011. The FMC Sleep Center is the only tertiary referral center for Calgary, Alberta, Canada (a catchment area of approximately 1.3 million people). The referral base consists primarily of family physicians, but also includes physicians from other disciplines. All referred patients are required to fill out the online questionnaire at the time of referral. The University of Calgary Conjoint Health Region Ethics Board approved this study.
Determination of Primary Diagnosis
Insomnia
Two American Academy of Sleep Medicine board-certified sleep physicians independently reviewed all patient charts and assigned a primary sleep diagnosis to each patient in the cohort. Insomnia was defined based on either: (a) primary clinical diagnosis by the treating clinician (if treating clinician was ABSM certified in Behavioral Sleep Medicine); (b) primary clinical diagnosis of insomnia by the treating physician AND a chart review of the patient history to determine if patient met International Classification of Sleep Disorders, 2nd edition (ICSD-2), criteria A-C (if the treating clinician was not an ABSM certified psychologist). Primary insomnia was determined to be present if there was consensus from both reviewing physicians on the diagnosis. If a diagnosis could not be agreed upon, the disagreement was noted and the patient was excluded from analysis.
Other
A total of 13 other diagnostic categories were selected prior to chart review. Eight diagnoses were developed based on the ICSD-2 criteria: central sleep apnea (CSA); central nervous system (CNS) hypersomnolence; insomnia; obstructive sleep apnea syndrome (OSAS); parasomnia; restless leg syndrome (RLS); OSA/hypoventilation; and upper airway resistance syndrome (UARS). Diagnoses were assigned based on a primary diagnosis by the treating physician AND chart review of the history and diagnostic testing (to ensure that ICSD-2 criteria were met).
Six non-ICSD-2 diagnoses were also assigned: depression, fatigue, uncomplicated snoring, fibromyalgia, other, and normal. Given that validated criteria for many of these diagnoses could not be consistently extracted from the medical record, for non-ICSD-2 diagnosis a diagnosis was assigned based on the primary impression of the treating physician. Disease specific diagnostic criteria were not employed for non-ICSD-2 diagnoses.
Electronic Data Elements
Online Questionnaire
The online questionnaire is composed of 108 questions, which provide a comprehensive overview of a patient's demographics, anthropometrics, snoring history, daytime function, and medical history, as well as sleep schedule, behavior, and complaints. Three smaller, commonly used questionnaires are also administered within the online questionnaire: the Epworth Sleepiness Scale (ESS), Patient Health Questionnaire (PHQ), and the Insomnia Severity Index (ISI).
Ambulatory Monitoring
All patients undergo portable monitoring (level III sleep diagnostic testing) as part of the referral and triage process. The Remmers Sleep Recorder (SagaTech Electronics Ltd, Calgary, Canada) is an ambulatory monitor that measures snoring, oxygen saturation, respiratory airflow (by monitoring nasal pressure), and body position. The RDI is derived from automated analysis of the oximetry signal using a 4% desaturation threshold. This algorithm uses both shape and magnitude of oxygen desaturation to score respiratory events.10 Ambulatory studies are manually reviewed by the interpreting physician with the flow signal being used for quality assurance purposes. Ambulatory studies are repeated if there are discrepancies between the automatically scored respiratory events and the airflow channel. This monitor has excellent agreement with the polysomnographically determined AHI.10 It has also been validated as a clinical management tool.11,12
Polysomnography
Polysomnography was ordered at the discretion of the treating physician. Polysomnography (PSG) data were recorded by a computerized system (Sandman Elite Version 8.0, Nellcor Puritan Bennett [Melville] Ltd, Kanata, Ontario, Canada). This included a standardized montage: 3 electroencephalographic channels (C4/A1, C3/A2, O1/A2), bilateral electroculograms (EOG), submental electromyogram (EMG), bilateral leg EMGs, and electrocardiography (ECG). Airflow was measured using a nasal pressure transducer (Braebon Medical Corp, Ontario, Canada). Respiratory effort was assessed by inductance plethysmography (Respitrace Ambulatory Monitoring, Ardsley, NY USA), and oxygen saturation was recorded by oximetry (953 Finger Flex Sensor; Healthdyne Technologies). The RDI was defined as the number of apneas and hypopneas/h of sleep. Apnea was defined as a cessation of airflow ≥ 10 seconds. Hypopnea was defined as an abnormal respiratory event lasting ≥ 10 sec, with ≥ 30% reduction in thorocoabdominal movement or airflow compared to baseline and associated with ≥ 4% oxygen desaturation.
Statistics
The agreement in physician-assigned diagnoses was assessed by the κ statistic. Simple logistic regression was used to identify predictive variables from the online questionnaire, using the presence of insomnia as the dependent variable. Receiver operator characteristic curves and box plots were used to visually select binary cutpoints for predictive continuous variables. A full model was constructed from univariate binary predictors and reduced by stepwise regression. Diagnostic algorithms were constructed from predictive variables in the parsimonious model. Sensitivity, specificity, positive predictive value, and negative predictive value were determined for each diagnostic algorithm as well as for the ISI.
All analyses were performed using STATA 9.0 statistical software (Stata Corporation, College Station, TX). Results are presented as mean ± standard deviation unless otherwise stated. An α value of 0.05 was used for all significance calculations.
RESULTS
Patient Characteristics
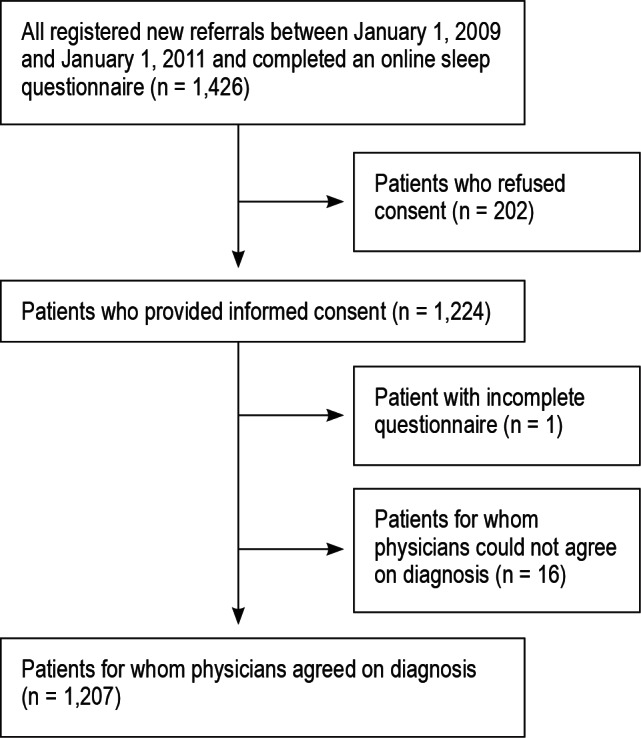
Figure 1 illustrates the flow of patients. We identified 1,426 patients who underwent clinical assessment with or without sleep diagnostic testing; 202 did not provide written consent and were excluded. Of the remaining 1,223 patient charts, 16 were excluded from the analysis due to lack of consensus over the primary sleep diagnosis, leaving a final cohort size of 1,207.
Figure 1. Patient flow.
Insomnia was the primary diagnosis in 339 patients (28%). Tables 1 and 2 summarize the distribution of sleep diagnoses and baseline characteristics of the cohort. The mean age in the entire cohort was 45.4 ± 12.1 years, 56.8% were men, and mean body mass index (BMI) was 30.6 ± 7.6 kg/m2. The mean ESS and ISI scores of all patients were 11.1 ± 5.7 and 3.0 ± 6.8, respectively. The mean self-reported sleep latency for all patients was 0.47 ± 0.72 hours.
Table 1.
Sleep diagnosis
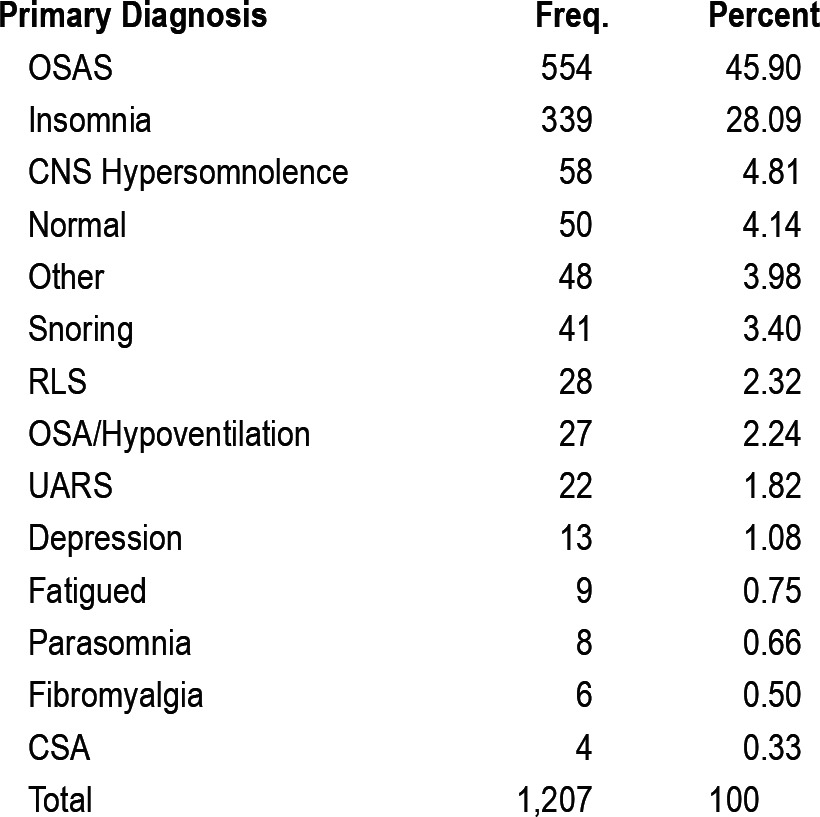
Table 2.
Patient characteristics
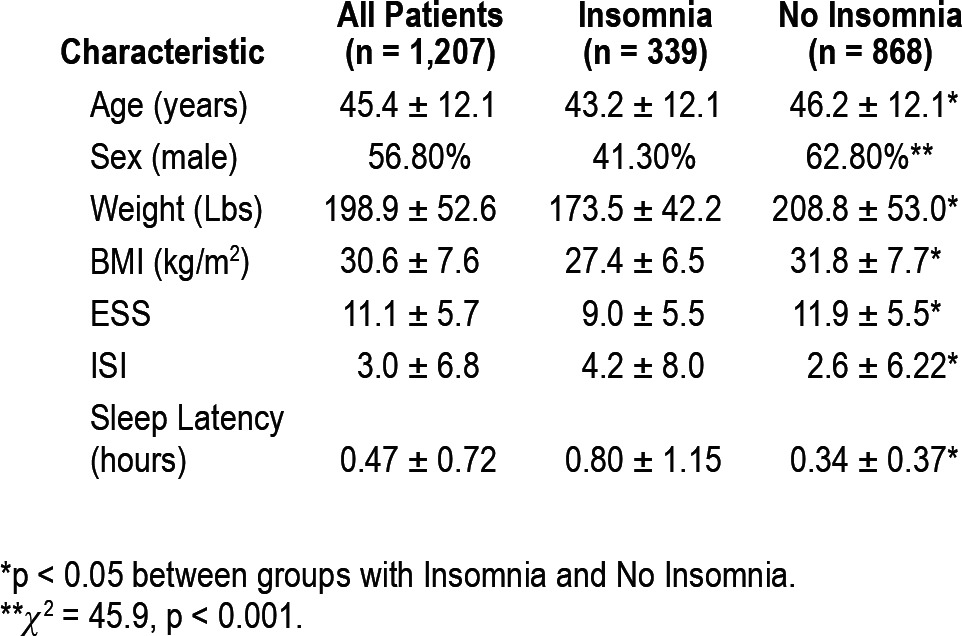
Patients with insomnia were significantly younger and had lower BMI, weight, and ESS scores than patients without insomnia. Patients with insomnia reported taking longer to fall asleep and had higher ISI scores than patients without a diagnosis of insomnia.
Diagnostic Agreement
Physicians agreed on 98.69% of assigned diagnoses (1,207/1,223). The un-weighted κ statistic was 0.98 (± 0.016).
Univariate Predictors of Insomnia
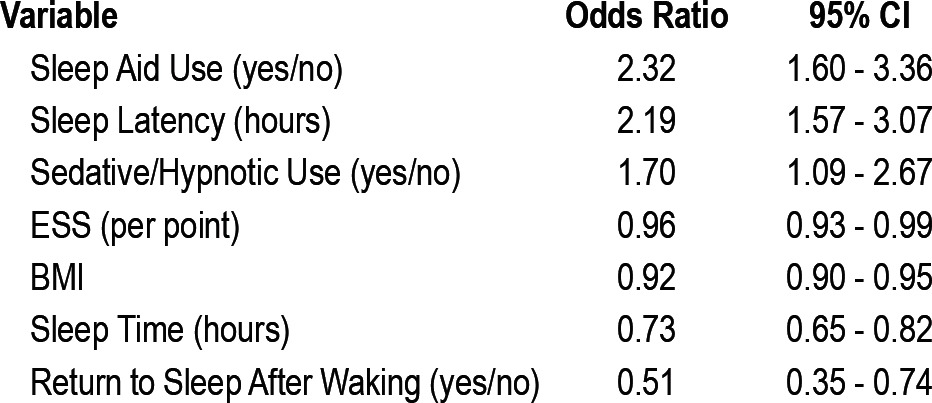
Self-reported use of a sleep aid, sleep latency (measured in hours), and sedative/hypnotic use were predictive of a diagnosis of insomnia (Table 3). The Epworth score, BMI, average sleep time, and ability to return to sleep after waking during the night were predictive of a diagnosis other than insomnia. The following binary cutoffs for continuous predictive variables were selected from ROC curves and box plots: sleep latency (20 min), sleep time (6.5 h), BMI (27 kg/m2), and ESS (9/24).
Table 3.
Univariate predictors
Algorithm Performance
Diagnostic algorithm performance is summarized in Table 4. The combination of self-reporting a sleep latency > 20 min, sleep time < 6.5 h sleep/night, inability to fall asleep after waking, a BMI < 27, and ESS score < 9 had very high specificity (99.3%) for a diagnosis of insomnia; however, sensitivity was poor (11.8%). Similarly, a self-reported sleep time < 6.5 h with concomitant sedative/hypnotic use had a high specificity (96.7%) at the expense of sensitivity (18.6%). No combination of variables simultaneously had a high sensitivity and specificity. A model incorporating the use of a sedative/hypnotic or a reported sleep time < 6.5 h maximized diagnostic performance (sensitivity 71.4%, specificity 67.4%, positive predictive value 46.1%, negative predictive value 85.8%).
Table 4.
Performance of Diagnostic Algorithms
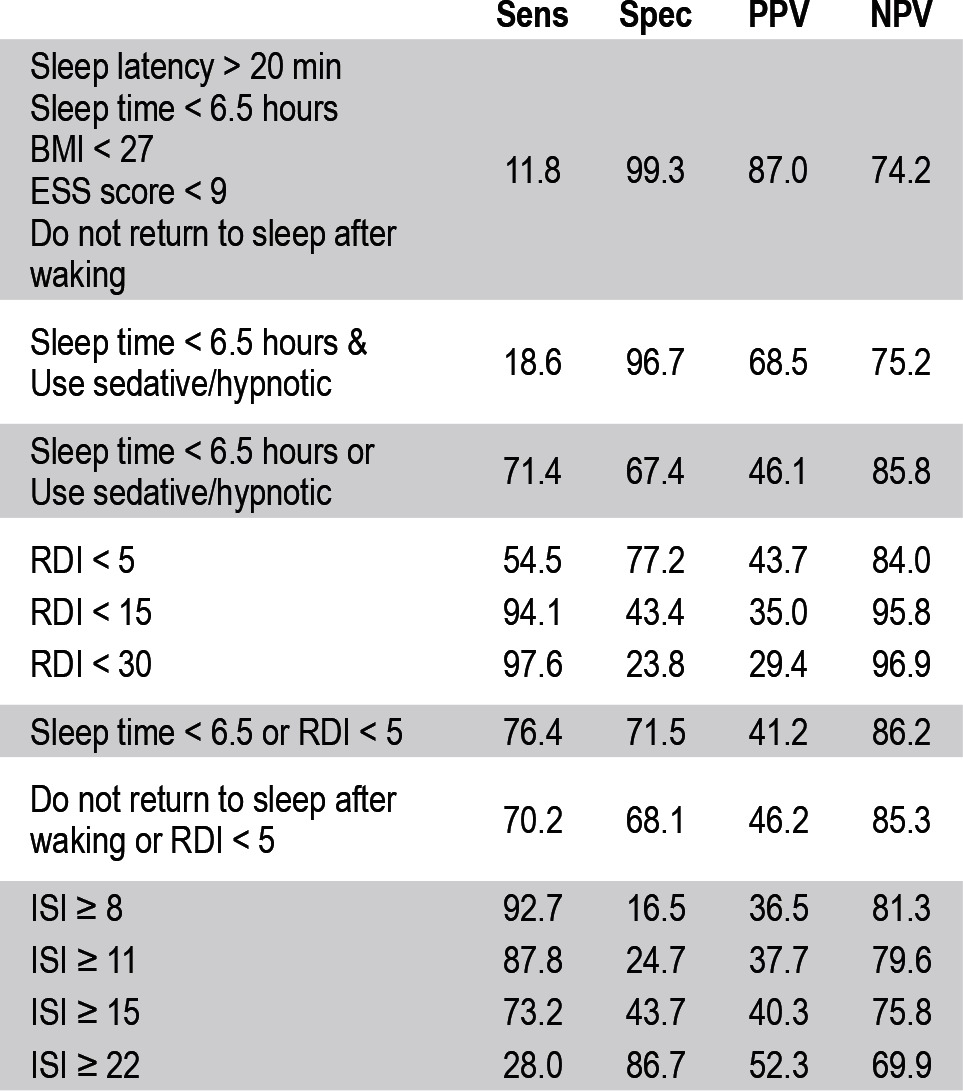
The combination of clinical and diagnostic test data did not improve diagnostic performance when compared to clinical data alone. For instance, using a self-reported sleep time < 6.5 h and an RDI < 5 yields moderate sensitivity (76.4%) and specificity (71.5%). The inability to fall asleep after waking and an RDI < 5 yields similar levels of sensitivity (70.2%) and specificity (68.1%).
The diagnostic performance of the Insomnia Severity Index (ISI) is also summarized in Table 3. In our clinic population, the ISI demonstrated either high sensitivity or specificity, but not both. An ISI score ≥ 8 demonstrates the highest sensitivity (92.7%) that could be achieved using ISI data alone; however specificity was poor (16.5%). An ISI score ≥ 22 yields the maximum specificity that could be achieved with the ISI alone (86.7%), but at the expense of sensitivity (28.0%). No single ISI cutoff resulted in simultaneously high sensitivity and specificity.
DISCUSSION
To the best of our knowledge, this is the first study to validate diagnostic algorithms using electronic health data in a clinic-based population. Diagnostic algorithms using electronic health data from an online questionnaire can achieve high sensitivities or specificities for identifying insomnia, but not both. A high diagnostic specificity can be achieved using a self-reported sleep latency of greater than 20 minutes, estimated sleep time of less than 6.5 hours, inability to fall asleep after waking, BMI of less than 27 kg/m2, and an ESS score of less than 9 (sensitivity 12%, specificity 99%). Similar results could be achieved with a combination of self-reported sleep time of less than 6.5 hours and sedative or hypnotic use (sensitivity 19%, specificity 97%). Although lacking simultaneously high sensitivities and specificities, these diagnostic algorithms provide a simple and highly accurate method of identifying at least a subset of patients with and without insomnia.
Only two published questionnaire-based tools have been developed to differentiate between insomnia and other sleep disorders in a sleep clinic population: the Global Sleep Assessment Questionnaire (GSAQ) and the Holland Sleep Disorders Questionnaire (HSDQ).13,14 When administered to a combination of primary care and sleep clinic patients, the 11-item GSAQ could discriminate between insomnia and other sleep disorders (as diagnosed by a sleep clinician) with a sensitivity of 79% and a specificity of 57%.13 The aim of the HSDQ is to assess the six different groups of sleep disorders as defined by ICSD-2 criteria (sleep-related breathing disorder, hypersomnia, circadian rhythm sleeping disorder, parasomnias, sleep related movement disorders, and insomnia). When administered to a population of 891 patients referred for testing to a sleep center in Holland, their 40-item questionnaire had an optimized sensitivity of 82% and optimized specificity of 69% at differentiating between insomnia and the other five classes of sleep disorders.14 While both of these questionnaires have moderate levels of combined sensitivity and specificity, neither measure is maximized.
The Insomnia Severity Index is a brief, well-validated questionnaire designed to assess insomnia severity and outcomes.15–18 Morin et al. examined the ability of the ISI to identify insomnia in a clinical population, demonstrating that the ISI could identify patients with physician-diagnosed insomnia with high sensitivity and specificity: an ISI score ≥ 11 yielded a sensitivity and specificity of 92.7% and 100%, respectively.15 However, in our clinic-based population, the ISI did not achieve simultaneously high sensitivity and specificity. The differences in ISI performance can likely be attributed to the different populations. Though both studies used similarly rigorous definitions of insomnia, Morin et al. looked at the ability of the ISI to identify patients with insomnia when comparing those patients to a cohort of healthy controls, whereas we examined the ability of the ISI to identify patients with insomnia in patients who were referred to a sleep center. Given the overlap in comorbidity and symptoms between different sleep disorders, it is not surprising that shared symptoms dilute the diagnostic accuracy of any screening instrument.
The GSAQ, HSDQ, and our data present similarly moderate measures of combined sensitivity and specificity. Additionally though, we present algorithms to maximize either measure on their own. This is important, as there are situations when a high sensitivity or specificity is desirable even if the reciprocal measure is lower. For instance, practice parameters suggest that polysomnography is not necessary for the routine assessment and diagnosis of insomnia.19 Highly specific algorithms that rule in a diagnosis of insomnia may reduce the need for polysomnography in patients positively identified by the algorithm. Given the cost of polysomnography, the identification of even a small subset of patients as not needing PSG could lead to large healthcare and insurance savings. However, polysomnography would still be required in patients with persistent symptoms despite primary management or in some patients for whom sleep disordered breathing has not been ruled out. Conversely, highly sensitive algorithms allow us to confidently rule out a diagnosis, which could help us direct patients to the correct provider and thus improve clinic efficiency. Highly sensitive or specific algorithms are also important in a research setting as they are used in identifying cohorts, validating comorbidities and monitoring prevalence and incidence, for example.
The use of an online questionnaire or electronic health data is compelling both in terms of potential for scalability and resource demands for data acquisition and analysis. For instance, questionnaires can be disseminated to large numbers of patients or study cohorts simply by providing a link or web address. Furthermore, the collection and storage of responses in a structured and computable manner facilitates linkage to existing clinical databases. Electronic algorithms can also be easily integrated with well-structured electronic databases, allowing for several potential uses. In a triage setting, for example, such algorithms could be implemented to automatically classify patients and alert triage nurses to this identification. From a research perspective, diagnostic algorithms can be used to rapidly query massive datasets to find large samples for study inclusion. As an example, case finding algorithms to identify outbreaks of influenza have been previously reported and show the potential use of electronic health data sources for this purpose.20
We suggest that using highly sensitive or specific algorithms has the potential to improve clinical efficiency by identifying subsets of patients and directing them to the correct provider or clinical test. However, the ability of electronic algorithms to improve clinical efficiency is largely unexamined in the literature. A recent study by Stein et al.21 used brief self-reported electronic questionnaires delivered via a computer kiosk to help assess and treat women presenting to the emergency department for urinary tract infections. These investigators found that patients randomized to use this system had shorter lengths of stay in the emergency department than patients who continued via regular clinical pathways. Though not implementing a diagnostic algorithm electronically, the results of Stein et al. suggest that implementation of electronic questionnaires have potential to improve clinical efficiency. Further research is necessary to assess and quantify how electronic algorithms may improve efficiency and patient flow in a clinical setting.
Our results should be interpreted within the context of the strengths and limitations of our study. Firstly, our cohort was selected from referrals to a single academic sleep center. There are only a few other referral choices for sleep medicine in our catchment area, and there is no incentive for referring physicians to choose one center over the other. This fact, coupled with our large sample size, low exclusion rate, and the consistency of our cohort's demographic characteristics with those of other referral populations, suggest that selection bias due to a single center is not a concern.
Secondly, it should be noted that a clinical interview was not part of the diagnosis process. However, to ensure the integrity of our reference standard, diagnoses were assigned through independent chart review and required consensus by two board-certified sleep physicians. The strength of our reference standard is reflected in the high κ score and percent agreement between the two raters (0.98 (± 0.016) and 98.69%, respectively).
Finally, although all patients underwent level III sleep diagnostic testing, polysomnography was at the discretion of the treating physician. Given the use of ambulatory monitoring, it is unlikely that sleep disordered breathing would be missed. However, non-respiratory ICSD-2 polysomnographically based diagnoses could be missed, if not initially suspected by the treating clinician. Moreover, non-ICSD-2 diagnoses were assigned based on the impression of the treating clinician and may not necessarily be valid.
CONCLUSION
Diagnostic algorithms derived from electronic data can provide high specificity or high sensitivity for identifying insomnia. While it is not feasible to simultaneously achieve both high sensitivity and specificity using these data, it is possible to simply and accurately identify a subset of patients with and without insomnia using only a few simple questions extracted from online and/or electronic sources. When used to direct patients to the correct provider, or to preclude the need for polysomnography, this could have significant impact on centralized triage processes, clinician decision support, and healthcare costs. Furthermore, these algorithms can be used in a research capacity to identify cohorts and monitor prevalence and incidence, among other uses. Towards these ends, the ability of these algorithms to improve clinic efficiency and decision support, and their uses in a research setting warrant further study and validation.
DISCLOSURE STATEMENT
This was not an industry supported study. The authors have indicated no financial conflicts of interest.
ACKNOWLEDGMENTS
This work was supported through funding from the O'Brien Center for the Health Sciences and the FMC Sleep Centre Development Fund.
REFERENCES
- 1.Ohayon MM. Epidemiology of insomnia: what we know and what we still need to learn. Sleep Med Rev. 2002;6:97–111. doi: 10.1053/smrv.2002.0186. [DOI] [PubMed] [Google Scholar]
- 2.Ohayon MM, Reynolds CF. Epidemiological and clinical relevance of insomnia diagnosis algorithms according to the DSM-IV and the International Classification of Sleep Disorders (ICSD) Sleep Med. 2009;10:952–60. doi: 10.1016/j.sleep.2009.07.008. [DOI] [PMC free article] [PubMed] [Google Scholar]
- 3.Morin CM, LeBlanc M, Bélanger L, Ivers H, Mérette C, Savard J. Prevalence of insomnia and its treatment in Canada. Can J Psychiatry. 2011;56:540–8. doi: 10.1177/070674371105600905. [DOI] [PubMed] [Google Scholar]
- 4.Ozminkowski R, Wang S, Walsh J. The direct and indirect costs of untreated insomnia in adults in the United States. Sleep. 2007;30:263–73. doi: 10.1093/sleep/30.3.263. [DOI] [PubMed] [Google Scholar]
- 5.Daley M, Morin CM, LeBlanc M, Grégoire J-P, Savard J. The economic burden of insomnia: direct and indirect costs for individuals with insomnia syndrome, insomnia symptoms, and good sleepers. Sleep. 2009;32:55–64. [PMC free article] [PubMed] [Google Scholar]
- 6.Canada S. Population by sex and age group, by province and territory. [Internet]. 2011 [cited 2012 Sep 13] Available from: http://www.statcan.gc.ca/tables-tableaux/sum-som/l01/cst01/demo31a-eng.htm.
- 7.Novak M, Mucsi I, Shapiro CM, Rethelyi J, Kopp MS. Increased utilization of health services by insomniacs-an epidemiological perspective. J Psychosom Res. 2004;56:527–36. doi: 10.1016/j.jpsychores.2004.02.007. [DOI] [PubMed] [Google Scholar]
- 8.Kessler R, Berglund P, Coulouvrat C. Insomnia and the performance of US workers: results from the America insomnia survey. Sleep. 2011;34:1161–71. doi: 10.5665/SLEEP.1230. [DOI] [PMC free article] [PubMed] [Google Scholar]
- 9.Morin CM, LeBlanc M, Daley M, Gregoire JP, Mérette C. Epidemiology of insomnia: prevalence, self-help treatments, consultations, and determinants of help-seeking behaviors. Sleep Med. 2006;7:123–30. doi: 10.1016/j.sleep.2005.08.008. [DOI] [PubMed] [Google Scholar]
- 10.Vázquez JC, Tsai WH, Flemons WW, et al. Automated analysis of digital oximetry in the diagnosis of obstructive sleep apnoea. Thorax. 2000;55:302–7. doi: 10.1136/thorax.55.4.302. [DOI] [PMC free article] [PubMed] [Google Scholar]
- 11.Mulgrew A, Fox N, Ayas N, Ryan C. Diagnosis and initial management of obstructive sleep apnea without polysomnography. Ann Intern Med. 2007;146:157–66. doi: 10.7326/0003-4819-146-3-200702060-00004. [DOI] [PubMed] [Google Scholar]
- 12.Whitelaw WA, Brant RF, Flemons WW. Clinical usefulness of home oximetry compared with polysomnography for assessment of sleep apnea. Am J Respir Crit Care Med. 2005;171:188–93. doi: 10.1164/rccm.200310-1360OC. [DOI] [PubMed] [Google Scholar]
- 13.Roth T, Zammit G, Kushida C, et al. A new questionnaire to detect sleep disorders. Sleep Med. 2002;3:99–108. doi: 10.1016/s1389-9457(01)00131-9. [DOI] [PubMed] [Google Scholar]
- 14.Kerkhof GA, Geuke ME, Brouwer A, Rijsman RM, Schimsheimer RJ, Van Kasteel V. Holland Sleep Disorders Questionnaire: a new sleep disorders questionnaire based on the International Classification of Sleep Disorders-2. J Sleep Res. 2013;22:104–7. doi: 10.1111/j.1365-2869.2012.01041.x. [DOI] [PubMed] [Google Scholar]
- 15.Morin CM, Belleville G, Bélanger L, Ivers H. The Insomnia Severity Index: psychometric indicators to detect insomnia cases and evaluate treatment response. Sleep. 2011;34:601–8. doi: 10.1093/sleep/34.5.601. [DOI] [PMC free article] [PubMed] [Google Scholar]
- 16.Okun ML, Kravitz HM, Sowers MF, Moul DE, Buysse DJ, Hall M. Psychometric evaluation of the Insomnia Symptom Questionnaire: a self-report measure to identify chronic insomnia. J Clin Sleep Med. 2009;5:41–51. [PMC free article] [PubMed] [Google Scholar]
- 17.Yang M, Morin CM, Wallenstein G V. Original article Interpreting score differences in the Insomnia Severity Index: using health-related outcomes to define the minimally important difference. Curr Med Res Opin. 2009;25:2487–94. doi: 10.1185/03007990903167415. [DOI] [PubMed] [Google Scholar]
- 18.Thorndike FP, Ritterband LM, Saylor DK, Magee JC, Gonder-Frederick LA, Morin CM. Validation of the Insomnia Severity Index as a Web-Based Measure. Behav Sleep Med. 2011;9:216–23. doi: 10.1080/15402002.2011.606766. [DOI] [PubMed] [Google Scholar]
- 19.Littner M, Hirshkowitz M, Kramer M, et al. Practice parameters for using polysomnography to evaluate insomnia: an update. Sleep. 2003;26:754–60. doi: 10.1093/sleep/26.6.754. [DOI] [PubMed] [Google Scholar]
- 20.DeLisle S, South B, Anthony JA, et al. Combining free text and structured electronic medical record entries to detect acute respiratory infections. PloS One. 2010;5:e13377. doi: 10.1371/journal.pone.0013377. [DOI] [PMC free article] [PubMed] [Google Scholar]
- 21.Stein JC, Navab B, Frazee B, et al. A randomized trial of computer kiosk-expedited management of cystitis in the emergency department. Acad Emer Med. 2011;18:1053–9. doi: 10.1111/j.1553-2712.2011.01167.x. [DOI] [PubMed] [Google Scholar]


