

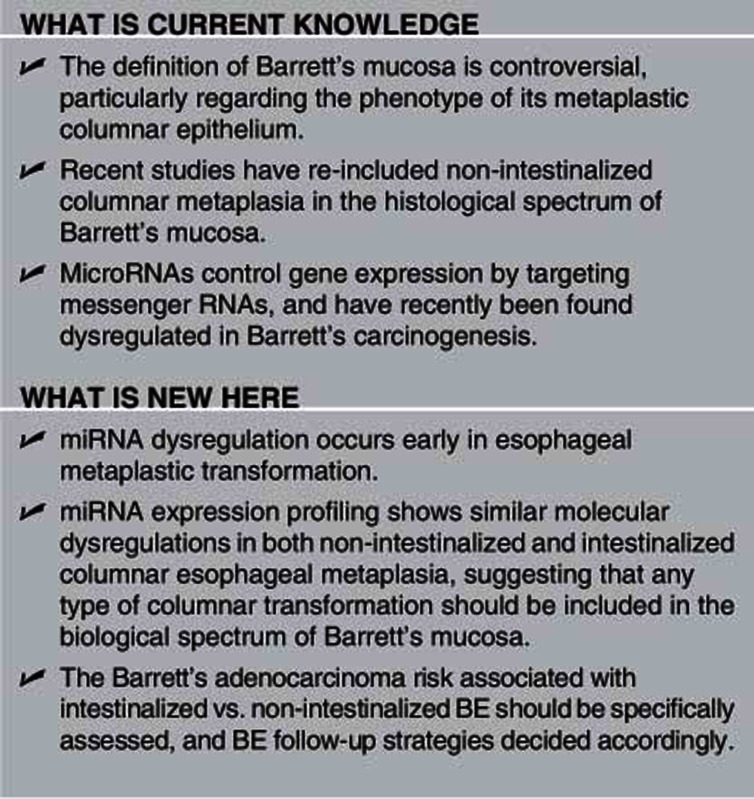
Abstract
OBJECTIVES:
The histological definition of Barrett's esophagus (BE) is debated, particularly regarding the phenotype of its metaplastic columnar epithelium. Histologically proven intestinal metaplasia (IM) was the sine qua non condition for a diagnosis of BE but, more recently, non-intestinalized (i.e., cardiac gastric-type; GM) columnar metaplasia has been re-included in the spectrum of Barrett's histology. MicroRNAs modulate cell commitment, and are also reportedly dysregulated in Barrett's carcinogenesis. This study investigates miRNA expression in the histological spectrum of esophageal columnar metaplastic changes, specifically addressing the biological profile of GM vs. IM.
METHODS:
A study was performed to discover microRNA microarray in 30 matching mucosa samples obtained from 10 consecutive BE patients; for each patient, biopsy tissue samples were obtained from squamous, GM and intestinalized epithelium. Microarray findings were further validated by qRT-PCR analysis in another bioptic series of 75 mucosa samples.
RESULTS:
MicroRNA profiling consistently disclosed metaplasia-specific microRNA signatures. Six microRNAs were significantly dysregulated across the histological phenotypes considered; five of them (two overexpressed (hsa-miR-192; -miR-215) and three under-expressed (hsa-miR-18a* -miR-203, and -miR-205)) were progressively dysregulated in the phenotypic sequence from squamous to gastric-type, to intestinal-type mucosa samples.
CONCLUSIONS:
A consistent microRNA expression signature underlies both gastric- and intestinal-type esophageal metaplasia. The pattern of microRNA dysregulation suggests that GM may further progress to IM. The clinico-pathological implications of these molecular profiles prompt further study on the “personalized” cancer risk associated with each of these metaplastic transformations.
INTRODUCTION
Barrett's esophagus (BE) is defined as the metaplastic replacement of native esophageal squamous mucosa by columnar epithelia.1, 2 The columnar esophageal metaplasia is considered the “cancerization field” in which esophageal Barrett's adenocarcinoma develops.3, 4, 5
The clinico-pathological definition of BE is widely disputed.6, 7, 8, 9 Based on its original description, BE should include any replacement of native esophageal epithelium by glandular mucosa.10 The elective link between the prevalence of intestinal metaplasia (IM) and the risk of Barrett's adenocarcinoma has since led the definition of BE to be operatively restricted to columnar intestinal-type metaplasia alone.11, 12 On the other hand, recent evidence of “a close relationship between esophageal adenocarcinoma and cardiac-type mucosa” would support a histogenetic role for non-intestinalized epithelia in Barrett's carcinogenesis as well, meaning that columnar, non-intestinalized metaplasia should be re-included in the spectrum of Barrett's disease.13, 14, 15
These conflicting definitions of BE are not just a matter of semantics: any inconsistencies in the disease's histological assessment result in major variations in the estimates of its incidence, and this ultimately affects the cost-benefit balance of any Barrett's adenocarcinoma secondary prevention strategy.16
MicroRNAs (miRNAs or miR) are a class of short non-coding RNAs involved in modulating gene expression by targeting messenger RNAs (mRNAs). Depending on their complementarity with target mRNAs, miRNAs can either block their translation or hasten their degradation.17, 18, 19
Several reports point to miRNAs as molecules involved in each step of Barrett's carcinogenesis,17, 19, 20, 21, 22, 23, 24, 25 but no studies have so far provided any comprehensive miRNA expression profiling in esophageal intestinalized vs. non-intestinalized columnar metaplasia. This study aimed to further characterize the molecular profile of the different metaplastic phenotypes considered candidates for inclusion in the spectrum of Barrett's mucosa.
MATERIALS AND METHODS
Patients
The cases considered in the present study were collected retrospectively from the files of the Veneto Region's multicenter Barrett's Esophagus Registry (EBRA (www.esofagodibarrett.it); Padua Unit, Surgical Pathology and Cytopathology Unit at Padua University).26 All patients had endoscopically confirmed ≥3 cm long segments of columnar metaplasia in the distal esophagus and had undergone endoscopy/biopsy according to the Seattle protocol (i.e., four-quadrant biopsies obtained from every 2 cm of metaplastic mucosa).27 Only patients whose non-intestinalized and intestinalized metaplastic lesions coexisted within the same quadrant were considered; mosaic patterns of BE were excluded. No cases of epithelial dysplasia/neoplasia, or cases obtained from patients being followed-up endoscopically for epithelial dysplasia/neoplasia, were considered. The institute's ethical regulations concerning research on human tissues were followed. Original slides or serial sections (4–6 μm thick) obtained from archival paraffin-embedded tissue samples (H&E, Alcian-PAS) were jointly re-assessed by two pathologists (MF and MP); where their opinions differed, a third GI-specialist pathologist (MR) was consulted.
Histopathology
Metaplastic lesions were classified as non-intestinalized or intestinalized based on the presence of goblet cells, assessed by Alcian-PAS staining.
Non-intestinalized metaplastic lesions were further classified as follows:
cardiac gastric-type (GM), when only non-goblet mucosecreting columnar cells were found at histology;
oxyntic-type, when the histological phenotype was that of native corpus/fundus gastric glands. These lesions are currently considered as “inlet patches” of oxyntic ectopia, and were excluded for the purposes of the present study;8
multilayered epithelium (MLE), defined as multilayered, flattened squamoid epithelium overlaid by columnar mucus-producing, non-intestinalized cells. It has been suggested that this lesion is a putative early stage in the development of BE.28
Depending on goblet cells' density, cases of intestinalized metaplasia were further classified as having a low goblet density (IM +/−=intestinal commitment in <50% of glandular structures) or high goblet density (IM=intestinal commitment in >50% of glandular structures).14, 15
Sample selection
A total of 105 mucosa samples obtained at biopsy from 58 BE patients (age 64.2±8.5 years, range 54–77; all Caucasian males) were considered, and used as shown in Table 1.
Table 1. Schematic diagram of the present study.
| Discovery set | Validation set |
|---|---|
| miRNA Microarray Study (326 miRNA genes) | qRT-PCR Study (7 miRNA genes) |
| 10 Long-segment BE patients (Number of biopsy samples considered per patient) | 48 Long-segment BE patients (Number of biopsy samples collected from the series considered) |
| 1 Biopsy sample of squamous epithelium (≥3 cm away from any type of metaplastic mucosa) | 15 Biopsy samples of squamous epithelium (≥3 cm away from any type of metaplastic mucosa) |
| 15 Biopsy samples of multilayered epithelium | |
| 1 Biopsy sample of gastric-type mucosa (≥2 cm away from the GEJ) | 15 Biopsy samples of gastric-type mucosa (≥2 cm away from the GEJ) |
| 15 Biopsy samples of intestinalized mucosa with a low goblet cell density (IM +/− <50% goblet cells; ≥2 cm away from the GEJ) | |
| 1 Biopsy sample of intestinalized mucosa with a high goblet cell density (>50% goblet cells; ≥2 cm away from the GEJ) | 15 Biopsy samples of intestinalized mucosa with a high goblet cell density (>50% goblet cells; ≥2 cm away from the GEJ) |
Abbreviations: BE, Barrett's esophagus; GEJ, gastroesophageal junction; miRNA, microRNA.
A discovery set of 30 biopsy samples was used in the miRNA microarray study, and a validation set of 75 biopsy samples was used in the qRT-PCR study.
A first discovery set, used in the miRNA microarray study, concerned 10 histologically proven long-segment BE patients (mean age 61.8±6.9, range 54–76; all Caucasian males). Three biopsies were used for each patient (Table 1): (i) a squamous epithelium sample obtained no less than 3 cm away from any type of metaplastic mucosa; (ii) a GM sample obtained no <2 cm away from the gastroesophageal junction; and (iii) an IM sample obtained no <2 cm away from the gastroesophageal junction and comprising >50% of goblet cells.
A validation set, used in the qRT-PCR study, consisted of 75 biopsy samples obtained from 48 cases of histologically proven long-segment BE (patients were all Caucasian males; mean age 65.5±8.3, range 57–77). The following histologically validated tissue samples were considered (Table 1): (i) squamous esophageal epithelium obtained no <3 cm away from the metaplastic mucosa=15 cases; (ii) MLE=15 cases; (iii) GM obtained no <2 cm away from the gastroesophageal junction=15 cases; (iv) IM +/− obtained no <2 cm away from the gastroesophageal junction and comprising <50% of goblet cells=15 cases; and (v) IM obtained no <2 cm away from the gastroesophageal junction and comprising >50% of goblet cells=15 cases.
In all cases, lesions were microdissected manually, based on the original H&E slides, from formalin-fixed, paraffin-embedded samples to obtain at least 80% of target cells.
miRNA microarray
Formalin-fixed, paraffin-embedded biopsy samples were deparaffinized and underwent total RNA extraction using the RecoverAll kit according to the manufacturer's instructions (Ambion Inc, Austin, TX). RNA labeling and hybridization on miRNA microarray chips were done as described in detail elsewhere.25, 29 Briefly, 5 μg of total RNA from each sample were reverse-transcribed using biotin end-labeled random-octamer oligonucleotide primer. Biotin-labeled complementary DNA was hybridized on an Ohio State University custom miRNA microarray chip (OSU_CCC version 4.0) containing ∼1,100 miRNA probes, including 326 human and 249 mouse miRNA genes, plus 10 control genes, spotted in duplicate. The hybridized chips were washed and processed for biotin-containing transcript detection by streptavidin-Alexa 647 conjugate and scanned on an Axon 4000B microarray scanner (Axon Instruments, Sunnyvale, CA).
Statistical and bioinformatic analyses
Microarray images were analyzed using GENEPIX PRO 6.0 (Axon Instruments). Average values of the replicate spots of each miRNA were background subtracted, normalized using quantiles enabling a comparison between chips, and further analyzed. The microarray data are deposited in the Gene Expression Omnibus at the National Center for Biotechnology Information (GEO: GSE24839). The miRNAs that were expressed differently in the different esophageal lesions were identified using a random-variance t-test, which is an improvement over the standard separate t-test, because it enables information on within-class variation to be shared among genes without assuming that all genes have the same variance. Genes were considered statistically significant if their P value was <0.001; a stringent significance threshold was used to limit the number of false-positive findings. A linear regression model using normalized log2-transformed miRNA expression values was applied to test significant dysregulated miRNAs in the different metaplastic lesions, and P values were adjusted for multiple testing using FDR correction. Only FDR<0.0005 and P<0.0001 were considered. Only mature miRNAs that were differently expressed are reported.
Quantitative real-time polymerase chain reaction (qRT-PCR)
The NCode miRNA qRT-PCR method (Invitrogen, Carlsbad, CA) was used to detect and quantify mature miRNAs on Applied Biosystems (Foster City, CA) qRT-PCR instruments according to the manufacturer's instructions.25, 30 Normalization was done with the small nuclear RNA U6B (RNU6B; Invitrogen). All real-time reactions, including no-template controls and real-time minus controls, were run in a GeneAmp PCR 9700 thermocycler (Applied Biosystems). Gene expression levels were quantified using the ABI Prism 7900HT Sequence Detection System (Applied Biosystems). Comparative real-time PCR was performed in triplicate, including no-template controls. The fold difference for each sample was obtained using the equation 2−dCt, where Ct is the threshold cycle and dCt stands for the Ct average sample gene—the Ct average RNU6B. Differential expression was tested using the two-sided t-test.
RESULTS
miRNAs are dysregulated in Barrett's metaplasia
To identify the miRNA profiles that are dysregulated in columnar Barrett's mucosa, a miRNA microarray analysis was performed on a discovery set of 30 matching biopsy samples obtained from 10 long-segment BE patients (Table 1). The miRNA microarray analysis was performed using a validated custom microarray platform.29, 31
Different miRNA expression profiles were identified by comparing the different metaplastic phenotypes (Table 2). Eleven miRNAs were found dysregulated (P<0.001) in GM by comparison with squamous epithelium (Figure 1a), and six in IM by comparison with squamous epithelium (Figure 1b). All six IM-associated miRNAs were shared with the GM signature (Table 2).
Table 2. Differently expressed miRNAs in Barrett's metaplastic lesions.
| miRNA |
S/GM/IM sequence |
S vs. GM |
S vs. IM |
|||||
|---|---|---|---|---|---|---|---|---|
| P | FDR-adjusted P | Fold change | P | FDR-adjusted P | Fold change | P | FDR-adjusted P | |
| hsa-miR-18a* | <0.0001 | <0.0001 | 0.00 | <1e-07 | <1e-07 | 0.01 | 1.0e-07 | 3.8e-05 |
| hsa-miR-205 | <0.0001 | <0.0001 | 0.01 | <1e-07 | <1e-07 | 0.02 | 3.0e-07 | 5.6e-05 |
| hsa-miR-203 | <0.0001 | 0.0005 | 0.21 | 1.5e-05 | 0.001 | 0.21 | 1.2e-03 | 0.015 |
| hsa-miR-20a | — | — | 0.23 | 4.1e-03 | 0.017 | 0.26 | 6.3e-03 | 0.047 |
| hsa-miR-106a | — | — | 0.32 | 8.9e-03 | 0.031 | 0.27 | 8.6e-03 | 0.053 |
| hsa-miR-20b | — | — | 0.46 | 8.3e-05 | 0.004 | — | — | — |
| hsa-miR-611 | — | — | 1.65 | 8.9e-03 | 0.031 | — | — | — |
| hsa-miR-145 | — | — | 2.57 | 3.5e-05 | 0.002 | — | — | — |
| hsa-miR-625* | — | — | 2.58 | 3.4e-03 | 0.016 | — | — | — |
| hsa-miR-192 | <0.0001 | 0.0001 | 5.29 | 2.7e-05 | 0.002 | — | — | — |
| hsa-miR-215 | <0.0001 | <0.0001 | 12.90 | 6.6e-06 | 0.001 | 16.81 | 2.4e-03 | 0.022 |
| hsa-miR-194 | <0.0001 | 0.0001 | — | — | — | — | — | — |
Abbreviations: FDR, false discovery rate; GM, gastric metaplasia; IM, intestinal metaplasia; miRNA, microRNA; S, squamous epithelium.
Figure 1.

miRNA expression is altered in esophageal metaplastic lesions. (a) miRNA significantly dysregulated (P<0.001) in gastric metaplasia (right panel) by comparison with squamous esophageal epithelium (left panel). (b) miRNA significantly dysregulated (P<0.001) in intestinal metaplasia (right panel) by comparison with squamous esophageal epithelium (left panel). Rows represent individual genes; columns represent individual tissue samples. The gray scale indicates transcript levels below, equal to, or above the mean (white, gray, and black, respectively); the scale represents the intensity of gene expression (log2 scale ranges between −3 and 3).
In GM samples, six miRNAs were significantly downregulated (i.e., hsa-miR-18a*, hsa-miR-205, hsa-miR-203, hsa-miR-20a, hsa-miR-106a, and hsa-miR-20b) and five were upregulated (i.e., hsa-miR-611, hsa-miR-145, hsa-miR-6625*, hsa-miR-192, and hsa-miR-215). The IM signature disclosed five downregulated miRNAs (hsa-miR-18a*, hsa-miR-205, hsa-miR-203, hsa-miR-20a, and hsa-miR-106a) and one upregulated miRNA (hsa-miR-215).
The different expression of six miRNAs was assessed in the squamous vs. non-intestinalized vs. intestinalized phenotypes (Figure 2 and Table 2; logistic regression, FDR <0.0005). Three miRNAs were found increasingly upregulated (i.e., hsa-miR-215, hsa-miR-192, and hsa-miR-194), and three were increasingly downregulated (i.e., hsa-miR-18a*, hsa-miR-205, and hsa-miR-203).
Figure 2.

MicroRNA (miRNA) expression is altered in the progression from squamous epithelium to intestinal metaplasia. miRNA was significantly (FDR<0.001) dysregulated in the progression from squamous epithelium to gastric metaplasia to intestinal metaplasia. Rows represent individual genes; columns represent individual tissue samples. Pseudo-colors indicate transcript levels below, equal to, or above the mean (green, black, and red, respectively); the scale represents the intensity of gene expression (log2 scale ranges between −3 and 3).
qRT-PCR validation
To validate the results of the microarray analysis, qRT-PCR analysis was performed on an independent series of 75 endoscopic biopsy samples obtained from 48 long-segment BE patients (Table 1). The analysis included 15 samples of MLE, which is recognized as an early-intermediate form of columnar metaplasia with both squamous and columnar features. A set of low-density IM samples was also considered to test the influence of the prevalence of goblet cells on miRNA assessment.
Seven miRNA dysregulations were validated (Figure 3 and Table 3), i.e.,: (i) five miRNAs in the squamous to GM to IM sequence (hsa-miR-18a*, hsa-miR-205, hsa-miR-203, hsa-miR-192, and hsa-miR-215; Table 2); and (ii) two miRNAs shared by the squamous vs. GM, and by the squamous vs. IM profiles (hsa-miR-20a and hsa-miR-106a).
Figure 3.

qRT-PCR analysis for dysregulated miRNAs in metaplastic lesions. A total of 75 biopsy samples were considered, comprising: 15 squamous mucosa, 15 multilayered epithelium (MLE), 15 gastric metaplasia cardiac-type (GM), 15 low-density intestinal metaplasia (IM +/−), and 15 high-density IM. Two microRNAs (miRNAs; hsa-miR-192 and hsa-miR-215) were significantly upregulated in the metaplastic tissue by comparison with the squamous epithelium, whereas five miRNAs (hsa-miR-18a, hsa-miR-20a, hsa-miR-106a, hsa-miR-203, and hsa-miR-205) were downregulated. Rows represent individual genes; columns represent different lesion classes. Pseudo-colors indicate transcript levels below, equal to, or above the mean (green, black, and red, respectively); the scale represents the log2 difference between the mean expression levels seen in the metaplastic lesions and squamous epithelium. Numerical values are given in Table 3.
Table 3. miRNA expression tested by qRT-PCR analysis in the different metaplastic lesions.
| MLE | GM | IM +/- | IM | P (S vs. GM) | P (S vs. IM) | P (GM vs. IM) | |
|---|---|---|---|---|---|---|---|
| hsa-miR-18a* | −2.5±0.3 | −3.2±0.3 | −3.1±0.2 | −3.6±0.3 | <0.01 | <0.01 | NS |
| hsa-miR-20a | −1.1±0.1 | −1.0±0.1 | −1.2±0.1 | −1.1±0.1 | 0.04 | 0.04 | NS |
| hsa-miR-106a | −2.8±0.3 | −3.0±0.3 | −3.0±0.2 | −2.9±0.2 | <0.01 | <0.01 | NS |
| hsa-miR-192 | 2.2±0.2 | 3.0±0.4 | 2.9±0.3 | 3.6±0.3 | <0.01 | <0.01 | 0.02 |
| hsa-miR-215 | 4.2±0.5 | 5.2±0.4 | 5.2±0.4 | 5.6±0.5 | <0.01 | <0.01 | NS |
| hsa-miR-203 | −2.2±0.3 | −3.5±0.2 | −6.7±0.6 | −7.1±0.6 | <0.01 | <0.01 | <0.01 |
| hsa-miR-205 | −1.9±0.2 | −3.4±0.3 | −8.1±0.8 | −12.1±0.9 | <0.01 | <0.01 | <0.01 |
Abbreviations: FDR, false discovery rate; GM, gastric metaplasia; IM, intestinal metaplasia; IM +/−, low-density intestinal metaplasia; MLE, multilayered epithelium; NS, not statistically significant; S, squamous epithelium.
Data are expressed as log2(lesion)-log2(native esophageal epithelium)±s.e.
As for the comparisons between squamous and GM, and between squamous and IM, qRT-PCR results were consistent with those obtained by miRNA microarray analysis. As expected, hsa-miR-20a and hsa-miR-106a showed no significant difference between GM and IM. It is noteworthy that: (i) MLE showed a miRNA dysregulation comparable with the picture seen in columnar metaplastic lesions; and (ii) goblet cell density did not significantly affect the results (Figure 3, Table 3).
DISCUSSION
It has recently been reported that the incidence of cancer among BE patients is lower than was previously believed,16, 32, 33 but at least three potential biases may significantly affect the assessment of the cancer risk associated with BE: (i) the histological definition of Barrett's metaplasia; (ii) the significant variability in the endoscopic diagnostic approach, including the biopsy sampling protocols; and (iii) inconsistencies in endoscopist–pathologist interactions. The most important factor concerns the unequivocal histological definition of the Barrett's mucosa phenotype, which is crucial to a consistent identification of the population at higher neoplastic risk, and to a “personalized” secondary cancer prevention strategy.
In addition to the well-established relationship between cancer and esophageal IM, recent studies have associated neoplastic progression with non-intestinalized metaplasia too.12, 13, 14, 15, 16 Elucidating this point is challenging, however: results obtained in experimental models are only partially applicable to humans, and information obtained in clinical trials is strongly affected by a significant variability in histological assessments and endoscopic follow-up protocols.
Unlike most RNA molecules, miRNAs are long-living in vivo and very stable in vitro.17, 28, 34 These structural characteristics allow for miRNA testing in formalin-fixed, paraffin-embedded tissue samples, which is essential to link specific biological signatures with well-established histological phenotypes.17 miRNA expression profiling thus has the potential for histologically distinguishing between and classifying different lesions, and several reports have demonstrated the excellent reproducibility of miRNA expression profiling in (archival) formalin-fixed, paraffin-embedded tissue samples.35
Several studies have focused on miRNA dysregulation in Barrett's carcinogenesis19, 20, 21, 22, 23, 24, 25 and specific miRNA expression signatures have been associated with cancer progression,21, 22, 23, 24, 25 whereas the molecular profiling of BE-related metaplastic changes had never been investigated.
The present findings show that: (i) miRNA dysregulation occurs early in the morphogenesis of Barrett's mucosa and is at least partially responsible for its columnar metaplastic transformation; (ii) similar miRNA dysregulations are behind both non-intestinalized and intestinalized columnar metaplasia, and this supports a “basic” biological consistency of the pathway leading to metaplastic columnar changes (with and without a goblet component); and (iii) miRNA signatures (Tables 2 and 3) show a “progressive” dysregulation along the path from squamous to non-intestinalized to intestinalized metaplasia, supporting the hypothesis of a progressive transformation from a non-intestinalized (earlier) to an intestinalized (more advanced) Barrett's phenotype.
The present results are in keeping with previous reports on miRNA dysregulation in esophageal IM, in which we showed a significant downregulation of hsa-miR-203/-miR-205, and a concomitant upregulation of hsa-miR-192/-miR-215.21, 22, 23, 25 These miRNAs have also been associated with the whole Barrett's carcinogenic cascade,20, 21, 22, 23, 25 further reinforcing the role of their dysregulation in the molecular “natural history” of Barrett's disease.
hsa-miR-203 is known to target the transcription factor p63, and is therefore involved in maintaining the squamous commitment of different stratified epithelia.36, 37, 38, 39 The reported downregulation of hsa-miR-203 is basically consistent with the loss of the native squamous phenotype, and matches with the emerging columnar morphology.
The concomitant upregulation of two p53-induced miRNAs like hsa-miR-192 and hsa-miR-215 could be in response to the genotoxic stress caused by chronic gastroesophageal acid reflux.40, 41
The progressive upregulation of hsa-miR-194 in the squamous to GM to IM sequence is consistent with its biological function: this miRNA is involved in the commitment and maturation of intestinal epithelia, and it is regulated by the hepatocyte nuclear factor 1α.42 The role of hsa-miR-194 overexpression in establishing the intestinal phenotype warrants further investigation in in vivo models.
A novel finding in the present study is the similarity in the expression profiles of MLE and overt metaplastic lesions (GM and both low- and high-density IM). The trend of miRNA dysregulation also suggests a multistep metaplastic transformation of the esophageal mucosa, evolving from the native squamous epithelium to GM columnar cells, and then to a full intestinal phenotype.
Future efforts should focus on assessing similarities and differences in miRNA signatures between gastric/esophageal IM and normal intestinal mucosa, and between normal gastric cardia and cardiac-type esophageal metaplasia. This could help us to identify novel biomarkers of metaplastic transformation for use in clinical practice when it comes to deciding secondary prevention strategies.
In conclusion, this mRNA profiling study disclosed similar molecular dysregulations in both non-intestinalized and intestinalized columnar esophageal metaplasia, supporting the impression that any type of columnar transformation is part of the biological spectrum of Barrett's mucosa. Further prospective studies, also on different ethnic groups, should seek to assess the cancer risk associated with the different Barrett's mucosa phenotypes.
Study Highlights
Acknowledgments
The microarray data are deposited in the Gene Expression Omnibus at the National Center for Biotechnology Information (GEO:GSE24839). We thank Frances Coburn for text editing, and Cristiano Lanza and Vanni Lazzarin for technical assistance.
Guarantor of the article: Massimo Rugge, MD, FACG.
Specific author contributions: All authors approved the final version of the manuscript. Study concept and design: M. Fassan and M. Rugge; data acquisition: M. Balistreri, G. Battaglia, M. Fassan, and M. Pizzi, M. Rugge; data analysis and interpretation: M. Fassan, C. Fernandez-Cymering, J. Palatini, and S. Volinia; drafting of the manuscript: C.M. Croce, M. Fassan, R.D. Odze, M. Rugge, R Souza, and G. Zaninotto.
Financial support: This research was partially supported by the AIRC grant Veneto Region, 2008. The funding agency had no role in the design and performance of the study.
Potential competing interests: None.
Ethical approval: Only material that was not required for diagnostic purposes was used and all patients signed an informed consent approved by the Padua University Hospital Review Board, which allows researchers to use excess material for research purposes.
References
- American Gastroenterological Association. Spechler SJ, Sharma P, Souza RF, et al. American Gastroenterological Association medical position statement on the management of Barrett's esophagus. Gastroenterology. 2011;140:1084–1091. doi: 10.1053/j.gastro.2011.01.030. [DOI] [PubMed] [Google Scholar]
- Spechler SJ, Sharma P, Souza RF, et al. American Gastroenterological Association technical review on the management of Barrett's esophagus. Gastroenterology. 2011;140:e18–e52. doi: 10.1053/j.gastro.2011.01.031. [DOI] [PMC free article] [PubMed] [Google Scholar]
- Odze RD. Barrett esophagus: histology and pathology for the clinician. Nat Rev Gastroenterol Hepatol. 2009;6:478–490. doi: 10.1038/nrgastro.2009.103. [DOI] [PubMed] [Google Scholar]
- Paulson TG, Reid BJ. Focus on Barrett's esophagus and esophageal adenocarcinoma. Cancer Cell. 2004;6:11–16. doi: 10.1016/j.ccr.2004.06.021. [DOI] [PubMed] [Google Scholar]
- Fitzgerald RC. Molecular basis of Barrett's oesophagus and oesophageal adenocarcinoma. Gut. 2006;55:1810–1820. doi: 10.1136/gut.2005.089144. [DOI] [PMC free article] [PubMed] [Google Scholar]
- Riddell RH, Odze RD. Definition of Barrett's esophagus: time for a rethink--is intestinal metaplasia dead. Am J Gastroenterol. 2009;104:2588–2594. doi: 10.1038/ajg.2009.390. [DOI] [PubMed] [Google Scholar]
- Rugge M, Fassan M, Battaglia G, et al. Intestinal or gastric? The unsolved dilemma of Barrett's metaplasia. Hum Pathol. 2009;40:1206–1207. doi: 10.1016/j.humpath.2009.03.022. [DOI] [PubMed] [Google Scholar]
- Fiocca R, Mastracci L, Milione M, et al. Microscopic esophagitis and Barrett's esophagus: the histology report. Dig Liver Dis. 2011;43 (Suppl 4:S319–S330. doi: 10.1016/S1590-8658(11)60588-4. [DOI] [PubMed] [Google Scholar]
- Fassan M, Lanza C, Lazzarin V, et al. The original sin of oesophageal mucosa. Dig Liver Dis. 2011;43:246. doi: 10.1016/j.dld.2010.01.014. [DOI] [PubMed] [Google Scholar]
- Barrett NR. The oesophagus lined by columnar epithelium. Gastroenterologia. 1956;86:183–186. doi: 10.1159/000200553. [DOI] [PubMed] [Google Scholar]
- Jankowski JA, Harrison RF, Perry I, et al. Barrett's metaplasia. Lancet. 2000;356:2079–2085. doi: 10.1016/S0140-6736(00)03411-5. [DOI] [PubMed] [Google Scholar]
- Vakil N, van Zanten SV, Kahrilas P, et al. The Montreal definition and classification of gastroesophageal reflux disease: a global evidence-based consensus. Am J Gastroenterol. 2006;101:1900–1920. doi: 10.1111/j.1572-0241.2006.00630.x. [DOI] [PubMed] [Google Scholar]
- Takubo K, Aida J, Naomoto Y, et al. Cardiac rather than intestinal-type background in endoscopic resection specimens of minute Barrett adenocarcinoma. Hum Pathol. 2009;40:65–74. doi: 10.1016/j.humpath.2008.06.008. [DOI] [PubMed] [Google Scholar]
- Hahn HP, Blount PL, Ayub K, et al. Intestinal differentiation in metaplastic, nongoblet columnar epithelium in the esophagus. Am J Surg Pathol. 2009;33:1006–1015. doi: 10.1097/PAS.0b013e31819f57e9. [DOI] [PMC free article] [PubMed] [Google Scholar]
- Liu W, Hahn H, Odze RD, et al. Metaplastic esophageal columnar epithelium without goblet cells shows DNA content abnormalities similar to goblet cell-containing epithelium. Am J Gastroenterol. 2009;104:816–824. doi: 10.1038/ajg.2009.85. [DOI] [PMC free article] [PubMed] [Google Scholar]
- Rugge M, Fassan M, Cavallini F, et al. Re: Risk of malignant progression in Barrett's esophagus patients: results from a large population-based study. J Natl Cancer Inst. 2012;104:1771–1772. doi: 10.1093/jnci/djs426. [DOI] [PubMed] [Google Scholar]
- Fassan M, Croce CM, Rugge M. miRNAs in precancerous lesions of the gastrointestinal tract. World J Gastroenterol. 2011;17:5231–5239. doi: 10.3748/wjg.v17.i48.5231. [DOI] [PMC free article] [PubMed] [Google Scholar]
- Croce CM. Causes and consequences of microRNA dysregulation in cancer. Nat Rev Genet. 2009;10:704–714. doi: 10.1038/nrg2634. [DOI] [PMC free article] [PubMed] [Google Scholar]
- Kan T, Meltzer SJ. MicroRNAs in Barrett's esophagus and esophageal adenocarcinoma. Curr Opin Pharmacol. 2009;9:727–732. doi: 10.1016/j.coph.2009.08.009. [DOI] [PMC free article] [PubMed] [Google Scholar]
- Feber A, Xi L, Luketich JD, et al. MicroRNA expression profiles of esophageal cancer. J Thorac Cardiovasc Surg. 2008;135:255–260. doi: 10.1016/j.jtcvs.2007.08.055. [DOI] [PMC free article] [PubMed] [Google Scholar]
- Kan T, Sato F, Ito T, et al. The miR-106b-25 polycistron, activated by genomic amplification, functions as an oncogene by suppressing p21 and Bim. Gastroenterology. 2009;136:1689–1700. doi: 10.1053/j.gastro.2009.02.002. [DOI] [PMC free article] [PubMed] [Google Scholar]
- Yang H, Gu J, Wang KK, et al. MicroRNA expression signatures in Barrett's esophagus and esophageal adenocarcinoma. Clin Cancer Res. 2009;15:5744–5752. doi: 10.1158/1078-0432.CCR-09-0385. [DOI] [PMC free article] [PubMed] [Google Scholar]
- Wijnhoven BP, Hussey DJ, Watson DI, et al. MicroRNA profiling of Barrett's oesophagus and oesophageal adenocarcinoma. Br J Surg. 2010;97:853–861. doi: 10.1002/bjs.7000. [DOI] [PubMed] [Google Scholar]
- Bansal A, Lee IH, Hong X, et al. Feasibility of mcroRNAs as biomarkers for Barrett's Esophagus progression: a pilot cross-sectional, phase 2 biomarker study. Am J Gastroenterol. 2011;106:1055–1063. doi: 10.1038/ajg.2011.37. [DOI] [PubMed] [Google Scholar]
- Fassan M, Volinia S, Palatini J, et al. MicroRNA expression profiling in human Barrett's carcinogenesis. Int J Cancer. 2011;129:1661–1670. doi: 10.1002/ijc.25823. [DOI] [PMC free article] [PubMed] [Google Scholar]
- Zaninotto G, Minnei F, Guirroli E, et al. The Veneto Region's Barrett's Oesophagus Registry: aims, methods, preliminary results. Dig Liver Dis. 2007;39:18–25. doi: 10.1016/j.dld.2006.09.021. [DOI] [PubMed] [Google Scholar]
- Levine DS, Blount PL, Rudolph RE, et al. Safety of a systematic endoscopic biopsy protocol in patients with Barrett's esophagus. Am J Gastroenterol. 2000;95:1152–1157. doi: 10.1111/j.1572-0241.2000.02002.x. [DOI] [PubMed] [Google Scholar]
- Glickman JN, Spechler SJ, Souza RF, et al. Multilayered epithelium in mucosal biopsy specimens from the gastroesophageal junction region is a histologic marker of gastroesophageal reflux disease. Am J Surg Pathol. 2009;33:818–825. doi: 10.1097/PAS.0b013e3181984697. [DOI] [PubMed] [Google Scholar]
- Baffa R, Fassan M, Volinia S, et al. MicroRNA expression profiling of human metastatic cancers identifies cancer gene targets. J Pathol. 2009;219:214–221. doi: 10.1002/path.2586. [DOI] [PubMed] [Google Scholar]
- Fassan M, Pizzi M, Battaglia G, et al. Programmed cell death 4 (PDCD4) expression during multistep Barrett's carcinogenesis. J Clin Pathol. 2010;63:692–696. doi: 10.1136/jcp.2010.078253. [DOI] [PMC free article] [PubMed] [Google Scholar]
- Volinia S, Calin GA, Liu CG, et al. A microRNA expression signature of human solid tumors defines cancer gene targets. PNAS. 2006;103:2257–2261. doi: 10.1073/pnas.0510565103. [DOI] [PMC free article] [PubMed] [Google Scholar]
- Hvid-Jensen F, Pedersen L, Drewes AM, et al. Incidence of adenocarcinoma among patients with Barrett's esophagus. N Engl J Med. 2011;365:1375–1383. doi: 10.1056/NEJMoa1103042. [DOI] [PubMed] [Google Scholar]
- Bhat S, Coleman HG, Yousef F, et al. Risk of malignant progression in Barrett's esophagus patients: results from a large population-based study. J Natl Cancer Inst. 2011;103:1049–1057. doi: 10.1093/jnci/djr203. [DOI] [PMC free article] [PubMed] [Google Scholar]
- van Baal JW, Verbeek RE, Bus P, et al. microRNA-145 In Barrett's oesophagus: regulating BMP4 signalling via GATA6. Gut. 2012;62:664–675. doi: 10.1136/gutjnl-2011-301061. [DOI] [PubMed] [Google Scholar]
- Streichert T, Otto B, Lehmann U. MicroRNA expression profiling in archival tissue specimens: methods and data processing. Mol Biotechnol. 2012;50:159–169. doi: 10.1007/s12033-011-9427-1. [DOI] [PubMed] [Google Scholar]
- Yi R, O'Carroll D, Pasolli HA, et al. Morphogenesis in skin is governed by discrete sets of differentially expressed microRNAs. Nat Genet. 2006;38:356–362. doi: 10.1038/ng1744. [DOI] [PubMed] [Google Scholar]
- Tran N, McLean T, Zhang X, et al. MicroRNA expression profiles in head and neck cancer cell lines. Biochem Biophys Res Commun. 2007;358:12–17. doi: 10.1016/j.bbrc.2007.03.201. [DOI] [PubMed] [Google Scholar]
- Lena AM, Shalom-Feuerstein R, Rivetti di Val Cervo P, et al. miR-203 Represses 'stemness' by repressing DeltaNp63. Cell Death Differ. 2008;15:1187–1195. doi: 10.1038/cdd.2008.69. [DOI] [PubMed] [Google Scholar]
- Yuan Y, Zeng ZY, Liu XH, et al. MicroRNA-203 inhibits cell proliferation by repressing ΔNp63 expression in human esophageal squamous cell carcinoma. BMC Cancer. 2011;11:57. doi: 10.1186/1471-2407-11-57. [DOI] [PMC free article] [PubMed] [Google Scholar]
- Georges SA, Biery MC, Kim SY, et al. Coordinated regulation of cell cycle transcripts by p53-Inducible microRNAs, miR-192 and miR-215. Cancer Res. 2008;68:10105–10112. doi: 10.1158/0008-5472.CAN-08-1846. [DOI] [PubMed] [Google Scholar]
- Braun CJ, Zhang X, Savelyeva I, et al. p53-Responsive micrornas 192 and 215 are capable of inducing cell cycle arrest. Cancer Res. 2008;68:10094–10104. doi: 10.1158/0008-5472.CAN-08-1569. [DOI] [PMC free article] [PubMed] [Google Scholar]
- Hino K, Tsuchiya K, Fukao T, et al. Inducible expression of microRNA-194 is regulated by HNF-1alpha during intestinal epithelial cell differentiation. RNA. 2008;14:1433–1442. doi: 10.1261/rna.810208. [DOI] [PMC free article] [PubMed] [Google Scholar]