

Abstract
The hypoxic conditions induced by reduced blood flow decreases oxygen availability in target tissues. Cellular hypoxia leads to mitochondrial dysfunction, decreased energy production and increased production of reactive oxygen species. In order to determine the alteration in expression of mitochondrial genes following hypoxia in cardiomyocytes, we developed a rodent mitochondrial gene chip (RoMitoChip). The chip had 1088 probesets including 46 probesets representing 37 mouse mitochondrial DNA (mtDNA) transcripts and the remaining probesets representing mouse nuclear genes contributing to the mitochondrial structure and function. Mouse cardiomyocytes isolated from neonatal C57BL/6 mice were subjected to hypoxia (1% oxygen) for different time intervals demonstrated a dichotomy in the expression profile of tRNA and mRNA transcripts. We report a total of 483 signature genes that were altered by hypoxia in the cardiac myocytes, and related to mitochondrial structure and function. This includes 23 transcripts on mtDNA. Pathway analysis demonstrated predominant changes in the expression of genes involved in oxidative phosphorylation, glucose and fatty acid metabolism and apoptosis. The most upregulated genes following 24 hr hypoxia included HIF-1α inducible genes Bnip3, Pdk1 and Aldoc. While Bnip3 is important in the cardiomyocyte death pathway, Pdk1 enzyme is critical in conserving mitochondrial function by diverting metabolic intermediates to glycolysis. This study identifies the participation of two important pathways, cell death and glycolytic, and two key proteins, Bnip3 and Pdk1, playing critical role in these pathways in cardiomyocytes following severe hypoxia.
Keywords: heart, microarray, mitochip, apoptosis, custom chip
INTRODUCTION
The overwhelming majority of clinical heart failure cases are the consequence of primary myocardial dysfunction, with depressed cardiac output (1). A reduced blood flow in coronary arteries may cause hypoxia in tissues downstream of the lesion (2). The progression to heart failure due to reasons such as myocardial infarction is associated with a decline in the activity of mitochondrial respiratory pathways leading to diminished capacity for ATP production (3; 4). Mitochondrial oxidative phosphorylation is the primary energy source in the myocardial cell. The molecular mechanism of mitochondrial damage and dysfunction to cardiomyocytes and its contribution to the outcome following injury to the heart is not fully known(5; 6). Mitochondria are often referred as the “power house” of a cell, as its main function is the production of energy in the form of ATP through the process of oxidative phosphorylation. Further, decreased bioenergetics may compromise organ system functional reserve predisposing to increased probability of adverse outcome (5–8) . Additionally reduced capacity for energy transduction leads to secondary dysregulation of cellular processes critical for cardiac pump function, including Ca2+ handling and contractile function, which intensifies increased energy demand and diminished function (3; 9).
Alterations in the function of mitochondria are not solely due to changes in transcripts encoded only in the mitochondrial genome, most of the genetic information for the mitochondrial biogenesis and function resides in the nuclear genome (2; 3; 10). In order to study mitochondrial gene alterations in health and disease we developed a mitochondrial gene chip, RoMitoChip (Rodent Mitochochondrial gene Chip), a focused microarray. The exact number of mammalian mitochondrial proteins is not known, though those derived from mtDNA are well defined. The indirect evidences suggest approximately 1200 proteins in this organelle (11). A recent proteomic study has identified approximately 600 mitochondrial proteins in the mouse and another study identified approximately 700 in the rat (11; 12). Though most of the mitochondrial genes encoded in the nuclear genome are represented in the Affymetrix Mouse 430 2.0 and Affymetrix Rat 230 2.0 GeneChip, the lack of representation of genes of mtDNA in these chips and the presence of several thousand probe sets, and hence the need to analyze several thousand genes that demands time and computing power, prompted us to develop the RoMitoChip. This chip was developed on an Affymetrix platform and in this manuscript we report the hypoxia responsive genes in mouse cardiomyocytes determined using the RoMitoChip.
METHODS
Mouse cardiomyocytes and hypoxic exposure
Mouse cardiomyocytes isolated from neonatal C57BL/6 mice was obtained from a commercial source (Sciencell Laboratories) as a custom product. The cells were cultured for four days and the batches that passed the strict quality control were shipped frozen for the investigations. The frozen vials were thawed and were cultured in cardiac myocytes medium (Sciencell Research Laboratories, Carlsbad, CA). After 4 days in culture, the cells were exposed to normoxia or 1% hypoxia in a Queue Systems incubator (Parkersburg, WV) for 8 hr or 24 hr. RNA was isolated and gene expression profiles were determined using the RoMitoChip developed in our laboratory as described in this communication.
Microarray: Gene selection
The genes represented in the mitochondrial and nuclear genome of the rat and the mouse that contribute to mitochondrial structure and function were identified. Mitochondrial genome consists of a circular DNA (mtDNA) with about 16000 bases and 37 transcripts. Of these 37 transcripts, 13 code for proteins, 2 code for ribosomal RNAs (12 and 16S), and 22 code for tRNAs. The thirteen proteins on the mitochondrial DNA are: seven subunits of NADH dehydrogenase, cytochrome b, three cytochrome c oxidase subunits (1, 2 and 3) and ATP synthase 6 and 8. We placed both mouse and rat mitochondrial genes on the same chip.
The gene sequences representing the mouse mitochondrial genome included in the gene chip comprised of the published mtDNA sequences of the strains: C57BL/6J (Accession # AY172335), NZB/B1NJ (Accession # L07095), Balb/cJ (Accession # AJ512208), AKR/J(Accession # AB042432), and C3H/He (Accession # AB049357). The 37 transcripts were represented by a total of 46 different probe sets for mouse mitochondrial DNA.
The gene sequences representing the rat mitochondrial genome included in the gene chip encompassed published mtDNA sequences of ten different inbred strains: WKY/NCrl (Wistar Kyoto; Accession # DQ673907), BN/NHsdMcwi (Brown Norway; Accession# AC_000022); F344/NHsd (Fisher 344; Accession # DQ673909); ACI/Eur (August×Copenhagen Irish; Accession # DQ673908), FHH/Eur (fawn hooded hypertensive; Accession # DQ673910), GK/Swe (Accession # DQ673913), GK/Far (Accession # DQ673912), T2DN/Mcwi (Accession #DQ673915), GH/OmrMcwi (Accession # DQ673911) and SS/JrHsdMcwi (Dahl Salt-sensitive; Accession # DQ673914) (13). These specific strains were chosen because complete sequences of mtDNA were available for each of them. Each of the genes from these 10 different strains was aligned and 48 different probe sets were created to represent all the 37 transcripts from these 10 strains.
We used four different databases to identify and extract nuclear genes important in the structure and function of mitochondria. They were: mouse genome database of the Jackson lab, the Mitop2 database, the Rat Genome database from Wisconsin and NetAffyx. Additionally, some relevant publications and the NCBI database were also used.
Probesets corresponding to these genes were placed on an 11 micron chip as antisense probesets, on Affymetrix platform. The chip contained a total of 1088 probesets representing genes from mitochondrial and nuclear DNA from the mouse and 419 from the rat. The experiments described in this communication harness the mouse probesets on this chip. Each probeset consists of 11 oligonucleotide probes directed against the same target transcript, along with 11 control probes with single base-pair mismatches; these function as a combined unit to assess transcript levels and determine the background hybridization for each probe, thereby establishing internal controls for the hybridization signals of each gene (14).
Microarray experimentation
RNA was isolated from snap frozen cardiomyocytes and RNA integrity was checked by resolving on an Agilent 2100 Bioanalyzer (Agilent, Santa Clara, CA). 100ng of total RNA was amplified from each RNA sample and labeled using the Affymetrix Whole-Transcript Assay (WTA) Sense Target Labeling Protocol. Ribosomal RNA was not removed. RoMitoChip gene arrays were hybridized with 11 µg of labeled sense DNA. In order to compare the results obtained using the RoMitoChip to that of a gold standandard, Affymetrix Gene 1.0 ST chips were also hybridized with the same pool of labeled sense DNA. The hybridized chips were washed using the Affymetrix fluidics station 450, stained, and scanned on the 3000 7G scanner as described by the manufacturer (Affymetrix, Santa Clara, CA). GeneChip hybridizations were carried out in the Gene Expression Shared Facility of the Comprehensive Cancer Center at the University of Alabama at Birmingham. Four chips were employed for each treatment group.
Data Analysis
Gene expression data was normalized using RMA (15) and quantile normalization methods. After normalization, analysis of variance (ANOVA) was applied to compare gene expression level changes for three time points. P-values for pair-wise comparisons among three time points were adjusted using Tukey’s method in ANOVA analysis. The final p-values were adjusted using Benjamini and Hochberg’s FDR method (16). We used statistical software R and SAS v9.13 for data analysis.
Real-time PCR
Real time PCR was carried out using FAM-labelled Taqmann real time PCR primers for Pdk1, Bnip3 and β-actin (ABI, Foster City, CA). The template cDNA was prepared by random priming from RNA isolated from cardiomyocytes subjected to normoxia or hypoxia. The results were expressed in relation to β-actin expression. The PCR reaction was carried out in an ABI 7500 thermal cycler (ABI, Foster City, CA).
Western Blot
Protein expression of Bnip3 and Pdk1 were analyzed by Western Blot as described (17). Briefly, total proteins in cardiomyocyte lysates were resolved using 4–12% Nupage gel (Invitrogen, Carlsbad, CA) and transferred to PVDF membranes. The membranes were saturated with blocking buffer (10 mM Tris, 150 mM NaCl, and 0.05% Tween-20 supplemented with 5% dry milk) for 1 h at room temperature and incubated with the respective primary antibodies: Bnip3 (Abcam, Inc, Cambridge, MA), Pdk1 (Cell Singling Technology, Beverly, CA), and β-actin (Abcam, Inc, Cambridge, MA). The membranes were then washed five times with TBST (Tris-buffered saline supplemented with 0.05% Tween-20) followed by incubation with an appropriate secondary antibody (Santa Cruz Biotechnology, Santa Cruz, CA) conjugated with horseradish peroxidase for 1 h at room temperature. The membranes were again washed five times with TBST and probed using ECL (Amersham, Piscataway, NJ), and autoradiographed.
ATP assay
Mouse cardiomyocytes were subjected to hypoxia (1% oxygen) for 24 hr or normoxia, and quantitative determination of total ATP was performed by a bioluminescence assay (ATP determination kit; Invitrogen, Carlsbad, CA). The assay employed recombinant firefly luciferase and its substrate D-luciferin. Briefly reaction solution containing luciferase and luciferin are plated and background luminescence measured. ATP standard solution or sample containing ATP was added to respective wells and luminescence was measured. After subtracting the background luminescence, ATP concentration was deduced from the standard curve and normalized to total protein concentration.
RESULTS
In the present study we examined the alteration of mitochondrial gene expression in cardiomyocytes in an in vitro hypoxia model using a custom-made microarray method. Mouse cardiomyocytes were subjected to normoxia or hypoxia for 8 hr or 24 hr and the alteration in mitochondrial gene expression was assessed using the custom mitochondrial gene chip, RoMitoChip. Hypoxia was confirmed by reduction in protein-normalized ATP level (18) to 56% following 24 hr hypoxia. When the best matched probes of Gene ST 1.0 chip were compared with that of RoMitochip we obtained a good correlation (0.89) (data not shown). The mitochondrial gene chip contained genes from the nuclear as well as the mtDNA, which were reported to be important in the structure and function of the mitochondria.
Gene expression changes following hypoxia
The probesets representing 483 of the 1088 mouse probesets demonstrated significant changes (p<0.05) in expression levels following hypoxia at least at one of the three time intervals tested (0hr vs 8hr, 0 hr vs 24 hr, or 8 hr vs 24 hr) (Supplementary Table 1). When the expression levels of these genes at 8 hr were compared with that at normoxia, there were 263 probe sets with decreased expression and 220 probesets showed an increase (Supplementary Table 1). At 24 hr, when compared to normoxia, 201 probe sets showed increased expression while 282 registered a decrease. When the genes with the most altered expression levels were sorted, the expression of 27 genes were upregulated by 2-fold or more (Table 1) when 21 genes were downregulated by at least 50% at 24 hr following hypoxia (Table 2). Among the top five genes that demonstrated significant upregulation at 24hr were pyruvate dehydrogenase kinase, isoenzyme 1 (pdk1), cytochrome c oxidase subunit iv isoform 2 (Cox4i2), bcl2/adenovirus e1b interacting protein 1 (Bnip3), adenylate kinase 3 alpha-like 1 (Ak3l1) and aldolase 3, (Aldoc).
Table 1.
Gene expression increased more than 2-fold following 24 hr hypoxia
| Gene Symbol |
Fold Change |
Gene Name |
|---|---|---|
| Pdk1 | 21.5 | pyruvate dehydrogenase kinase, isoenzyme 1 |
| Cox4i2 | 16.4 | cytochrome c oxidase subunit iv isoform 2 |
| Bnip3 | 10.4 | bcl2/adenovirus e1b interacting protein 1, nip3 |
| Ak3l1 | 9.2 | adenylate kinase 3 alpha-like 1 |
| Aldoc | 5.7 | aldolase 3, c isoform |
| Cox7a1 | 4.6 | cytochrome c oxidase, subunit viia 1 |
| Slc2a3 | 3.4 | solute carrier family 2 (facilitated glucose transporter), member 3 |
| Mthfd1l | 3.3 | methylenetetrahydrofolate dehydrogenase (nadp+ dependent) 1-like |
| Clybl | 3.3 | citrate lyase beta like |
| Stard4 | 3.2 | riken cdna 4632419c16 gene |
| Cav1 | 3.1 | caveolin, caveolae protein 1 |
| Prelid1 | 2.5 | riken cdna 2610524g07 gene |
| Acot1 | 2.4 | acyl-coa thioesterase 1 |
| Gldc | 2.4 | dna segment, chr 19, wayne state university 57, expressed |
| Acss2 | 2.4 | acetyl-coa synthetase |
| Acsl3 | 2.4 | acyl-coa synthetase long-chain family member 3 |
| Me2 | 2.3 | malic enzyme 2, nad(+)-dependent, mitochondrial |
| Hk1 | 2.3 | hexokinase 1 |
| Bnip3l | 2.3 | bcl2/adenovirus e1b interacting protein 3-like |
| Elovl6 | 2.3 | elovl family member 6, elongation of long chain fatty acids (yeast) |
| Lonp1 | 2.3 | protease, serine, 15 |
| Ndufaf1 | 2.2 | nadh dehydrogenase (ubiquinone) 1 alpha subcomplex, assembly factor 1 |
| Mrps18c | 2.2 | mitochondrial ribosomal protein s18c |
| Gpi1 | 2.1 | glucose phosphate isomerase 1 |
| Pkm2 | 2.1 | pyruvate kinase, muscle |
| Vdac1 | 2.1 | voltage-dependent anion channel 1 |
| Dpysl2 | 2.0 | dihydropyrimidinase-like 2 |
Table 2.
Gene expression decreased more than 50 % (0.5-fold) following 24 hr hypoxia
| Gene Symbol |
Fold Change |
Gene Name |
|---|---|---|
| Pmaip1 | 0.2 | phorbol-12-myristate-13-acetate-induced protein 1 |
| Nr1d2 | 0.2 | nuclear receptor subfamily 1, group d, member 2 |
| Perp | 0.3 | perp, tp53 apoptosis effector |
| Gcdh | 0.4 | glutaryl-coenzyme a dehydrogenase |
| Cd24a | 0.4 | cd24a antigen |
| Abca1 | 0.4 | atp-binding cassette, sub-family a (abc1), member 1 |
| Gclc | 0.4 | glutamate-cysteine ligase, catalytic subunit |
| Maoa | 0.4 | monoamine oxidase a |
| Rnasel | 0.4 | ribonuclease l (2', 5'-oligoisoadenylate synthetase-dependent) |
| Bdh1 | 0.4 | 3-hydroxybutyrate dehydrogenase, type 1 |
| Bid | 0.4 | bh3 interacting domain death agonist |
| Car5b | 0.4 | carbonic anhydrase 5b, mitochondrial |
| Mterfd3 | 0.4 | mterf domain containing 3 |
| Htr2b | 0.4 | 5-hydroxytryptamine (serotonin) receptor 2b |
| Slc25a20 | 0.5 | solute carrier family 25 (mitochon. carnitine/acylcarnitine translocase),20 |
| Cpt1c | 0.5 | carnitine palmitoyltransferase 1c |
| mdm2 | 0.5 | transformed mouse 3t3 cell double minute 2 |
| Pdk4 | 0.5 | pyruvate dehydrogenase kinase, isoenzyme 4 |
| Slc12a2 | 0.5 | solute carrier family 12, member 2 |
| Hcls1 | 0.5 | hematopoietic cell specific lyn substrate 1 |
| Ass1 | 0.5 | argininosuccinate synthetase 1 |
The expression patterns of several genes were dynamic over the 24 hr period. There were 24 such genes, the expression of which were significantly changed (p<0.05) at all three different time intervals tested, 0 hr (normoxia) vs 8 hr, 0 hr vs 24 hr and 8 hr vs 24 hr. Among these genes were Vdac1, Bnip3 and mt-CO3 (Fig 1). Vdac1 and Bnip3 showed an increased expression, 2- and 10-fold respectively at 24 hr following hypoxia. Mt-CO3 demonstrated a decrease in expression at 8 hr. The increased expression of a subset of genes, Bnip3 and pdk1, were further confirmed by real time PCR (Fig 2).
Figure 1. Gene expression significantly altered at all three time intervals.
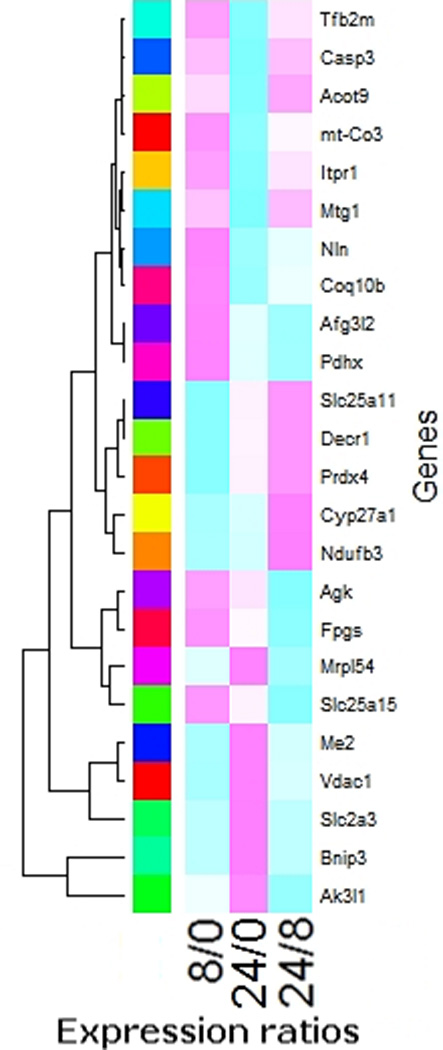
The expression levels of a total of 24 genes were altered significantly at all three time intervals tested: 0 vs 8 hr (8/0), 0 vs 24 hr (24/0) and 8 hr vs 24 hr (24/8). Red color shows increased and green color shows decreased expression level.
Figure 2. Expression of Bnip3 and Pdk1 mRNA following hypoxia.
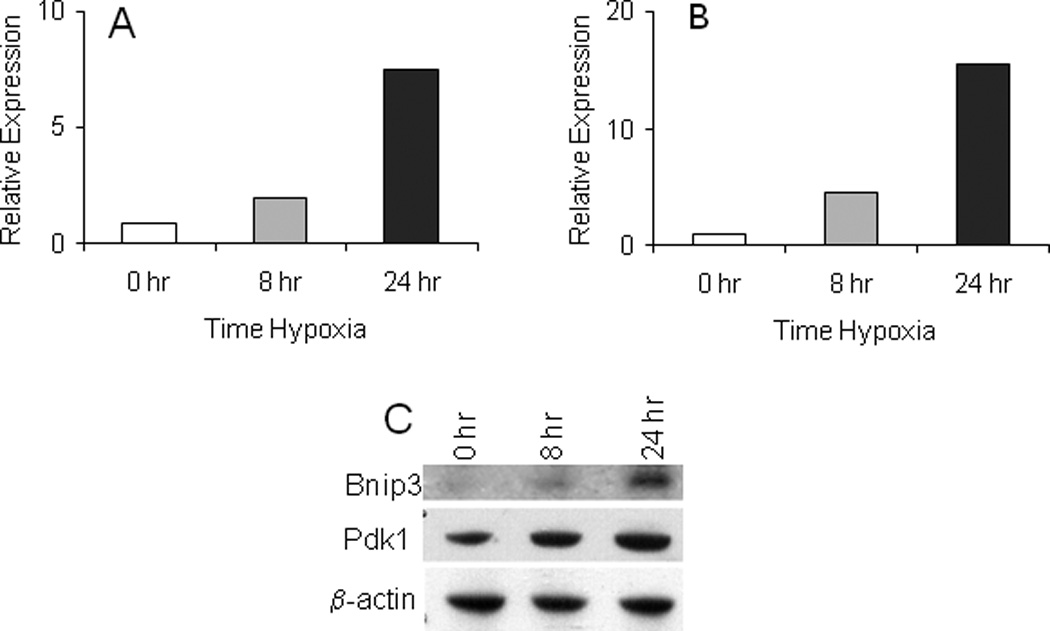
The mRNA transcript levels of Bnip3 (A) and Pdk1 (B) following 0, 8 or 24 hr hypoxia were determined by Taqman real-time PCR. Relative expression was calculated in relation to the expression level of β-actin which was used as the normalization control. The values shown are mean of two observations in one experiment. C. Western blot of Bnip3 and Pdk1 protein expression at 0, 8 and 24 hr; β-actin served as control. For details, see methods section.
Alteration of genes on the mtDNA following hypoxia
When the expression profile of genes on the mtDNA was analyzed, two clusters of genes were evident, those that increased at 24 hr and those that decreased at 24 hr. The expression of 26 of 46 probesets representing the 37 mtDNA transcripts changed significantly following the hypoxic exposure. These 26 probesets represented 23 genes, considering the duplicate probe sets for Tn, Te and Tw (transcripts for asparagine, glutamic acid and tryptophan tRNA). The 23 genes included both protein coding mRNA as well as several tRNAs. As seen in Fig 3, when almost all the tRNAs were increased at 24 hr, the levels of most of the protein coding transcripts were decreased from the basal level.
Figure 3. mtDNA gene alteration following hypoxia.
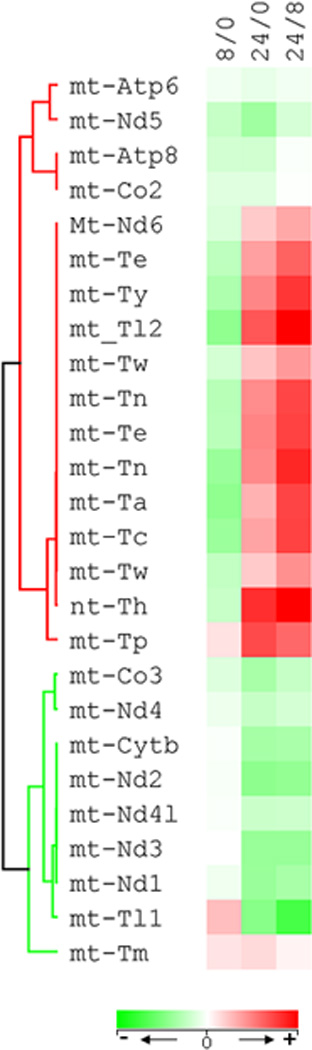
The expression of 26 of the 46 mtDNA transcripts demonstrated significant alteration at one of the three time intervals tested: 0 vs 8 hr (8/0), 0 vs 24 hr (24/0) and 8 hr vs 24 hr (24/8). The heat map illustrates the expression level of these genes in fold changes in relation to normoxic (0 hr hypoxia) condition at 0 hr vs 8 hr and 8 hr vs 24 hr.
DISCUSSION
The information on molecular changes occurring in mitochondria of the cardiomyocytes following conditions such as hypoxia is important in understanding the molecular basis of the pathobiology associated with low oxygen conditions(1; 2; 19). Studies have shown that alterations in activity or expression of transcription factors acting on nuclear DNA mediate the shifts in energy production and substrate utilization (11; 20; 21). In one recent investigation of quantitative relationships between gene expression and left ventricular hypertrophy, metabolic genes involved in various mitochondrial energy production mechanisms were reported to be reduced with increased left ventricular size (22). Therefore, the nuclear-mitochondrial cross-talk is an essential factor in maintaining energy balance and mitochondrial function within the cell.
It is important to note that genes on the H or L strand of mtDNA are transcribed as a single polycistronic RNA, which is then cleaved and polyadenylated. As extensive studies have shown functional autonomy for H and L strand transcriptions, the well-studied cis-acting elements and less known trans-acting (nuclear encoded) elements that affect mtDNA transcription can influence relative transcription of each strand. Also, polycistronic transcription of each strand does not ensure equimolar quantities of mRNA species to be derived from the respective strands (23; 24). This is because of varying known and unknown factors that control the generation and stability of each mRNA through systematic cleavage and polyadenylation. Such factors vary with cellular compartments, organisms and the environment (23; 24). This is reaffirmed by experimental observations as reported by Piechota et al (2006) of up to 10 fold difference in the steady state levels among mt mRNA transcripts and their widely varying decay rates(25).
When the gene symbols for the 483 probesets, the expression of which were significantly altered following hypoxia in cardiomyocytes, were analyzed using DAVID (NIH, Bethesda, MD) to cluster them in functional pathways, among the most represented pathways were, apoptosis (43 genes) oxidative phosphorylation (40 genes) followed by those involved in fatty acid oxidation (20 genes). Among the most upregulated genes following 24 hr hypoxia were hypoxia regulated genes such as Bnip3 (10 fold at 24 hr and 3 fold at 8 hr), Aldoc (5.6 fold at 24 hr) and Pdk1 (21 fold at 24 hr and 3.6 fold at 8 hr). The significant augmentation of Bnip3 is consistent with previous finding by (26) that chronic hypoxia induced the expression and accumulation of Bnip3 mRNA and overexpression of Bnip3 activated cardiac myocyte death (26). Consistent with this, was the observation of a set of 43 apoptosis related genes to be significantly altered following 24 hr hypoxia (Fig 4). Further it is also suggested that autophagy following hypoxic insult may be mediated by Bnip3 (27). Therefore, the 10-fold increased expression of Bnip3 transcript following hypoxic exposure of cardiomyocytes is an indication of its role in cell death under low oxygen conditions. Bnip3 is reported to be able to kill cardiomyocytes through caspase-dependent apoptosis as well as in a manner that does not require caspase activation, but involve mitochondrial permeability transition (1). Bnip3 is also reported to interact with survival protein, Bcl2 suggesting that Bcl2 could suppress the death inducing activity of Bnip3 (28). In our experiments Bcl2 was also significantly (p<0.05) upregulated, by 2 and 1.4 fold respectively, following 8 and 24 hr hypoxic exposure (Supplementary Table 1). The interaction of Bnip3 with other genes as reported in literature was created using the program Pathway Architecture and is shown in Fig 5. As seen in this illustration, sp1 transcription factor, which may function independent of HIF-1a, is down regulated following hypoxia in cardiomyocytes, and is consistent with the lack of upregulation of Akt, the upregulation of which is dependent on sp1.
Figure 4. Regulation of apoptosis related genes following hypoxia.
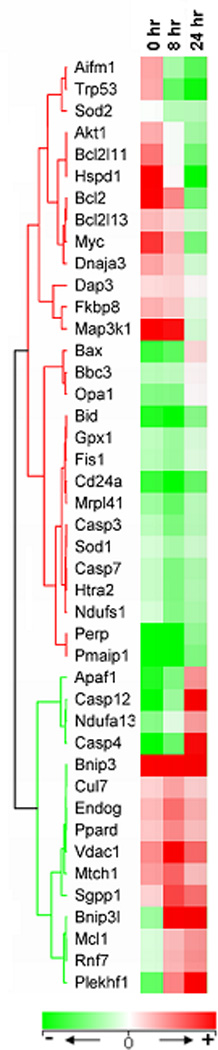
Genes among the 483 probesets that demonstrated significant alteration at each time point tested (0, 8 hr and 24 hr) following hypoxia, were analyzed using DAVID. 43 genes were found to be related to apoptosis function. The heat map illustrates the expression level of these genes in log2 ratios at 0 hr, 8 hr and 24 hr.
Figure 5. Bnip3 gene interaction.
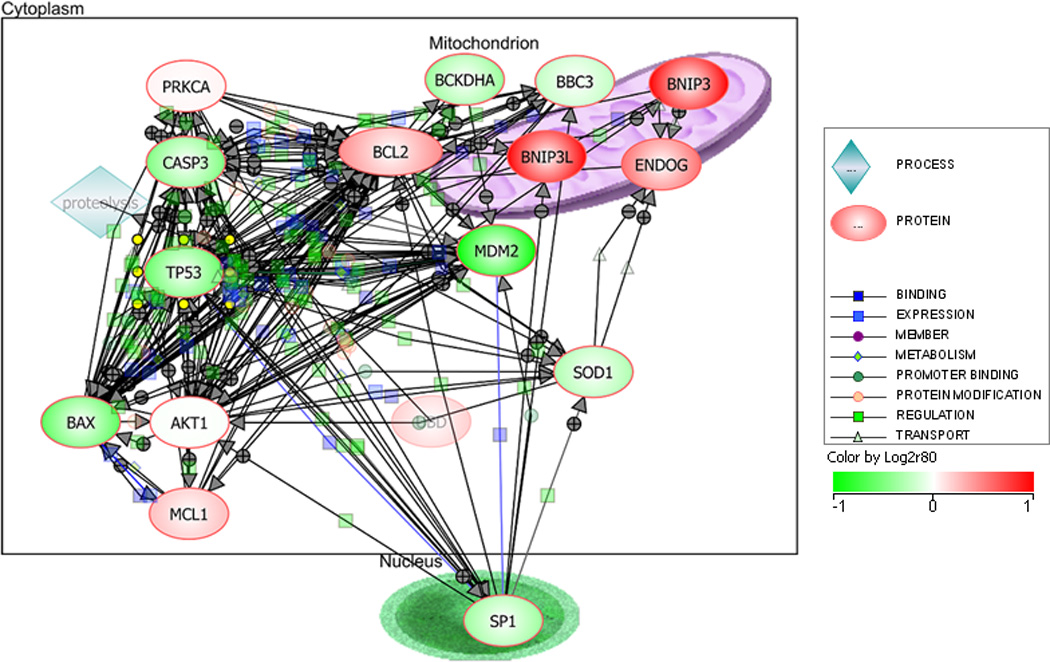
The interaction of Bnip3 reported in the literature was explored and illustrated using the program Pathway Architect (Agilent, Santa Clara, CA
Bnip3 induced cell death is also characterized by increased production of ROS. The enzyme superoxide dismutase (Sod) plays a key role in scavenging the ROS generated. Both the cytosolic (Sod1) and the mitochondrial (Sod2) isoforms of Sod were significantly decreased (P<0.05) at the end of 24 hr hypoxic exposure of cardiomyocytes. We used gene specific knockout mice heterozygous for Sod2 mutation (Sod2+/−) and their wild type littermates to test mitochondrial gene alterations and observed the aberrant expression of only a few genes in the left ventricles of these mice (data not shown). It may be noted that though a mitochondrial deficiency is reported in the Sod2 heterozygous mice, these mice do not exhibit any pathology, whereas the Sod2 null mice do not survive .
Glycolysis versus mitochondrial oxidation
Under hypoxic conditions cells augment glycolysis to compensate for the reduced ATP synthesis, the observed increase of the alodolase (Aldoc) and another key enzyme in the glycolytic pathway, hexokinase 1 (HK1), further establishes the promotion of glycolysis (Table 1). The increased glycolytic flux demands an increased expression of genes involved in glycolysis. In fact seven of 10 genes involved in glycolytic process and altered significantly in our experiments, were upregulated following hypoxia (Table 3). Further, increased Pdk1 inactivates pyruvate dehydrogenase (Pdh) enzyme complex by phosphorylation. Pdh converts pyruvate to acetyl CoA and therefore, its inhibition slows down mitochondrial oxidation preventing excess ROS production (29). Additionally, among the most upregulated genes, Aldoc, Bnip3, HK1 and Pdk1 are known to be directly regulated by HIF-1α and their expression levels continued to remain increased even after 24 hours. HIF-1 is an oxygen sensing transcription factor that initiates transcription of an array of genes during hypoxic insult (30; 31).These results clearly indicate the effect of hypoxia in promoting glycolysis while reducing ATP production through mitochondrial oxidation in cardiomyocytes subjected to hypoxia. This metabolic adaptation is critical for the function of cardiomyocytes in low oxygen states as observed in conditions involving reduced blood flow in coronary arteries. The results described above also demonstrate the inhibition of pyruvate catabolism and respiration in cardiomyocytes, following hypoxia, as observed in other cell types (29). In a B cell line it has been shown that active suppression of the TCA cycle and shunting of pyruvate to lactate via inactivation of Pdh by Pdk1 is required for cell survival under prolonged hypoxic conditions (29). Forced expression of Pdk1 by the same investigators inhibited hypoxia-induced apoptosis in the absence of HIF1. These experiments demonstrate the critical role that Pdk1 plays under hypoxic conditions in conserving cellular energy and considering the significant upregulation of this gene in cardiomyocytes subjected to hypoxia, we speculate a similar function for Pdk1 in the heart.
Table 3.
Glycolytic genes with significantly altered expression following 24 hr hypoxia
| Gene Symbol |
Fold Change |
Gene Name |
|---|---|---|
| Aldoc | 5.6 | aldolase 3, c isoform |
| Hk1 | 2.3 | hexokinase 1 |
| Pkm2 | 2.1 | pyruvate kinase, muscle |
| Gpi1 | 2.1 | glucose phosphate isomerase 1 |
| Hk2 | 1.6 | hexokinase 2 |
| Mdh1 | 1.6 | malate dehydrogenase 1, nad (soluble) |
| Dlat | 1.03 | ihydrolipoamide s-acetyltransferase (e2 component of pyruvate dehydrogenase complex) |
| Pdha1 | 0.8 | pyruvate dehydrogenase e1 alpha 1 |
| Ogdh | .78 | oxoglutarate dehydrogenase (lipoamide) |
| Dhtkd1 | .55 | dehydrogenase e1 and transketolase domain containing 1 |
The expression pattern of the transcripts originating from mtDNA was unexpected and not observed so far. Though the reason for the increase of the levels of tRNAs of mtDNA is not clear, it is likely due to altered translational regulation following hypoxia. It is known that hypoxia can alter translational regulation, enhancing the translation of specific genes (32). In response to hypoxic conditions, cells reduce their overall rate of mRNA translation; but individual mRNA species are effected to highly varying degrees, with some even translationally stimulated under these conditions (32; 33). The elevated levels of tRNAs is likely complementing the increased translation of specific genes that are needed for cell survival, as well as allowing cells to function at a low energy supply state. When almost all the tRNAs located on mtDNA and the expression levels were significantly altered were increased at 24 hours, the transcript level of most of the mtDNA-derived protein coding mRNA were decreased (Fig 3). However, at 24 hr the expression levels of the tRNAs began decreasing from the elevated levels at 8 hr. Therefore, when the expression profiles of genes for the mtDNA were analyzed, two clusters of genes were evident, those that increased at 24 hr and those that decreased at 24 hr. Further studies on the molecular basis of the dichotomy in changes in the expression of transcripts of mtDNA origin would be useful in further understanding this novel observation following hypoxia.
The hypoxia induced expression profile of mitochondria associated genes clearly demonstrates the activation of both death and survival pathways in cardiomyocytes. The novel observation on the differential expression profile of tRNA transcripts versus protein coding transcripts of mtDNA may be attributed to transcription-translation regulation to enable the survival of the cells.
Supplementary Material
Acknowledgements
Supported by AG 031440(RR), UAB HSF GEF Scholar Award (RR) and RO1 GM37127 (IC). Thanks to Dr Ambalavanan Namasivayam, Department of Pediatrics, UAB for providing the hypoxia incubator facility (R01 HL092906). The microarray experiments were carried out in the Heflin Center for Genomic Science supported by the UAB Comprehensive Cancer Center Core Grant 5P30 CA13148-37 by Dr. Michael Crowley.
References
- 1.Dorn GW, Kirshenbaum LA. Cardiac reanimation: targeting cardiomyocyte death by BNIP3 and NIX/BNIP3L. Oncogene. 2008;27(Suppl 1):S158–S167. doi: 10.1038/onc.2009.53. [DOI] [PubMed] [Google Scholar]
- 2.Graham RM, Frazier DP, Thompson JW, Haliko S, Li H, Wasserlauf BJ, Spiga MG, Bishopric NH, Webster KA. A unique pathway of cardiac myocyte death caused by hypoxia-acidosis. J Exp Biol. 2004;207:3189–3200. doi: 10.1242/jeb.01109. [DOI] [PubMed] [Google Scholar]
- 3.Huss JM, Kelly DP. Mitochondrial energy metabolism in heart failure: a question of balance. J Clin Invest. 2005;115:547–555. doi: 10.1172/JCI200524405. [DOI] [PMC free article] [PubMed] [Google Scholar]
- 4.Wang M, Tsai BM, Turrentine MW, Mahomed Y, Brown JW, Meldrum DR. p38 mitogen activated protein kinase mediates both death signaling and functional depression in the heart. Ann Thorac Surg. 2005;80:2235–2241. doi: 10.1016/j.athoracsur.2005.05.070. [DOI] [PubMed] [Google Scholar]
- 5.Argaud L, Loufouat J, Gateau-Roesch O, Gomez L, Robert D, Ovize M. Persistent inhibition of mitochondrial permeability transition by preconditioning during the first hours of reperfusion. Shock. 2008;30:552–556. doi: 10.1097/SHK.0b013e31816a1c1c. [DOI] [PubMed] [Google Scholar]
- 6.Piel DA, Deutschman CS, Levy RJ. Exogenous cytochrome C restores myocardial cytochrome oxidase activity into the late phase of sepsis. Shock. 2008;29:612–616. doi: 10.1097/SHK.0b013e318157e962. [DOI] [PMC free article] [PubMed] [Google Scholar]
- 7.Muravchick S, Levy RJ. Clinical implications of mitochondrial dysfunction. Anesthesiology. 2006;105:819–837. doi: 10.1097/00000542-200610000-00029. [DOI] [PubMed] [Google Scholar]
- 8.Hsieh YC, Choudhry MA, Yu HP, Shimizu T, Yang S, Suzuki T, Chen J, Bland KI, Chaudry IH. Inhibition of cardiac PGC-1alpha expression abolishes ERbeta agonist-mediated cardioprotection following trauma-hemorrhage. FASEB J. 2006;20:1109–1117. doi: 10.1096/fj.05-5549com. [DOI] [PubMed] [Google Scholar]
- 9.Chen Q, Lesnefsky EJ. Depletion of cardiolipin and cytochrome c during ischemia increases hydrogen peroxide production from the electron transport chain. Free Radic Biol Med. 2006;40:976–982. doi: 10.1016/j.freeradbiomed.2005.10.043. [DOI] [PubMed] [Google Scholar]
- 10.Hsieh YC, Yu HP, Suzuki T, Choudhry MA, Schwacha MG, Bland KI, Chaudry IH. Upregulation of mitochondrial respiratory complex IV by estrogen receptor-beta is critical for inhibiting mitochondrial apoptotic signaling and restoring cardiac functions following trauma-hemorrhage. J Mol Cell Cardiol. 2006;41:511–521. doi: 10.1016/j.yjmcc.2006.06.001. [DOI] [PubMed] [Google Scholar]
- 11.Mootha VK, Bunkenborg J, Olsen JV, Hjerrild M, Wisniewski JR, Stahl E, Bolouri MS, Ray HN, Sihag S, Kamal M, Patterson N, Lander ES, Mann M. Integrated analysis of protein composition, tissue diversity, and gene regulation in mouse mitochondria. Cell. 2003;115:629–640. doi: 10.1016/s0092-8674(03)00926-7. [DOI] [PubMed] [Google Scholar]
- 12.Forner F, Foster LJ, Campanaro S, Valle G, Mann M. Quantitative proteomic comparison of rat mitochondria from muscle, heart, and liver. Mol Cell Proteomics. 2006;5:608–619. doi: 10.1074/mcp.M500298-MCP200. [DOI] [PubMed] [Google Scholar]
- 13.Schlick NE, Jensen-Seaman MI, Orlebeke K, Kwitek AE, Jacob HJ, Lazar J. Sequence analysis of the complete mitochondrial DNA in 10 commonly used inbred rat strains. Am J Physiol Cell Physiol. 2006;291:C1183–C1192. doi: 10.1152/ajpcell.00234.2006. [DOI] [PubMed] [Google Scholar]
- 14.Raju R, Dalakas MC. Gene expression profile in the muscles of patients with inflammatory myopathies: effect of therapy with IVIg and biological validation of clinically relevant genes. Brain. 2005;128:1887–1896. doi: 10.1093/brain/awh518. [DOI] [PubMed] [Google Scholar]
- 15.Irizarry RA, Hobbs B, Collin F, Beazer-Barclay YD, Antonellis KJ, Scherf U, Speed TP. Exploration, normalization, and summaries of high density oligonucleotide array probe level data. Biostatistics. 2003;4:249–264. doi: 10.1093/biostatistics/4.2.249. [DOI] [PubMed] [Google Scholar]
- 16.Hochberg Y, Benjamini Y. More powerful procedures for multiple significance testing. Stat Med. 1990;9:811–818. doi: 10.1002/sim.4780090710. [DOI] [PubMed] [Google Scholar]
- 17.Jian B, Hsieh CH, Chen J, Choudhry M, Bland K, Chaudry I, Raju R. Activation of endoplasmic reticulum stress response following trauma-hemorrhage. Biochim Biophys Acta. 2008;1782:621–626. doi: 10.1016/j.bbadis.2008.08.007. [DOI] [PMC free article] [PubMed] [Google Scholar]
- 18.Webster KA, Discher DJ, Kaiser S, Hernandez O, Sato B, Bishopric NH. Hypoxia-activated apoptosis of cardiac myocytes requires reoxygenation or a pH shift and is independent of p53. J Clin Invest. 1999;104:239–252. doi: 10.1172/JCI5871. [DOI] [PMC free article] [PubMed] [Google Scholar]
- 19.Schneeberger S, Kuznetsov AV, Seiler R, Renz O, Meusburger H, Mark W, Brandacher G, Margreiter R, Gnaiger E. Mitochondrial ischemia-reperfusion injury of the transplanted rat heart: improved protection by preservation versus cardioplegic solutions. Shock. 2008;30:365–371. doi: 10.1097/SHK.0b013e318164f09f. [DOI] [PubMed] [Google Scholar]
- 20.Razeghi P, Young ME, Alcorn JL, Moravec CS, Frazier OH, Taegtmeyer H. Metabolic gene expression in fetal and failing human heart. Circulation. 2001;104:2923–2931. doi: 10.1161/hc4901.100526. [DOI] [PubMed] [Google Scholar]
- 21.Sack MN, Rader TA, Park S, Bastin J, McCune SA, Kelly DP. Fatty acid oxidation enzyme gene expression is downregulated in the failing heart. Circulation. 1996;94:2837–2842. doi: 10.1161/01.cir.94.11.2837. [DOI] [PubMed] [Google Scholar]
- 22.Mirotsou M, Dzau VJ, Pratt RE, Weinberg EO. Physiological genomics of cardiac disease: quantitative relationships between gene expression and left ventricular hypertrophy. Physiol Genomics. 2006;27:86–94. doi: 10.1152/physiolgenomics.00028.2006. [DOI] [PubMed] [Google Scholar]
- 23.Fernandez-Silva P, Enriquez JA, Montoya J. Replication and transcription of mammalian mitochondrial DNA. Exp Physiol. 2003;88:41–56. doi: 10.1113/eph8802514. [DOI] [PubMed] [Google Scholar]
- 24.Taanman JW. The mitochondrial genome: structure, transcription, translation and replication. Biochim Biophys Acta. 1999;1410:103–123. doi: 10.1016/s0005-2728(98)00161-3. [DOI] [PubMed] [Google Scholar]
- 25.Piechota J, Tomecki R, Gewartowski K, Szczesny R, Dmochowska A, Kudla M, Dybczynska L, Stepien PP, Bartnik E. Differential stability of mitochondrial mRNA in HeLa cells. Acta Biochim Pol. 2006;53:157–168. [PubMed] [Google Scholar]
- 26.Kubasiak LA, Hernandez OM, Bishopric NH, Webster KA. Hypoxia and acidosis activate cardiac myocyte death through the Bcl-2 family protein BNIP3. Proc Natl Acad Sci U S A. 2002;99:12825–12830. doi: 10.1073/pnas.202474099. [DOI] [PMC free article] [PubMed] [Google Scholar]
- 27.Hamacher-Brady A, Brady NR, Gottlieb RA, Gustafsson AB. Autophagy as a protective response to Bnip3-mediated apoptotic signaling in the heart. Autophagy. 2006;2:307–309. doi: 10.4161/auto.2947. [DOI] [PubMed] [Google Scholar]
- 28.Ray R, Chen G, Vande VC, Cizeau J, Park JH, Reed JC, Gietz RD, Greenberg AH. BNIP3 heterodimerizes with Bcl-2/Bcl-X(L) and induces cell death independent of a Bcl-2 homology 3 (BH3) domain at both mitochondrial and nonmitochondrial sites. J Biol Chem. 2000;275:1439–1448. doi: 10.1074/jbc.275.2.1439. [DOI] [PubMed] [Google Scholar]
- 29.Kim JW, Tchernyshyov I, Semenza GL, Dang CV. HIF-1-mediated expression of pyruvate dehydrogenase kinase: a metabolic switch required for cellular adaptation to hypoxia. Cell Metab. 2006;3:177–185. doi: 10.1016/j.cmet.2006.02.002. [DOI] [PubMed] [Google Scholar]
- 30.Jian B, Nagineni CN, Meleth S, Grizzle W, Bland KI, Chaudry IH, Raju R. Anosmin-1 involved in neuronal migration is hypoxia inducible and cancer regulated. Cell Cycle. 2009 doi: 10.4161/cc.8.22.10066. In Press. [DOI] [PMC free article] [PubMed] [Google Scholar]
- 31.Semenza GL. Regulation of vascularization by hypoxia-inducible factor 1. Ann N Y Acad Sci. 2009;1177:2–8. doi: 10.1111/j.1749-6632.2009.05032.x. [DOI] [PubMed] [Google Scholar]
- 32.Koritzinsky M, Wouters BG. Hypoxia and regulation of messenger RNA translation. Methods Enzymol. 2007;435:247–273. doi: 10.1016/S0076-6879(07)35013-1. [DOI] [PubMed] [Google Scholar]
- 33.van den BT, Magagnin MG, Savelkouls K, Lambin P, Koritzinsky M, Wouters BG. Regulation of Cited2 expression provides a functional link between translational and transcriptional responses during hypoxia. Radiother Oncol. 2007;83:346–352. doi: 10.1016/j.radonc.2007.04.026. [DOI] [PubMed] [Google Scholar]
Associated Data
This section collects any data citations, data availability statements, or supplementary materials included in this article.