Abstract
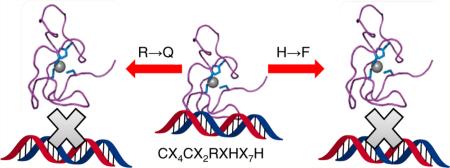
Neural Zinc Finger Factor-1 (NZF-1) and Myelin Transcription Factor 1 (MyT1) are two homologous nonclassical zinc finger (ZF) proteins that are involved in the development of the central nervous system (CNS). Both NZF-1 and MyT1 contain multiple ZF domains, each of which contains an absolutely conserved Cys2His2Cys motif. All three cysteines and the second histidine have been shown to coordinate Zn(II); however, the role of the first histidine remains unresolved. Using a functional form of NZF-1 that contains two ZF domains (NZF-1-F2F3), mutant proteins in which each histidine was sequentially mutated to a phenylalanine were prepared to determine the role(s) of the histidine residues in DNA recognition. When the first histidine is mutated, the protein binds Zn(II) in an analogous manner to the native protein. Surprisingly, this mutant does not bind to target DNA (β-RAR), suggesting that the noncoordinating histidine is critical for sequence selective DNA recognition. The first histidine will coordinate Zn(II) when the second histidine is mutated; however, the overall fold of the protein is perturbed leading to abrogation of DNA binding. NZF-1-F2F3 selectively binds to a specific DNA target sequence (from β-RAR) with high affinity (nM); while its homologue MyT1 (MyT1-F2F3), which is 92% identical to NZF-1-F2F3, binds to this same DNA sequence nonspecifically. A single, nonconserved amino acid residue in NZF-1-F2F3 is shown to be responsible for this high affinity DNA binding to β-RAR. When this residue (arginine) is engineered into the MyT1-F2F3 sequence, the affinity for β-RAR DNA increases.
INTRODUCTION
Zinc fingers (ZFs) are proteins which contain modular domains that coordinate zinc ions via a combination of four cysteine and/or histidine ligands to fold into specific three-dimensional structures.1–10 ZFs have critically important biological roles in modulating transcription and translation and show a remarkable capacity for highly selective nucleic acid recognition.3,4,10 Zinc proteins are ubiquitous in eukaryotes: approximately 10% of the human genome encodes for these proteins.5,8,11–13 ZF proteins can be separated into at least 14 different classes which are distinguished by the ligand set involved in Zn(II) coordination and, when known, the three-dimensional structure of the folded form. The best-studied class of ZFs are the “classical” ZFs.5,9,14 Classical ZFs utilize a Cys2His2 (CCHH) ligand set to coordinate zinc ions and fold into a recognizable α helix/β sheet structure upon zinc ion coordination.1–10 The remaining classes of ZFs are often referred to as “nonclassical” ZFs.1 Nonclassical ZFs are known to be involved in key biological processes including mRNA processing, viral replication, tumor suppression, and neuronal development;1,15–19 yet, in many instances little is known about their biochemical roles and consequently, the biophysical basis of nucleic acid recognition for these nonclassical ZF proteins is unresolved.
One important class of nonclassical ZFs are the Cys2His2Cys or CCHHC ZFs.1 This is a small class of ZFs, with only three homologues identified to date: Neural Zinc Finger Factor-1 (NZF-1), Myelin Transcription Factor 1 (MyT1), and Suppression of Tumorigenicity 18 (ST18).18–31 NZF-1 and MyT1 are found in the Central Nervous System (CNS) where they play crucial roles in development: misregulation of either protein is associated with schizophrenia, mental retardation, brain cancer, and periventricular leukomalacia (a common cause of cerebral palsy).21,29,30,32–41 NZF-1 is found in neurons where it regulates β-retinoic acid receptor (β-RAR) expression, while MyT1 is found in oligodendrocytes, where it regulates expression of the proteolipid protein (PLP), the main myelin forming protein in the CNS, as well as 2′3′-cyclic-nucleotide 3′phosphodiesterase (CNP) and opalin.26,29,30,42
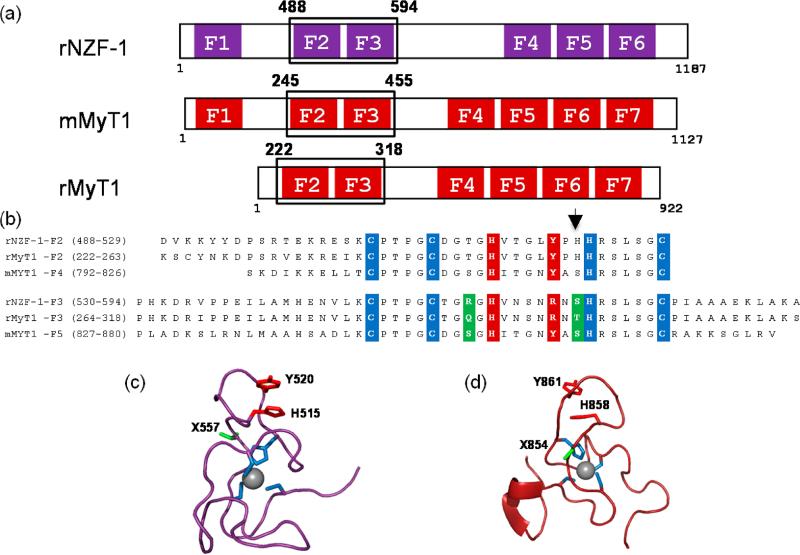
Both NZF-1 and MyT1 contain multiple CCHHC ZF domains, which are arranged in clusters of 1, 2, 3, or 4 ZFs (Figure 1a).1,29,30 The amino acid sequences of each ZF domain within either NZF-1 or MyT1 are remarkably similar, with upward of 100% sequence identity (Figure 1b). This is unusual for a ZF protein. Typically, amino acid sequence similarity for homologous ZF domains is more limited and restricted to the coordinating ligands and a few additional amino acids that are involved in stabilizing the protein fold or promoting nucleic acid recognition.8,10
Figure 1.
(a) Cartoon diagram of the ZF topology of NZF-1 and MyT1 from Rattus norvegicus, r or Mus musculus, m. The individual ZF domains are boxed, and the alignment shows the ZF clustering. Note, F1 is absent in rMyT1. (b) Alignment of the amino acid sequences of NZF-1-F2F3, MyT1-F2F3, and MyT1-F4F5. The cysteine and histidine ligands that can directly coordinate Co(II) and Zn(II) are highlighted in blue, the amino acid residues that have been proposed to participate in a stacking interaction with the noncoordinating histidine are highlighted in red, and the amino acid residues that differ between the individual ZF domains of NZF-1 and MyT1 are highlighted in green. The arrow indicates the position of the nonconserved histidine residue. (c) The NMR solution structure of F2 of rNZF-1 (PDBID IPXE). The highlighted amino acids are color coded to match those that are highlighted in panel 1b. The amino acid position found to be important for NZF-1-F2F3 DNA recognition is indicated in green (X557). (d) NMR solution structure of finger 5 mMyT1 (PDBID 2JYD). Highlighted amino acids are color coded to match those in panel 1b. The amino acid position that has been shown to be important for NZF-1-F2F3 DNA recognition are highlighted in green. The structural figures were generated in Pymol.
The presence of five potential metal binding ligands (CCHHC) in the ZF sequences of NZF-1 and MyT1 suggests a possible five-coordinate geometry at the zinc(II) sites;43 however, structural and optical data for singular and double ZF domains of both NZF-1 and MyT1 all indicate four coordinate geometry at the Zn(II) sites.18,19,25,27 The structural data for NZF-1 and MyT1 are limited to NMR structures of singular domains (F2 for NZF-1 and F5 for MyT1) (Figure 1c and 1d).19,27 In both structures, Zn(II) is coordinated to three cysteine residues and one histidine residue in a tetrahedral geometry.19,27 The coordinating histidine is the second conserved histidine in the sequence. The first histidine has been proposed to participate in a stacking interaction with a highly conserved tyrosine, stabilizing the structure.19 Interestingly, when the second histidine is mutated to a non-coordinating alanine or glutamine, for either F2 or F3 of NZF-1, Zn(II) coordination is still observed, indicating that the coordinating ligands are flexible.19,25 The effect of this alternate coordination on function is not known.
A bona fide DNA target sequence has only been identified for a two ZF domain (F2+F3) of NZF-1.18 This target sequence is from the β-RAR promoter, and it contains an AAGTT sequence that has been proposed to be a general recognition sequence for all CCHHC-type ZFs.18,24,29 However, a two ZF domain construct of MyT1 exhibits significantly weaker affinity for β-RAR DNA when compared to the affinity measured for NZF-1 (F2+F3).27,28 This suggests that MyT1 recognizes a different DNA sequence than NZF-1. In addition, the promoter sequences of the genes that are recognized by MyT1 do not always contain the AAGTT sequence, consistent with the idea that MyT1 binds to a different DNA recognition sequence than NZF-1.42
From these studies, two important questions have emerged: (1) what is the functional role of the noncoordinating histidine that is present in all CCHHC type ZF proteins? and (2) How do NZF-1 and MyT1 discriminate between DNA targets, given the high sequence similarity between individual ZFs? By preparing mutations of the two-ZF-domain peptide construct of NZF-1 (F2+F3), for which a bona fide DNA target sequence has been identified, and of the analogous two-ZF domain construct of MyT1 (F2+F3), we have discovered that the noncoordinating histidine is critical for DNA recognition. We also report that a singular residue that is not conserved between the NZF-1-F2F3 and MyT1-F2F3 sequences is responsible for “high affinity” (nanomolar) DNA binding. These results allow us to propose a unique paradigm of zinc ion mediated DNA recognition for this novel class of nonclassical ZF proteins.
EXPERIMENTAL SECTION
Nomenclature
All peptide constructs of NZF-1 and MyT1 are named based upon the ZFs included within their sequences. For example, the construct that contains the second (F2) and third (F3) ZF of NZF-1 from Rattus norvegicus (R. norvegicus) is named NZF-1-F2F3. Mutant peptides in which either the first (H515 and H559) or second (H523 and H567) histidine have been mutated to a phenylalanine are referred to as CCFHC or CCHFC, respectively.
Expression and Purification of NZF-1-F2F3 and MyT1-F2F3
A DNA fragment corresponding to residues 487–584 of full length NZF-1 from R. norvegicus, termed NZF-1-F2F3 ligated into a pET15b vector in which the hexahistidine tag had been removed was a generous gift of Dr. Holly Cymet (Stevenson University). The DNA corresponding to residues 222–318 of full length MyT1, termed MyT1-F2F3, was amplified via the Polymerase Chain Reaction (PCR) from a R. norvegicus brain cDNA library, which was a generous gift from Dr. Anthony Lanahan (Yale University). This DNA fragment was ligated into a pET15b vector using the restriction sites NcoI and BamHI so that the hexahistidine tag was removed. To express these constructs, the vectors were transformed into BL21(DE3) Escherichia coli (Novagen) cells, and the cells were then grown in Luria–Bertani (LB) broth with 100 μg/mL ampicillin at 37 °C until midlog phase. Protein expression was induced with 1 mM isopropyl β-D-1-thiogalactopyranoside (IPTG) and grown for 4 h post induction. Cells were harvested by centrifugation at 7800g for 15 min at 4 °C. Cell pellets were resuspended in 25 mM Tris [tris(hydroxymethyl)-aminomethane] at pH 8.0, 100 μM ZnCl2, and 5 mM dithiothreitol (DTT) containing a mini ethylenediaminetetraacetic acid (EDTA) free protease inhibitor tablet (Roche) and lysed via sonication on a Misonix Sonicator 3000. Cell debris were removed by centrifugation at 12100g for 15 min at 4 °C. The bacterial supernatant was loaded onto a SP Sepharose Fast Flow column (Sigma), and the protein was eluted with a stepwise salt gradient from 0 to 1 M KCl. The cysteine thiols of the protein were reduced by incubation with 10 mM tris(2-carboxyethyl)phosphine (TCEP) (Thermo) at room temperature for 30 min. The protein was further purified via High Performance Liquid Chromatography (HPLC) using a Waters 626 LC system and a Waters Symmetry Prep 300 C18 7 μm reverse phase column with an acetonitrile gradient containing 0.1% trifluoroacetic acid (TFA). The proteins eluted at 29% acetonitrile with 0.1% TFA. The collected proteins were dried using a Thermo Savant SpeedVac concentrator housed in a Coy anaerobic chamber (97% N2/3% H2).
Design of NZF-1-F2F3 and MyT1-F2F3 Mutants
Mutations of either the first or the second conserved histidine residue of NZF-1-F2F3 to phenylalanine were made using a Quikchange Mutagenesis Kit (Agilent). To create the CCFHC mutant, H515 and H559, which correspond to the first conserved histidine in each ZF, were mutated to a phenylalanine. Similarly, H523 and H567, which correspond to the second conserved histidine in each ZF, were mutated to a phenylalanine to create the CCHFC mutant. A remaining nonconserved histidine residue (amino acid 522) was mutated to an alanine to prevent any adventitious metal ion coordination. Glutamine 291 of MyT1-F2F3 was mutated to an arginine using the Quikchange Mutagenesis Kit to create the Q291R MyT1-F2F3 mutant. All mutations were confirmed using DNA sequencing at the Biopolymer/Genomics Core Facility housed at the University of Maryland School of Medicine. Expression and purification followed the procedure previously described (vide infra).
Metal Binding Studies
Metal ion titrations were performed on a PerkinElmer Lambda 25 UV–visible Spectrometer, CoCl2 and ZnCl2 were from Fisher Scientific. In a typical experiment, 20–50 μM apo-peptide was titrated with CoCl2, and the absorbance was monitored until saturation. The relative affinity of the peptides for Zn(II) were determined by monitoring the displacement of Co(II) by Zn(II) following the method developed by Berg and Merkle.14 All titrations were performed in 200 mM HEPES [4-(2-hydroxyethyl)-1-piper-azineethanesulfonic acid], 100 mM NaCl at pH 7.5. Data were fit to an appropriate binding equilibria using linear least-squares analysis (KaleidaGraph, Synergy Software).
Circular Dichroism
Far-UV Circular Dichroism (CD) was performed on a Jasco-810 Spectropolarimeter. Twenty μM of apo-peptide was prepared in 300 μL of 25 mM Sodium Phosphate, pH 7.5. Molar equivalents of either CoCl2 or ZnCl2 were added to the apo-peptide, and the spectra were measured. All spectra were collected from 190 to 260 nm, with a scan rate of 100 nm/min, at 25 °C in a 1 mm path length quartz rectangular cell (Starna Cells). A total of 5 scans were obtained for each point, and the average was displayed.
Oligonucleotide Probes
Oligonucleotides were purchased from Integrated DNA Technologies, Inc. (Coralville, IA), in their HPLC purified form. The β-RAR DNA, CACCGAAAGTTCACTC, was purchased with a 5′ end-labeled fluorescein along with its unlabeled complement. A random DNA strand, TGTTTCTGCCTCTGT, was also purchased with a 5′ end-labeled fluorescein along with its unlabeled complement. The oligonucleotides were annealed by mixing a ratio of 1.25:1 unlabeled:labeled in 10 mM Tris, pH 8.0 and 10 mM NaCl annealing buffer. The annealing mixture was placed in a water bath set to 10 °C higher than the melting temperature of the DNA strands. The annealing reaction proceeded for 5 min before the water bath was turned off and allowed to cool overnight. The resultant double-stranded oligonucleotides were quantified and stored at –20 °C.
Fluorescence Anisotropy
Fluorescence anisotropy (FA) assays were performed on an ISS PC-1 spectrofluorimeter configured in the L format. A wavelength/band-pass of 495 nm/2 nm for excitation and 517 nm/1 nm for emission were utilized. All experiments were performed in 50 mM HEPES, 100 mM NaCl at pH 7.5 in a Spectrosil far-UV quartz window fluorescence cuvette (Starna Cells). Binding reactions were performed with 10 nM fluorescently labeled DNA in the presence of 0.05 mg/mL bovine serum albumin (BSA) to prevent adherence of DNA or protein to the cuvette walls. The anisotropy, r, was monitored throughout the course of the binding assay in which protein was added in increments to the fluorescently labeled DNA. Each data point represents the average of 60 readings taken over a period of 115 s. Anisotropy values were converted to fraction bound, Fbound (fraction of DNA bound to peptide at a given DNA concentration), according to the following equation:
where rfree is the anisotropy of fluorescently labeled DNA and rbound is the anisotropy of the peptide-DNA complex at saturation. Q is the quantum yield that is applied as a correction factor to account for changes in fluorescence intensity over the course of the experiment (Q = Ibound/Ifree). Typically, Q values ranged from 0.9 to 1.0. Fbound was then plotted against peptide concentration, and the data fit to a one-site binding model:
where P is the protein concentration and D is the DNA concentration.
Generation of Sequence Logos
A “Weblogo” showing the conservation of the amino acid residues in all ZF domains (6 domains per protein) of R. norvegicus NZF-1, MyT1, and ST18 was generated using the weblogo tool found at http://weblogo.berkeley.edu. The Weblogo of classical CCHH ZFs was generated using http://prosite.expasy.org. A search of “zinc finger” was performed, and CCHH type ZFs was selected. The generated Weblogo was a result of 13,324 true positive hits from the UniProtKB/Swiss-Prot databank.44–47
RESULTS AND DISCUSSION
Functional Roles of the Two Histidine Ligands within Each ZF of NZF-1
The published NMR structural data for NZF-1 and MyT1 are limited to single finger domains of the proteins (F2 from NZF-1 and F5 from MyT1).19,27 In both of these structures, the second conserved histidine within the ZF domain serves as the Zn(II) coordinating ligand.19,27 Remarkably, when this histidine is mutated to a non-coordinating residue (either alanine or glutamine) in either the second or the third ZF domain of NZF-1, the first histidine coordinates the Zn(II) in its place, suggesting that metal ion coordination is flexible.19,25 Here, we sought to understand the functional consequences of histidine coordination in NZF-1. All of the structural and mutagenesis studies that have been published are of single ZF domains, which do not bind to target DNA with the requisite affinity (i.e., nM) to address this question.10 Thus, we prepared a series of mutant proteins of a two domain construct of NZF-1, NZF-1-F2F3, for which a high affinity DNA target sequence is known. With this construct in hand, the functional significance of each histidine residue was assessed.
The first (H515 and H559) or second (H523 and H567) conserved histidine of NZF-1-F2F3 were mutated to phenylalanines. The two mutant peptides were named CCFHC and CCHFC, respectively. A third nonconserved histidine, H522, in F2 was mutated to an alanine to prevent any metal ions binding adventitiously to this residue in the mutant peptides (Figure 1b). The choice of phenylalanine was based upon the proposal that the noncoordinating histidine is involved in a stacking interaction with a conserved tyrosine residue.19 Phenylalanine in this position should preserve this interaction.
Metal Binding Studies
To determine if the two mutant proteins, CCFHC and CCHFC, bound Zn(II), direct titrations with Co(II) and competitive titrations with Zn(II) were performed. Co(II) is routinely utilized as a spectroscopic probe for Zn(II) binding to ZFs.6,48–53 Co(II), which has a d7 electron count, exhibits distinct optical absorbances centered between 550 and 750 nm when it is coordinated to four ligands in a tetrahedral geometry.54 These absorbance bands differ based upon the ligand set that coordinates Co(II); therefore the nature of the ligands coordinating Co(II) in a given ZF can be deduced from these spectra.55 Zn(II) typically binds more tightly to ZF domains than does Co(II), due to ligand field stabilization energy (LFSE) differences.14 Thus, Zn(II) binding to ZF sites can be measured via a competitive titration of Co(II)-ZF with Zn(II) to reveal upper limit dissociation constants (Kd's) for each metal ion.14,54,56
Co(II) Direct Titrations
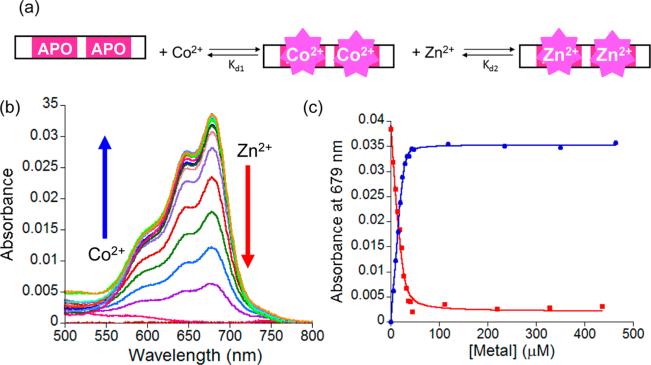
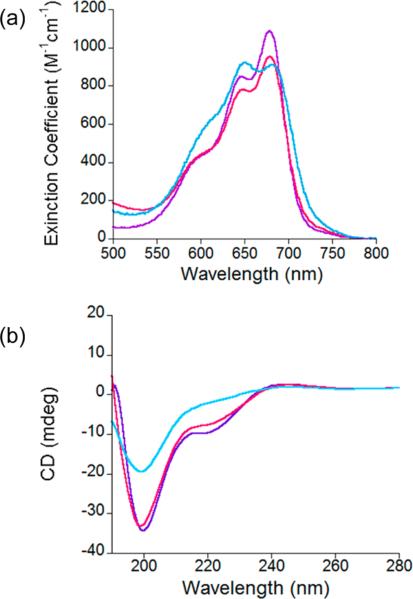
Co(II) was titrated with NZF-1-F2F3, CCFHC, and CCHFC. For all three proteins, d-d bands between 550 and 750 nm were observed as Co(II) was added with maxima centered at 590, 650, and 679 nm. These d-d bands are from the 4A2 to 4T2(P) transition for a tetrahedral geometry, and the splitting into three components is due to lowered symmetry.54,57,58 (Figure 2, Supporting Information, Figures S1 and S2). The shape of the spectra did not change during the course of each titration, indicating that Co(II) binds to the two ZF sites with equal affinities. The overall shape of the three split d-d bands for Co(II)-NZF-1-F2F3 and Co(II)-CCFHC spectra were similar; while the d-d bands for the Co(II)-CCHFC were split differently suggesting that the overall symmetry at the metal site is altered as a result of the mutation (Figure 3a). The Co(II) titration data were fit to 1:1 binding equilibria, and upper-limit Kd's of 7.0 ± 0.4 × 10⁻⁸ M, 5.2 ± 0.3 × 10⁻⁷ M, and 3.7 ± 1.2 × 10⁻⁷ M were determined for NZF-1-F2F3, CCFHC, and CCHFC, respectively. These affinities fit within the range of reported binding affinities for ZF proteins.18,25,59
Figure 2.
(a) Plot of the change in the absorption spectrum of 25 μM CCFHC between 500 and 800 nm as Co(II) is titrated. The titration was performed in 200 mM HEPES, 100 mM NaCl buffer at pH 7.5. (b) Plot of the absorption spectrum at 679 nm as a function of either added Co(II) to apo-CCFHC (blue) or added Zn(II) to Co(II)-CCFHC (red). The data were fit to appropriate binding equilibria and upper limit Kd's of 5.2 ± 0.3 × 10⁻⁷ M and 3.2 ± 0.9 × 10⁻¹⁰ M for Co(II) and Zn(II), respectively, were obtained. The solid lines represent the nonlinear least-squares fit.
Figure 3.
(a) Overlay of the absorbance spectra between 500 and 800 nm of Co(II)-NZF-1-F2F3, shown in purple, Co(II)-CCFHC, shown in pink, and Co(II)-CCHFC, shown in blue. All experiments performed in 200 mM HEPES, 100 mM NaCl, pH 7.5. (b) Overlay of the CD spectra of 20 μM Zn(II)-NZF-1-F2F3 shown in purple, 20 μM Zn(II)-CCFHC shown in pink, and 20 μM Zn(II)- CCHFC shown in blue. All experiments performed in 25 mM Sodium Phosphate, pH 7.5.
Zn(II) Titrations
To determine the affinity of Zn(II) for NZF-1-F2F3, CCFHC, and CCHFC, solutions of each protein with 10-fold excess Co(II) was titrated with Zn(II). The decrease in the d-d absorbances for the Co(II)-ZF spectra were monitored, and the data were fit to a competitive binding equilibrium. A representative fit for the CCFHC mutant is shown in Figure 2. Upper limit Kd's of 1.2 ± 0.7 × 10⁻¹⁰ M for NZF-1-F2F3, 3.2 ± 0.9 × 10⁻¹⁰ M for CCFHC, and 2.6 ± 1.2 × 10⁻⁹ M for CCHFC were determined (Figure 2b, Supporting Information, Figures S1, S2). These values fit well with those reported for other ZFs, including NZF-1 sites.18,25,59
Circular Dichroism (CD) Spectra of NZF-1-F2F3, CCFHC and CCHFC Mutants
To further characterize the effect of mutating either the coordinating or the non-coordinating histidine on the structure of NZF-1-F2F3, CD spectra of the three proteins were measured (Figure 3b and Supporting Information, Figure S3). In the absence of metal ions, all three proteins have similar spectra that are characterized by a negative signal at 200 nm, typical of a random coil.60–62 In the presence of either stoichiometric Co(II) or Zn(II), the only additional feature is a negative signal centered at 220 nM. These features were expected as the NMR structures of NZF-1 and MyT119,27 do not exhibit significant alpha helical or β sheet content, and they match spectra recently reported for a single ZF of MyT1 by Wilcox and coworkers.53 Notably, the CD spectra of the Co(II) or Zn(II) bound CCHFC mutant are slightly different than the analogous NZF-1-F2F3 and CCFHC spectra, as shown in Figure 3b and Supporting Information, Figure S3. This offers further evidence that the CCHFC mutant adopts a different fold upon metal coordination than NZF-1-F2F3 and CCFHC.
DNA Binding Studies to Define the Functional Role(s) of the Histidine Ligands
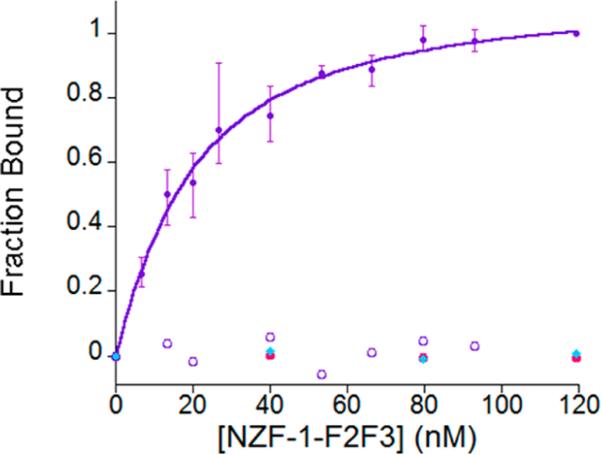
To understand the roles of the two conserved histidines residues on function, fluorescence anisotropy (FA) was utilized to measure the affinity of NZF-1-F2F3 and the two mutants, CCFHC and CCHFC for the β-retinoic acid receptor (β-RAR) recognition sequence.28,52,63–65 The native protein, NZF-1-F2F3 was expected to bind to this DNA with nanomolar affinity, based upon previous studies.28 Similarly, the CCFHC mutant, which maintains the metal coordinating histidine, was also expected to bind to this DNA target with nM affinity. In contrast, the CCHFC mutant was expected to show different DNA binding properties because the coordinating histidine has been abrogated. NZF-1-F2F3 selectively bound to β-RAR with a Kd of 1.4 ± 0.2 × 10⁻⁸ M, as expected; surprisingly, DNA binding was not observed for either mutant (Figure 4). None of the proteins bound to a random DNA sequence.
Figure 4.
Comparison of the change in anisotropy (as fraction bound) as NZF-1-F2F3, shown in closed purple circles, CCFHC, shown in closed pink circles, and CCHFC, shown in closed blue diamonds, are titrated in 10 nM fluorescently labeled β-RAR DNA. An example of a control titration (NZF-1-F2F3 with a randomized segment of DNA) is shown in open purple circles. All experiments were performed in triplicate in 50 mM HEPES, 100 mM NaCl pH 7.5.
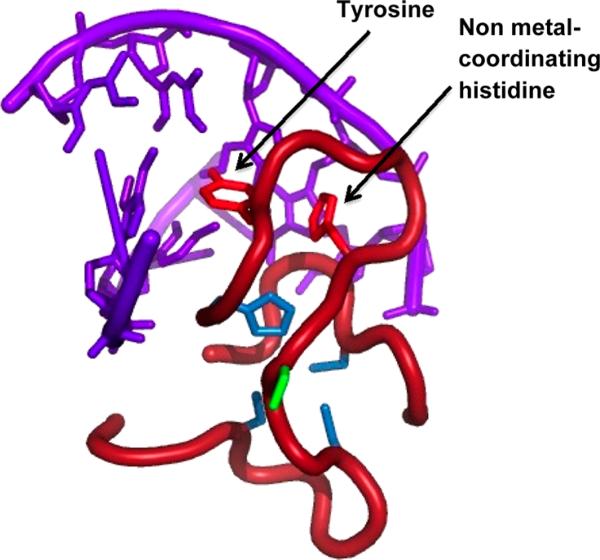
The abrogation of DNA binding for CCHFC was expected, as in this mutant Zn(II) is coordinated to a different histidine and the overall protein fold has been perturbed. However, the lack of DNA binding for the CCFHC mutant was unexpected because this mutant was designed to retain the key elements thought to be important for the protein's fold. These included the native coordinating histidine and a phenylalanine at the position of the noncoordinating histidine. From structural studies, this noncoordinating histidine had been proposed to be part of a stacking interaction with a noncoordinating tyrosine, which helps stabilize the structure (Figure 1c, Y520).19 The DNA binding studies reported here reveal that the role of this histidine is more complex than just participation in a stacking interaction. The noncoordinating histidine appears to be critical for DNA binding, and we hypothesize two potential roles for this histidine: (i) it may play a direct role in DNA recognition or (ii) it may play an indirect role in DNA binding by stabilizing a residue, such as the tyrosine it has been proposed to “stack” with, via additional bonding interactions that may have been disrupted via the mutation of the histidine residue to phenylalanine (e.g., hydrogen bonding). Although there are no structures of NZF-1 bound to DNA, Gamsjaeger and coworkers have modeled a structure for a single ZF domain of MyT1 bound to DNA with the Haddock docking program (Figure 5). In this model, both the noncoordinating histidine and the tyrosine are positioned to interact with the DNA.27 Furthermore, in some of the ZFs domains in this family, arginine is found in the place of tyrosine. Arginine often serves as a DNA recognition element in DNA binding proteins.66–68
Figure 5.
Model of mMyT1 interacting with the βRAR DNA, shown in purple (PDBID 2JX1). Metal coordinating residues shown in blue; residues shown to stack in NZF-1 structure shown in red; residue not conserved between NZF-1-F2F3 and MyT1-F2F3 shown in green. Figure generated in Pymol.
Switching the DNA Binding Properties of MyT1 to those of NZF-1
MyT1 shows a high level of sequence similarity to NZF-1, although MyT1 is found in different cells and regulates different genes than NZF-1.21,29,30 The DNA target sequence recognized by MyT1 has not yet been identified, but has been proposed to be the same target sequence as NZF-1.24 The singular report of solution-based DNA binding studies for MyT1 utilized NZF-1's β-RAR target sequence, and the reported affinities of MyT1 for this DNA sequence were weaker than the affinity of NZF-1-F2F3 for this same DNA sequence.27 It has been proposed that the motif recognized by NZF-1 within the β-RAR sequence is an AAGTT sequence.18,30 This sequence is not present in all of the promoter sequences of the genes recognized by MyT1,42 thus MyT1 likely recognizes a different DNA target than NZF-1.
Given the high sequence identity between NZF-1 and MyT1, we hypothesized that the residues that are not conserved between NZF-1 and MyT1 must determine DNA sequence selectivity. By aligning the NZF-1-F2F3 sequence with the analogous region of MyT1 (MyT1-F2F3) we found that within the ZF domains only two amino acids differ between the two sequences (Figure 1b). One of these amino acids is a serine residue in NZF-1-F2F3 and a threonine residue in MyT1-F2F3. As these amino acids have very similar properties, we hypothesized these residues would play similar functional roles. In contrast, an arginine in NZF-1-F2F3 is a glutamine in MyT1-F2F3. Arginine residues are often implicated in DNA recognition and therefore this amino acid may be the key switch for the high affinity βRAR DNA recognition by NZF-1.66–68 As such, a mutation of the glutamine in MyT1-F2F3 to arginine is predicted to result in high affinity DNA binding. To test this hypothesis, both native MyT1-F2F3 and Q291R MyT1-F2F3 were prepared and characterized.
Metal Binding and Folding Studies
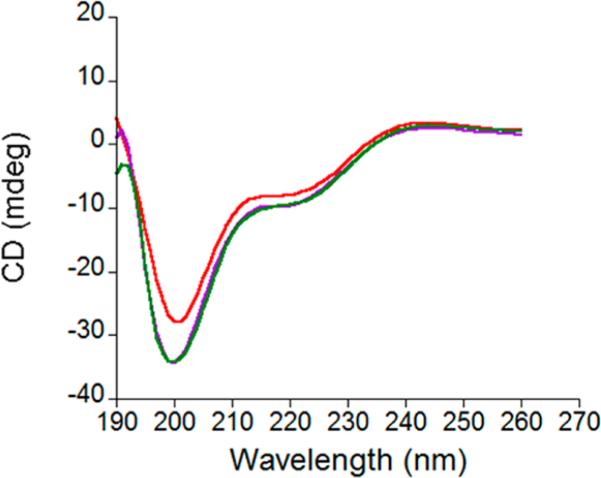
Direct Co(II) titrations and competitive Zn(II) titrations of MyT1-F2F3 and Q291R MyT1-F2F3 were performed analogously to the studies described above for NZF-1-F2F3 and its mutants. The Co(II) spectra for both proteins matched those observed for NZF-1-F2F3 and CCFHC, indicating that the same ligands are involved in metal ion coordination for both MyT1 and NZF-1 (Supporting Information, Figures S4 and S5). The Co(II) data were fit to 1:1 binding equilibria and upper-limit Kd's of 2.0 ± 1.1 × 10⁻⁷ M and 9.3 ± 1.3 × 10⁻⁸ M were determined for MyT1-F2F3 and Q291R MyT1-F2F3, respectively. The Zn(II) data were fit to a competitive equilibria, and upper-limit Kd's of 3.6 ± 2.0 × 10⁻¹⁰ M and 2.1 ± 0.8 × 10⁻⁹ M were determined. The CD spectra were also similar to that reported for NZF-1-F2F3. (Figure 6 and Supporting Information, Figure S6)
Figure 6.
Overlay of the CD spectra of 20 μM Zn(II)-NZF-1-F2F3 shown in purple, 20 μM Zn(II)-MyT1-F2F3 shown in red, and 20 μM Zn(II)-Q291R MyT1-F2F3 shown in green. All experiments performed in 20 mM Sodium Phosphate, pH 7.5.
DNA Binding Studies of MyT1-F2F3 and Q291R MyT1-F2F3 with β-RAR
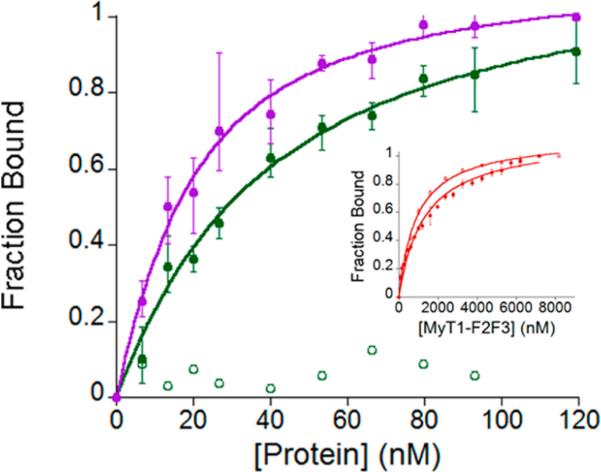
We first performed FA studies of MyT1-F2F3 with β-RAR, to quantify the binding affinity (Figure 7). The only previous study of MyT1-F2F3 with this DNA target utilized surface plasmon resonance (SPR), and only a semiquantitative affinity was reported.27 As predicted, MyT1-F2F3 bound to β-RAR with a significantly weaker affinity, Kd of 1.3 ± 0.11 × 10⁻⁶ M, than the affinity of NZF-1-F2F3 for this same target (Kd of 1.4 ± 0.2 × 10⁻⁸ M). Notably, the affinity of MyT1-F2F3 for a random sequence of DNA that was used as a control was on the same order of magnitude (Kd = 9.1 ± 0.5 × 10⁻⁷ M) as its measured affinity for β-RAR. This indicates that the binding observed for MyT1-F2F3 with β-RAR is nonspecific. In contrast, when the affinity of the mutated MyT1 protein Q291R for β-RAR was measured, a Kd of 3.3 ± 0.12 × 10⁻⁸ M was determined. Remarkably, this affinity is on the same order of magnitude as the affinity of NZF-1-F2F3 for this DNA target. Thus, mutation of a single glutamine in MyT1-F2F3 to arginine results in high affinity, specific DNA binding to β-RAR which is on par with the native NZF-1-F2F3′s binding affinity.
Figure 7.
Change in anisotropy (as fraction bound) as NZF-1-F2F3, shown in closed purple circles, and Q291R MyT1-F2F3, shown in closed green circles, are titrated into β-RAR DNA. Example of the control as Q291R MyT1-F2F3 is titrated into a random segment of DNA is shown in open green circles. Inset shows change in anisotropy as MyT1-F2F3 is titrated in β-RAR (closed red circles) and random DNA segment (open red circles). Ten nM fluorescently labeled DNA used for all experiments. All experiments were performed in triplicate in 50 mM HEPES, 100 mM NaCl pH 7.5.
CONCLUSIONS
The results of the studies reported herein provide key insight into two overarching questions regarding NZF-1 and MyT1 function: (1) what is the functional role of the noncoordinating histidine that is present in all CCHHC type ZF proteins? and (2) How do NZF-1 and MyT1 discriminate between DNA targets, given the high sequence identity between individual ZFs? By mutating the coordinating and noncoordinating histidine residues in a functional form of NZF-1 (NZF-1-F2F3), we discovered that both histidines must be present in order for the protein to recognize target DNA. Thus, the noncoordinating histidine plays a critical role in DNA recognition—possibly via a stacking interaction with DNA bases or via the stabilization of other essential DNA interacting residues. In addition, we have discovered that MyT1-F2F3 can be programmed to bind to the NZF-1-F2F3 DNA target with high affinity and specificity via a single point mutation.
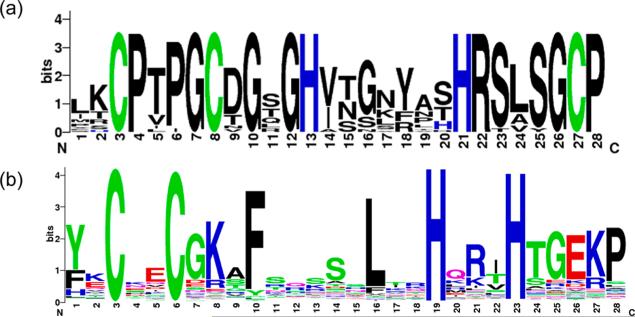
NZF-1 and MyT1 each contain multiple, highly similar ZF domains that are organized in clusters (Figure 1a).29,30 The DNA recognition sequence has only been defined for the F2F3 cluster of NZF-1.18 The role(s) of the additional ZF clusters found in NZF-1 in DNA recognition are not known, and bona fide DNA target sequences for MyT1 have not yet been identified. Given the high degree of sequence similarity between the ZFs, it is tempting to propose that the ZF domains all recognize the same DNA sequence. However, as we report here, MyT1-F2F3 does not bind to NZF-1-F2F3′s DNA target sequences with high affinity. Similarly, MacKay and coworkers have reported weaker binding of MyT1-F4F5 for NZF-1-F2F3′s DNA target.27 Our discovery that a single point mutation at one of the few less-conserved residues renders MyT1-F2F3 capable of binding to NZF-1's target DNA suggests that the ZF clusters each recognize different DNA target sequences, and it is the handful of less-conserved residues within the amino acid sequence of the ZF domains that determine which DNA sequence is recognized (Figure 8a). This proposed model of DNA target recognition by NZF-1 and MyT1 contrasts the DNA binding paradigm that is operative for classical Cys2His2 ZFs. For classical ZFs, only a few amino acids are conserved between the sequences of homologues, and these conserved amino acids are essential for the fold of the protein.69 There is great variability in the sequence of classical ZFs outside of these residues, and this variability allows for alternate DNA recognition properties (Figure 8b). Four key positions in these ZF domains have been implicated in being essential in DNA recognition, while single mutations in the ZF domains of the NZF-1 proteins appear to completely alter DNA recognition properties.10 The CCHHC family of nonclassical ZF proteins are emerging as a new type of ZF protein in which ZF domains contain highly conserved residues that are likely important for protein fold but do not appear to drive DNA recognition. Rather, it is the few less-conserved residues that appear to dictate this DNA recognition. As such, these CCHHC ZFs appear to utilize a completely different mode of DNA recognition than the classical ZF proteins. Further work to understand the determinants of DNA recognition for the other ZF domains of both NZF-1 and MyT1 are in progress.
Figure 8.
(a) Weblogo generated from alignment of all CCHHC domains from NZF-1, MyT1, and ST18. Height of amino acid residue corresponds to degree of conservation (b) ExPASy output of all known CCHH ZF domains.
Supplementary Material
ACKNOWLEDGMENTS
We are grateful to the NSF (NSF CAREER Award # CHE-0747863, S.L.J.M.) and the NINDS (National Research Service Award # F31NS074768, A.N.B.) for support of this research.
Footnotes
Supporting Information
Further details are given in Figures S1–S6. This material is available free of charge via the Internet at http://pubs.acs.org.
The authors declare no competing financial interest.
REFERENCES
- 1.Michalek JL, Besold AN, Michel SL. Dalton Trans. 2011;40:12619–12632. doi: 10.1039/c1dt11071c. [DOI] [PubMed] [Google Scholar]
- 2.Matthews JM, Sunde M. IUBMB Life. 2002;54:351–355. doi: 10.1080/15216540216035. [DOI] [PubMed] [Google Scholar]
- 3.Desjarlais JR, Berg JM. Proc. Natl. Acad. Sci. U. S. A. 1992;89:7345–7349. doi: 10.1073/pnas.89.16.7345. [DOI] [PMC free article] [PubMed] [Google Scholar]
- 4.Laity JH, Lee BM, Wright PE. Curr. Opin. Struct. Biol. 2001;11:39–46. doi: 10.1016/s0959-440x(00)00167-6. [DOI] [PubMed] [Google Scholar]
- 5.Klug AQ. Rev. Biophys. 2010;43:1–21. doi: 10.1017/S0033583510000089. [DOI] [PubMed] [Google Scholar]
- 6.Berg JM, Godwin HA. Annu. Rev. Biophys. Biomol. Struct. 1997;26:357–371. doi: 10.1146/annurev.biophys.26.1.357. [DOI] [PubMed] [Google Scholar]
- 7.Berg JM. J. Biol. Chem. 1990;265:6513–6516. [PubMed] [Google Scholar]
- 8.Maret W, Li Y. Chem. Rev. 2009;109:4682–4707. doi: 10.1021/cr800556u. [DOI] [PubMed] [Google Scholar]
- 9.Berg JM, Shi Y. Science. 1996;271:1081–1085. doi: 10.1126/science.271.5252.1081. [DOI] [PubMed] [Google Scholar]
- 10.Jantz D, Amann BT, Gatto GJ, Jr., Berg JM. Chem. Rev. 2004;104:789–799. doi: 10.1021/cr020603o. [DOI] [PubMed] [Google Scholar]
- 11.Quintal SM, dePaula QA, Farrell NP. Metallomics. 2011;3:121–139. doi: 10.1039/c0mt00070a. [DOI] [PubMed] [Google Scholar]
- 12.Andreini C, Bertini I, Cavallaro G. PLoS One. 2011;6:e26325. doi: 10.1371/journal.pone.0026325. [DOI] [PMC free article] [PubMed] [Google Scholar]
- 13.Andreini C, Banci L, Bertini I, Rosato A. J. Proteome Res. 2006;5:196–201. doi: 10.1021/pr050361j. [DOI] [PubMed] [Google Scholar]
- 14.Berg JM, Merkle DL. J. Am. Chem. Soc. 1989;111:3759–3761. [Google Scholar]
- 15.Darlix JL, Godet J, Ivanyi-Nagy R, Fosse P, Mauffret O, Mely Y. J. Mol. Biol. 2011;410:565–581. doi: 10.1016/j.jmb.2011.03.037. [DOI] [PubMed] [Google Scholar]
- 16.Lin ZS, Chu HC, Yen YC, Lewis BC, Chen YW. PLoS One. 2012;7:e43593. doi: 10.1371/journal.pone.0043593. [DOI] [PMC free article] [PubMed] [Google Scholar]
- 17.Virden RA, Thiele CJ, Liu Z. Mol. Cell. Biol. 2012;32:1518–1528. doi: 10.1128/MCB.06039-11. [DOI] [PMC free article] [PubMed] [Google Scholar]
- 18.Berkovits HJ, Berg JM. Biochemistry. 1999;38:16826–16830. doi: 10.1021/bi991433l. [DOI] [PubMed] [Google Scholar]
- 19.Berkovits-Cymet HJ, Amann BT, Berg JM. Biochemistry. 2004;43:898–903. doi: 10.1021/bi035159d. [DOI] [PubMed] [Google Scholar]
- 20.Yang J, Siqueira MF, Behl Y, Alikhani M, Graves DT. FASEB J. 2008;22:3956–3967. doi: 10.1096/fj.08-111013. [DOI] [PMC free article] [PubMed] [Google Scholar]
- 21.Kim JG, Armstrong RC, v Agoston D, Robinsky A, Wiese C, Nagle J, Hudson LD. J. Neurosci. Res. 1997;50:272–290. doi: 10.1002/(SICI)1097-4547(19971015)50:2<272::AID-JNR16>3.0.CO;2-A. [DOI] [PubMed] [Google Scholar]
- 22.Vana AC, Lucchinetti CF, Le TQ, Armstrong RC. Glia. 2007;55:687–697. doi: 10.1002/glia.20492. [DOI] [PMC free article] [PubMed] [Google Scholar]
- 23.Romm E, Nielsen JA, Kim JG, Hudson LD. J. Neurochem. 2005;93:1444–1453. doi: 10.1111/j.1471-4159.2005.03131.x. [DOI] [PMC free article] [PubMed] [Google Scholar]
- 24.Bellefroid EJ, Bourguignon C, Hollemann T, Ma Q, Anderson DJ, Kintner C, Pieler T. Cell. 1996;87:1191–1202. doi: 10.1016/s0092-8674(00)81815-2. [DOI] [PubMed] [Google Scholar]
- 25.Blasie CA, Berg JM. Inorg. Chem. 2000;39:348–351. doi: 10.1021/ic990913y. [DOI] [PubMed] [Google Scholar]
- 26.Nielsen JA, Berndt JA, Hudson LD, Armstrong RC. Mol. Cell. Neurosci. 2004;25:111–123. doi: 10.1016/j.mcn.2003.10.001. [DOI] [PubMed] [Google Scholar]
- 27.Gamsjaeger R, Swanton MK, Kobus FJ, Lehtomaki E, Lowry JA, Kwan AH, Matthews JM, Mackay JP. J. Biol. Chem. 2008;283:5158–5167. doi: 10.1074/jbc.M703772200. [DOI] [PubMed] [Google Scholar]
- 28.Besold AN, Lee SJ, Michel SL, Sue NL, Cymet HJ. J. Biol. Inorg. Chem. 2010;15:583–590. doi: 10.1007/s00775-010-0626-1. [DOI] [PubMed] [Google Scholar]
- 29.Kim JG, Hudson LD. Mol. Cell. Biol. 1992;12:5632–5639. doi: 10.1128/mcb.12.12.5632. [DOI] [PMC free article] [PubMed] [Google Scholar]
- 30.Jiang Y, Yu VC, Buchholz F, O'Connell S, Rhodes SJ, Candeloro C, Xia YR, Lusis AJ, Rosenfeld MG. J. Biol. Chem. 1996;271:10723–10730. doi: 10.1074/jbc.271.18.10723. [DOI] [PubMed] [Google Scholar]
- 31.Yee KS, Yu VC. J. Biol. Chem. 1998;273:5366–5374. doi: 10.1074/jbc.273.9.5366. [DOI] [PubMed] [Google Scholar]
- 32.Weiner JA, Chun J. J. Comp. Neurol. 1997;381:130–142. doi: 10.1002/(sici)1096-9861(19970505)381:2<130::aid-cne2>3.0.co;2-4. [DOI] [PubMed] [Google Scholar]
- 33.Mukasa A, Ueki K, Ge X, Ishikawa S, Ide T, Fujimaki T, Nishikawa R, Asai A, Kirino T, Aburatani H. Brain. Pathol. 2004;14:34–42. doi: 10.1111/j.1750-3639.2004.tb00495.x. [DOI] [PMC free article] [PubMed] [Google Scholar]
- 34.Riley B, Thiselton D, Maher BS, Bigdeli T, Wormley B, McMichael GO, Fanous AH, Vladimirov V, O'Neill FA, Walsh D, Kendler KS. Mol. Psychiatry. 2010;15:29–37. doi: 10.1038/mp.2009.109. [DOI] [PMC free article] [PubMed] [Google Scholar]
- 35.Stevens SJ, van Ravenswaaij-Arts CM, Janssen JW, Klein Wassink-Ruiter JS, van Essen AJ, Dijkhuizen T, van Rheenen J, Heuts-Vijgen R, Stegmann AP, Smeets EE, Engelen JJ. Am. J. Med. Genet. A. 2011;155A:2739–2745. doi: 10.1002/ajmg.a.34274. [DOI] [PubMed] [Google Scholar]
- 36.Matsushita F, Kameyama T, Marunouchi T. Mech. Dev. 2002;118:209–213. doi: 10.1016/s0925-4773(02)00250-2. [DOI] [PubMed] [Google Scholar]
- 37.Gogate N, Verma L, Zhou JM, Milward E, Rusten R, O'Connor M, Kufta C, Kim J, Hudson L, Dubois-Dalcq M. J. Neurosci. 1994;14:4571–4587. doi: 10.1523/JNEUROSCI.14-08-04571.1994. [DOI] [PMC free article] [PubMed] [Google Scholar]
- 38.Hirayama A, Oka A, Ito M, Tanaka F, Okoshi Y, Takashima S. Dev. Brain Res. 2003;140:85–92. doi: 10.1016/s0165-3806(02)00585-0. [DOI] [PubMed] [Google Scholar]
- 39.Kroepfl T, Petek E, Schwarzbraun T, Kroisel PM, Plecko B. Clin. Genet. 2008;73:492–495. doi: 10.1111/j.1399-0004.2008.00982.x. [DOI] [PubMed] [Google Scholar]
- 40.Law AJ, Lipska BK, Weickert CS, Hyde TM, Straub RE, Hashimoto R, Harrison PJ, Kleinman JE, Weinberger DR. Proc. Natl. Acad. Sci. U. S. A. 2006;103:6747–6752. doi: 10.1073/pnas.0602002103. [DOI] [PMC free article] [PubMed] [Google Scholar]
- 41.Nielsen JA, Hudson LD, Armstrong RC. J. Cell. Sci. 2002;115:4071–4079. doi: 10.1242/jcs.00103. [DOI] [PubMed] [Google Scholar]
- 42.Aruga J, Yoshikawa F, Nozaki Y, Sakaki Y, Toyoda A, Furuichi T. J. Neurochem. 2007;102:1533–1547. doi: 10.1111/j.1471-4159.2007.04583.x. [DOI] [PubMed] [Google Scholar]
- 43.Cotton FA, Wilkinson GA. Advanced Inorganic Chemistry. Wiley; New York: 1988. [Google Scholar]
- 44.Sigrist CJ, Cerutti L, de Castro E, Langendijk-Genevaux PS, Bulliard V, Bairoch A, Hulo N. Nucleic Acids Res. 2010;38:D161–D166. doi: 10.1093/nar/gkp885. [DOI] [PMC free article] [PubMed] [Google Scholar]
- 45.Schneider TD, Stephens RM. Nucleic Acids Res. 1990;18:6097–6100. doi: 10.1093/nar/18.20.6097. [DOI] [PMC free article] [PubMed] [Google Scholar]
- 46.Crooks GE, Hon G, Chandonia JM, Brenner SE. Genome Res. 2004;14:1188–1190. doi: 10.1101/gr.849004. [DOI] [PMC free article] [PubMed] [Google Scholar]
- 47.Consortium TU. Nucleic Acids Res. 2012;40:D71–D75. [Google Scholar]
- 48.Ghering AB, Shokes JE, Scott RA, Omichinski JG, Godwin HA. Biochemistry. 2004;43:8346–8355. doi: 10.1021/bi035673j. [DOI] [PubMed] [Google Scholar]
- 49.Payne JC, Rous BW, Tenderholt AL, Godwin HA. Biochemistry. 2003;42:14214–14224. doi: 10.1021/bi035002l. [DOI] [PubMed] [Google Scholar]
- 50.Guerrerio AL, Berg JM. Biochemistry. 2004;43:5437–5444. doi: 10.1021/bi0358418. [DOI] [PubMed] [Google Scholar]
- 51.Worthington MT, Amann BT, Nathans D, Berg JM. Proc. Natl. Acad. Sci. U. S. A. 1996;93:13754–13759. doi: 10.1073/pnas.93.24.13754. [DOI] [PMC free article] [PubMed] [Google Scholar]
- 52.Lee SJ, Michalek JL, Besold AN, Rokita SE, Michel SL. Inorg.Chem. 2011;50:5442–5450. doi: 10.1021/ic102252a. [DOI] [PubMed] [Google Scholar]
- 53.Rich AM, Bombarda E, Schenk AD, Lee PE, Cox EH, Spuches AM, Hudson LD, Kieffer B, Wilcox DE. J. Am. Chem. Soc. 2012;134:10405–10418. doi: 10.1021/ja211417g. [DOI] [PubMed] [Google Scholar]
- 54.Bertini I, Luchinat C. Adv. Inorg. Biochem. 1984;6:71–111. [PubMed] [Google Scholar]
- 55.Krizek BA, Amann BT, Kilfoil VJ, Merkle DL, Berg JM. J. Am. Chem. Soc. 1991;113:4518–4523. [Google Scholar]
- 56.Frankel AD, Berg JM, Pabo CO. Proc. Natl. Acad. Sci. U. S. A. 1987;84:4841–4845. doi: 10.1073/pnas.84.14.4841. [DOI] [PMC free article] [PubMed] [Google Scholar]
- 57.Corwin DT, Gruff ES, Koch SA. Inorg. Chim. Acta. 1988;151:5–6. [Google Scholar]
- 58.Lever ABP. Inorganic Electronic Spectroscopy. 2nd ed. Elsevier; Amsterdam, The Netherlands: 1984. [Google Scholar]
- 59.Magyar JS, Godwin HA. Anal. Biochem. 2003;320:39–54. doi: 10.1016/s0003-2697(03)00281-1. [DOI] [PubMed] [Google Scholar]
- 60.de Paula QA, Mangrum JB, Farrell NP. J. Inorg. Biochem. 2009;103:1347–1354. doi: 10.1016/j.jinorgbio.2009.07.002. [DOI] [PubMed] [Google Scholar]
- 61.Ranjbar B, Gill P. Chem. Biol. Drug Des. 2009;74:101–120. doi: 10.1111/j.1747-0285.2009.00847.x. [DOI] [PubMed] [Google Scholar]
- 62.Burke CJ, Sanyal G, Bruner MW, Ryan JA, LaFemina RL, Robbins HL, Zeft AS, Middaugh CR, Cordingley MG. J. Biol. Chem. 1992;267:9639–9644. [PubMed] [Google Scholar]
- 63.Lakowicz J. Principles of Fluorescence Spectroscopy. Springer; New York: 1999. [Google Scholar]
- 64.Michalek JL, Lee SJ, Michel SL. J. Inorg. Biochem. 2012;112:32–38. doi: 10.1016/j.jinorgbio.2012.02.023. [DOI] [PubMed] [Google Scholar]
- 65.Michel SL, Guerrerio AL, Berg JM. Biochemistry. 2003;42:4626–4630. doi: 10.1021/bi034073h. [DOI] [PubMed] [Google Scholar]
- 66.Luscombe NM, Laskowski RA, Thornton JM. Nucleic Acids Res. 2001;29:2860–2874. doi: 10.1093/nar/29.13.2860. [DOI] [PMC free article] [PubMed] [Google Scholar]
- 67.Choo Y, Klug A. Proc. Natl. Acad. Sci. U. S. A. 1994;91:11163–11167. doi: 10.1073/pnas.91.23.11163. [DOI] [PMC free article] [PubMed] [Google Scholar]
- 68.Rohs R, Jin X, West SM, Joshi R, Honig B, Mann RS. Annu. Rev. Biochem. 2010;79:233–269. doi: 10.1146/annurev-biochem-060408-091030. [DOI] [PMC free article] [PubMed] [Google Scholar]
- 69.Michael SF, Kilfoil VJ, Schmidt MH, Amann BT, Berg JM. Proc. Natl. Acad. Sci. U. S. A. 1992;89:4796–4800. doi: 10.1073/pnas.89.11.4796. [DOI] [PMC free article] [PubMed] [Google Scholar]
Associated Data
This section collects any data citations, data availability statements, or supplementary materials included in this article.


