Abstract
Ion-exchange chromatography (IEX) relies on electrostatic interactions between the adsorbent and the adsorbate, and is used extensively in protein purification. Conventional IEX utilizes ligands that are singly charged and randomly dispersed over the adsorbent, creating a heterogeneous distribution of potential adsorption sites. Clustered-charge ion exchangers exhibit higher affinity, capacity, and selectivity than their dispersed-charge counterparts of the same total charge density. In the present work, we monitored the transport behavior of an anionic protein near clustered-charge adsorbent surfaces using Fluorescence Correlation Spectroscopy. We can resolve protein free diffusion, hindered diffusion and association with bare glass, agarose-coated, and agarose-clustered peptide surfaces, demonstrating that this method can be used to understand and ultimately optimize clustered charge adsorbent and other surface interactions at the molecular scale.
Keywords: Ion-Exchange Chromatography, Protein Adsorption, Diffusion, Anion Exchange Matrix, Clustered-Charge Ion Exchange Adsorbent
Chromatographic separation of proteins is a ubiquitous processing step in both pharmaceutical manufacturing and basic research applications. Ion-exchange chromatography (IEX), which relies on electrostatic interactions between charged adsorbents and protein molecules, is the most widely used chromatographic protein purification process [Kubota, et. al. 1996]. IEX can separate mixtures of biomolecules with high selectivity, including molecules with small differences in charge [Cano, et. al. 2005; Chen, et. al. 2011; Fu, et. al. 2007; Mueller 1990]. Conventional IEX utilizes ligands that are singly charged and randomly dispersed over the adsorbent [Mueller 1990], creating a landscape of widely varying charge density, including isolated charges not expected to contribute to adsorption, and randomly-created patches of high local charge expected to dominate adsorption [Jennissen and Heilmeyer 1975].
We previously showed that immobilizing charges in uniform groups creates “clustered-charge ion exchangers” which are more effective than their dispersed adsorbent counterparts with the same total charge density [Chen, et. al. 2011; Fu, et. al. 2007]. Specifically, clustered-charge adsorbents exhibit enhanced affinity and capacity of protein adsorption and greater selectivity in favor of proteins with patches of high local surface charge density. In related work, it was also demonstrated that a polymer brush with embedded cationic patches can sharply separate proteins with similar numbers of charges [Gon and Santore 2011]. Thus, clustered-charge adsorbents show promise for improving the purification of charged biomolecules.
IEX has been combined with confocal microscopy to characterize adsorption behavior on the macroscopic level [Harinarayan, et. al. 2006; Reichert, et. al. 2002; Wang and Yang 2008; Yang, et. al. 2006], and the adsorption of dye molecules on silica chromatographic substrates on the single molecule level [Wirth, et. al. 2003]. Theoretical modeling has also been applied to the study of these systems [Schirmer and Carta 2008]. The investigation of IEX with realistic protein adsorbates at microscopic levels, however, has yet to be performed. Monitoring ion-exchange adsorption at the single-molecule level includes interactions and dynamics of the probe molecule with the functionalized surfaces and in bulk solution [Boyd, et. al. 1947; Isailovic, et. al. 2007; Kang, et. al. 2001; Kang and Yeung 2002; Xu and Yeung 1998; Yang, et. al. 2008].
In order to understand and optimize IEX at the single molecule level, several experimental hurdles must be overcome. First, it must be possible to prepare, label, and isolate adsorbates for analysis at a purity that is appropriate for single-molecule scale experiments. Next, it is necessary to monitor and tune transport of the analyte to the IEX matrix. Finally, it is necessary to minimize or eliminate unwanted nonspecific interactions and to differentiate between them and the desired specific interactions. The first component, the preparation and characterization of single-molecule quality agarose and peptide-functionalized agarose substrates, is detailed in the Experimental section. The remainder of the current work as described below demonstrates the achievement of the latter two of these pre-requisite steps on the path towards the single-molecule study of protein chromatographic separation.
We have used fluorescence correlation spectroscopy (FCS) to probe the dynamics and interactions of various probe molecules with hard and soft surfaces [Daniels, et. al. 2010; Daniels, et. al. 2011; Reznik, et. al. 2009; Reznik, et. al. 2008]. In particular, we have shown that it is possible to position the ~2 µm high confocal Gaussian beam to span the solid-liquid interface using a piezo-electric positioning stage, such that hindered diffusion due to interfacial effects can be distinguished from free diffusion. Using this technique, in combination with single-molecule imaging and analysis algorithms, we can resolve and differentiate between nonspecific and specific interactions of the protein with the functionalized surface. These dynamics are important in understanding and optimizing the microscopic processes underlying chromatographic performance.
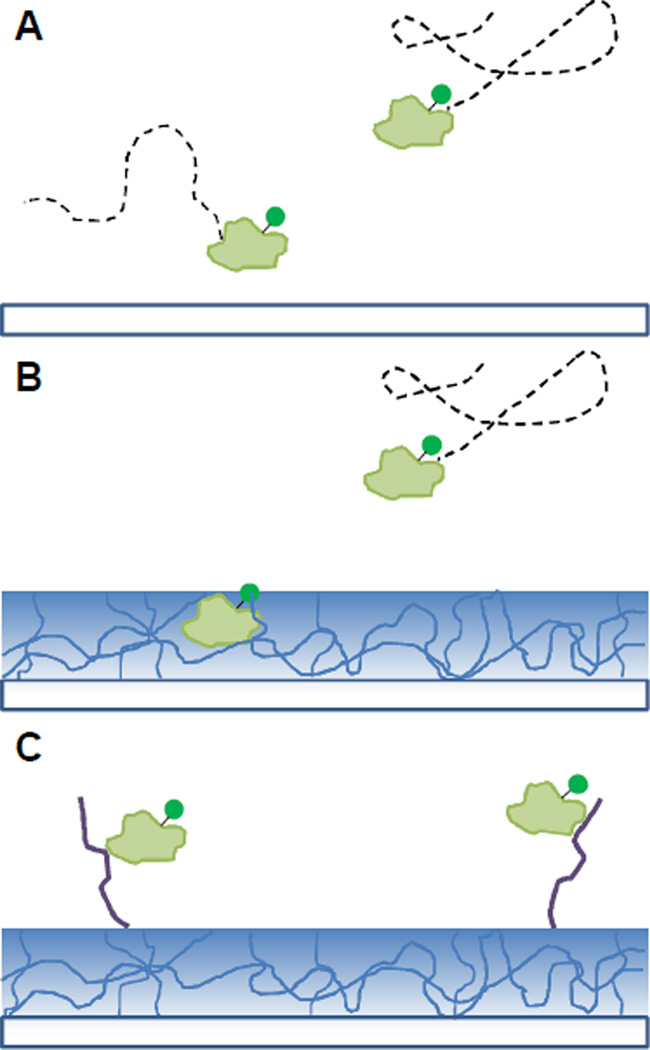
The dynamics of single molecules of Alexa Fluor 555 ® (Alexa 555) dye and Alexa 555-labeled α-lactalbumin protein were studied above glass (Figure 1A), spin-coated agarose thin films (Figure 1B), and cluster-charged peptide (penta-argininamide)-functionalized agarose surfaces (Figure 1C). We monitored the interactions of the anionic protein with the anionic glass support, the agarose support matrix and the cationic anion-exchange ligands. Using free Alexa 555 dye as a reference, the hindered diffusion of single molecules of the Alexa 555-labeled protein in the presence of the clustered-charge ligands was quantified. Our ability to resolve protein free diffusion, hindered diffusion and association with the surface demonstrates that this method can be effectively used to characterize clustered-charge IEX at the single-molecule scale.
Figure 1.
Cartoon depiction of the dye-labeled protein diffusing over the three surfaces used in this work. Bare glass surface (A), agarose-coated surface (B), peptide- functionalized surface (C).
Materials and Methods
All chemicals were obtained from Sigma-Aldrich unless otherwise noted. Much of the experimental methodology has previously been reported [Chen, et. al. 2011; Daniels, et. al. 2010; Daniels, et. al. ; Fu, et. al. 2007; Reznik, et. al. 2009; Reznik, et. al. 2008].
Agarose Surface Preparation
All solutions were prepared with DI water unless otherwise noted. No. 1 glass slides (VWR, 22×22 mm) were cleaned in a TL1 solution (4% (v/v) H2O2 (Fisher Scientific) and 13% (v/v) NH4OH) at 80 °C for 90 seconds and then plasma cleaned in O2, on medium power, for 2 min (Harrick Plasma, PDC-32G). Silicon templates (Grace Biolabs) were placed on the slides and 1 mL of hot 1% (w/w) agarose solution (US Biological) was spun onto the slides at 2000–3000 rpm (Model WS 400A 8NPP/Lite spin coater, Laurell Technologies Corp.). To immobilize the peptide, agarose surfaces were activated with aldehyde groups by treating the surfaces with 20 mM NaIO4 for 30 min as described in Afanassiev et al. [Afanassiev, et. al. 2000]. After washing with DI water and drying with He gas, the activated surfaces were treated with a 5 nM solution of the penta-argininamide peptide (Biomatik, NH2-GGRRRRRamide; the amide form of the peptide was used to eliminate the negative charge on the C- terminus as previously described [Ajikumar, et. al. 2007; Berland, et. al. 1996]) in coupling buffer (100 mM Na3PO4 (EM Science), 150 mM NaCl (Mallinckrodt Chemical), pH 7.2). The peptides were immobilized on the surface with several drops of 20 mM CNBH4 (Pierce, diluted in 25% EtOH / 75% PBS) at 4 °C for 30 min. Excess uncoupled peptide was removed by rinsing with coupling buffer, and unreacted aldehyde sites were reduced with 66 mM NaBH4 (in 25% EtOH / 75% PBS) at 4 °C for 5 min. The surfaces were finally rinsed gently with DI water and stored at 4°C, if not used immediately.
Fluorescent Dye Labeling of α-Lactalbumin
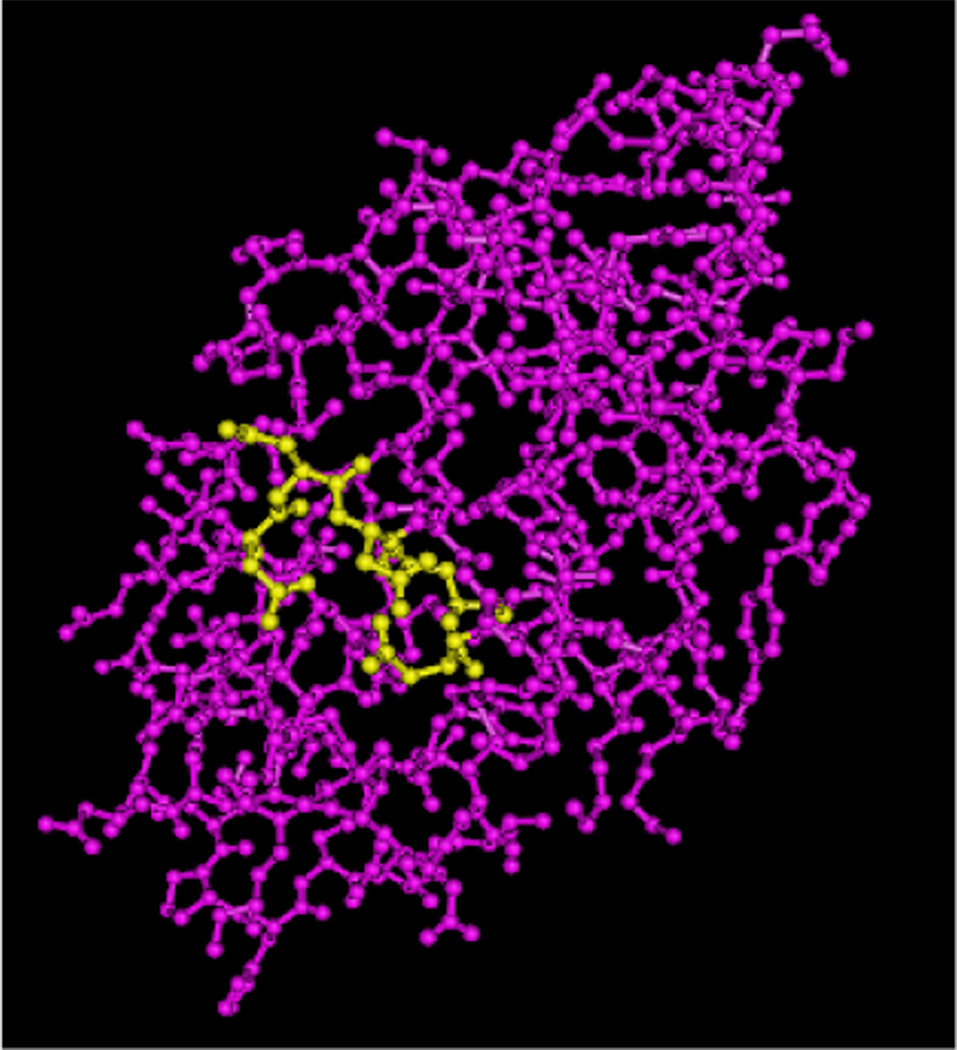
Labeling was done according to the manufacturer’s protocol. Alexa 555 (max abs/em 555/565 nm) succinimidyl ester was dissolved in dimethylformamide at a concentration of 10mg/ml and 0.1ml of dye solution was slowly added to 1ml of 10 mg/ml Ca2+ depleted α-lactalbumin (Figure 2) dissolved in 0.1 M NaHCO3 buffer, pH 7.4 , to preferentially label the protein amine terminus rather than lysine ε-amino groups [Xavier, et. al. 1997]. Initially, the protein was labeled with Tetramethylrhodamine isothiocyanate (TRITC) dye (max abs/em: 540/580nm, as shown in Fig 5). However, Alexa replaced TRITC due to higher photostability and brightness of the Alexa Fluor® dyes [Panchuk-Voloshina, et. al. 1999]. The reaction was incubated at room temperature for 1 hour under constant mixing, and stopped with 0.1 mL of freshly-prepared 1.5 M hydroxylamine, pH 8.5. The labeled protein was dialyzed against water for 24 hours and then against 10 mM Tris and 100 mM NaCl at pH 8.0 for 24 hours. To ensure complete removal of the unincorporated fluorophore, PD-10 desalting columns and/or gel filtration chromatography was used. Gel filtration was carried out on a Pharmacia FPLC system using Sephadex 10/300 GL (GE Healthcare) with 10 mM Tris and 100 mM NaCl at pH 8.0 as running buffer. The fractions with an estimated fluorophore-to-protein ratio of 1 ± 0.2 were used for the studies.
Figure 2.
Structure of Ca2+ depleted α-lactalbumin with five aspartate residues highlighted in yellow shown using Cn3D 4.1 viewer. This region of α-lactalbumin with a large number of aspartate residues, which forms a cluster of negative charge, has been shown to be the binding site of the calcium ion.
Figure 5.
Scanning confocal images of: A) agarose film on glass, showing that agarose itself is not fluorescent at our excitation/emission conditions (532 nm/633 nm); B) agarose functionalized with penta-argininamide peptide charge clusters, showing that peptide immobilization does not introduce fluorescence; C) agarose with flowing TRITC-labeled α-lactalbumin in solution, showing distributed background fluorescence of flowing protein, but no localized adsorption events; D) agarose with peptide clusters after flowing TRITC-labeled α-lactalbumin in solution, showing discrete protein adsorption events.
Fluorescence Correlation Spectroscopy
Measurements were taken on a home-built epifluorescence scanning confocal microscope, as detailed in the Supporting Information. Standard samples for calibrating the focal volume were prepared with a 1:1000 dilution of 100 nm FluoSphere beads (Invitrogen, max abs/em: 540/560 nm) in MB-grade water (HyClone). The resulting focal volume had a 1/e2 beam radius of ~250 nm and height of ~2 µm [Qian and Elson 1991]. Alexa 555 and the dye-labeled α-lactalbumin were diluted in binding buffer (10 mM Tris-HCl (EMD), 10 mM NaCl, pH 8.0, in MB-grade water) to concentrations of 200 and 100 pM respectively.
For analysis, translational diffusion is represented by the Stokes-Einstein relationship where the diffusion coefficient (D) is equal to
| (1) |
a rate directly proportional to the Boltzmann constant (kB) and solvent temperature (T), and inversely proportional to the viscosity of solvent (η) and particle size (Rh). This implies that the characteristic diffusion time, τD, is related by the diffusion coefficient by the following equation:
| (2) |
where r0 is the radius of the focal volume, or the full width at half maximum of the laser. The general form of the autocorrelation function is expressed by Eq 3:
| (3) |
for which the response is correlated by the overlay of the original function with its shifted self at lag time τ. The resulting convolution yields an exponential decay across τ. Another form of the autocorrelation function that integrates the Stokes-Einstein relationship and diffusion time is represented as
| (4) |
where Veff is the effective volume, 〈C〉 is the concentration of dye present, τ is the lagtime at which the function is correlated, τD is the diffusion time, and z0 is the beam height.
For systems where multiple species are present, a multiple-component expression is used, where ni is the brightness and Ci is the concentration of the species i, as in Eq. 5.[Haustein and Schwille 2003; Tcherniak, et. al. 2009]
| (5) |
Autocorrelation data show the distribution of particle size and diffusion speeds within the solution, which makes it possible to distinguish between free diffusion, hindered diffusion, and anomalous adsorption behavior.
Using FCS to Measure Agarose-Coated Surface Interactions
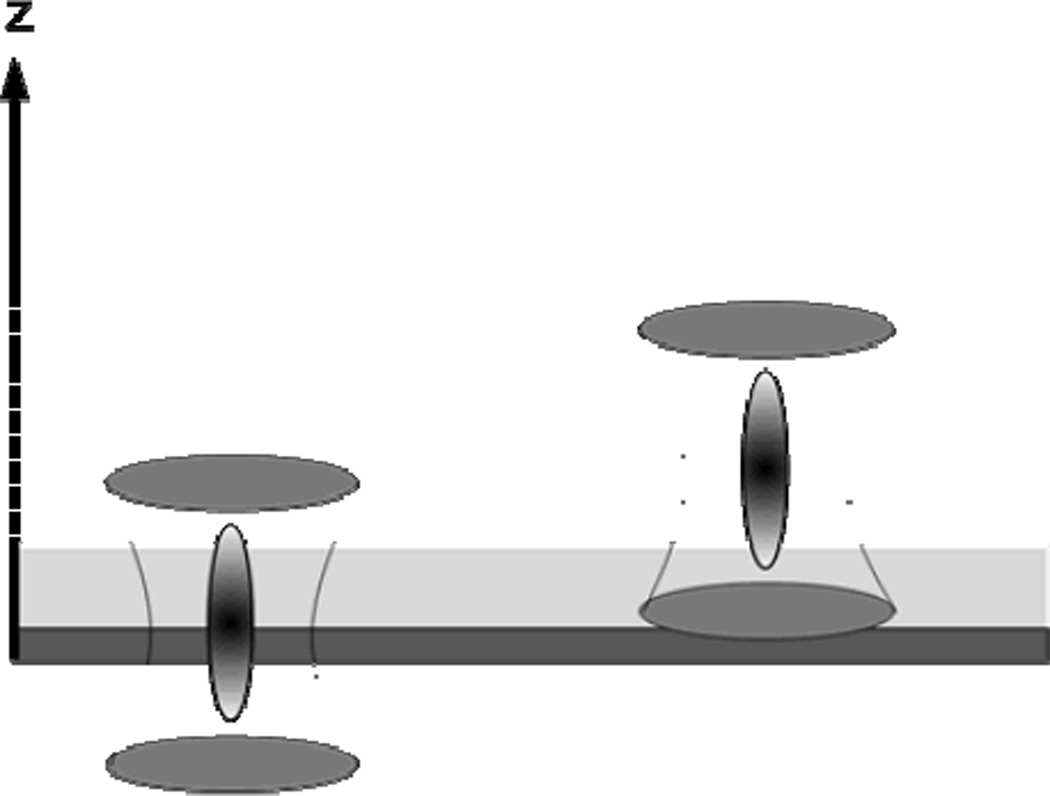
The fluctuating intensities characterized by the FCS method are observed as fluorescent molecules pass through a tightly focused focal volume [Blom, et. al. 2010] as shown in Figure 3, which roughly depicts our sample and observation volume. For this study, measurements were acquired with the focal volume centered first at the glass surface (Figure 3, left), and then within the bulk solution (Figure 3, right). Because the confocal beam height is ~2 µm, each measurement contains varying contributions from near the glass surface, near the agarose film, and deeper into the bulk solvent. By autocorrelating the acquired signal at each height and fitting to the multi-component equation Eq. 5, it is possible to distinguish bulk diffusion, hindered transport due to interactions with the agarose film, and longer-lived associations with the peptide.
Figure 3.
Placement of the agarose-coated surface surface with respect to the focal volume. The focal volume can by shifted along the z-axis, such that (left) the observation volume includes a combination of the glass surface, the agarose gel film, and the bulk solvent; or (right) the observation volume primarily encompasses the bulk solvent. (Figure is not drawn to scale.)
Results
Agarose Surface Characterization
Ellipsometry (M-2000 ellipsometer, J.A. Woollam) was used to determine that the agarose and peptide-functionalized agarose surfaces were 88.6 ± 1.9 nm thick using the Cauchy dispersion model for transparent media. This makes the thin film 5% of the FCS beam height. To confirm the successful immobilization of the peptide and to check the heterogeneity of the substrate, we used a BODIPY 650-labeled peptide (K(BODIPY650)GGRRRRR-amide) immobilized on the agarose matrix as described above.
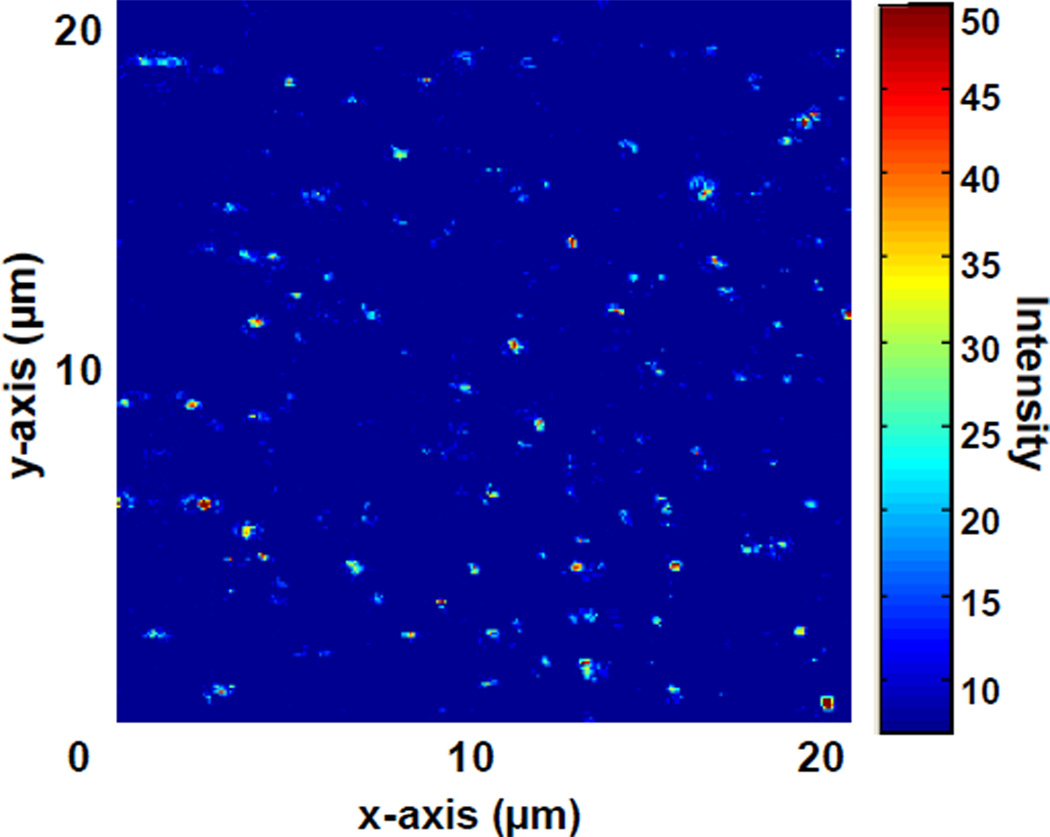
Figure 4 shows a scanning confocal image of the dye-labeled peptide-functionalized agarose surface. The image confirms the successful immobilization of the clustered peptides, the efficiency of washing of the agarose surface post immobilization, and control of cluster density for single-adsorbate analysis. The characteristic inter-peptide spacing was calculated to be approximately 1 µm.
Figure 4.
20×20 µm image of BODIPY650-labeled peptide-agarose slide. Continuous scanning confirmed single-state photobleaching, implying that the bright features arise from single-dye labeled peptide molecules. The average inter-peptide spacing is 1 µm,
It was also necessary to characterize the presence of any detectable background fluorescence from the agarose film or peptide adsorbents, and to determine if there was significant nonspecific protein adsorption to the agarose support. This was achieved by scanning confocal imaging of the agarose support, with and without peptide functionalization, in the presence and absence of TRITC-labeled α-lactalbumin. The results are shown in Figure 5A–D, in which it is demonstrated that there was negligible fluorescence background from the agarose support and that there was negligible nonspecific protein adsorption. In particular, protein adsorption was only observed to occur when the agarose support was functionalized with peptides.
Diffusion of protein and free dye over treated surfaces
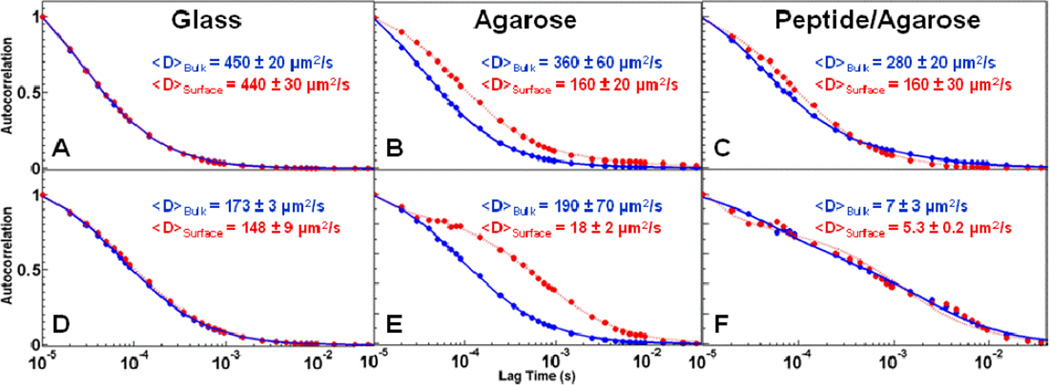
In Figure 6, diffusion coefficients extracted from autocorrelation analysis are compared for free Alexa 555 dye (top panel) and Alexa 555-labeled α-lactalbumin (bottom panel) over glass, agarose, and penta-argininamide-functionalized agarose surfaces both in the bulk solution and near the surface. We observed that the anionic Alexa 555 dye exhibits no interaction with the anionic glass surface (Figure 6A), since the measured diffusion coefficients are identical whether the confocal observation volume included the surface or was centered in the bulk solvent. This is expected, as we have previously reported that the anionic Alexa 555 shows negligible nonspecific interactions with anionic glass surfaces, in contrast to the commonly used cationic probe Rhodamine 6G [Blom, et. al. 2009; Blom, et. al. 2010; Daniels, et. al. 2010]. As expected, the mobility of the dye is greatly reduced upon conjugation to α-lactalbumin (Figure 6D), which has a much larger hydrodynamic radius [Berk, et. al. 1993]. However, that comparable bulk and interfacial diffusion coefficients for the Alexa 555-labeled α-lactalbumin indicates that there are negligible weak non-specific interactions between the protein and the glass surface, as was observed for the Alexa 555 alone.
Figure 6.
Autocorrelation curves for Alexa 555 (top; A–C) and Alexa 555- labeled α-lactalbumin (bottom; D–F). The measurements were taken over glass (A, D), agarose (B, E), and penta-argininamide aldehyde agarose (C, F) surfaces. The measurements were taken with the confocal observation volume focused either in the bulk solution (blue) or including the surface (red) in 10 mM Tris-HCl, 10 mM NaCl, pH 8.0 at 22.1°C.
As expected, both Alexa 555 and Alexa 555-labeled α-lactalbumin exhibit free diffusion when the confocal observation volume is focused in the bulk solution, far from the agarose-functionalized surface (Figures 6B and E, respectively; blue). When the observation volume includes the agarose-functionalized surface, however, both Alexa 555 and Alexa 555- labeled α-lactalbumin exhibit marked decreases in measured diffusion coefficients (Figures 6B and E, respectively; red). This indicates that the diffusion of both analytes is hindered by the agarose support; the protein was hindered more strongly, likely because of its larger size.
The observed hindered diffusion could be caused by steric, electrostatic, and chemical contributions. First, agarose is known to form relatively large pores that can range from 9 to 90 nm in size [Langford, et. al. 2006; Yao, et. al. 2006]. As we have recently shown, soft porous substrates can form sieve-like structures that sterically hinder the diffusion of probes such as dyes and proteins via hydrostatic effects [Daniels, et. al. 2011]. Other proposed steric interactions that have been identified by FCS include coupling to higher-order polymer vibrational modes [Wang and Zhu 2010]. Thus, the overall effect of steric interactions would be to decrease solute mobility near, on and inside the porous substrate, which is consistent with the observed effects. Electrostatic interactions would be expected to yield repulsive forces between the anionic probes and slightly negatively charged agarose substrates. Repulsive forces (in contrast to attractive electrostatic interactions) would not cause a decrease in mobility, as observed here. Instead , repulsive forces would cause a decrease in surface concentration, as we have demonstrated via single event analysis and will discuss later in the manuscript [Daniels, et. al. 2010]. Finally, it is possible that the protein’s hindered diffusion could result from hydrogen bonding between the protein and the support matrix [Fernandez-Sousa, et. al. 1978; Fernandez-Sousa and Rodriguez 1977]. This type of behavior has been observed with lysozyme, which is structurally similar to α-lactalbumin [Acharya, et. al. 1989; Qasba and Kumar 1997]. Single molecule imaging, and the extensive successful practical use of agarose-based adsorbents, offer strong evidence that there are only negligible nonspecific chemical interactions between the protein and agarose. Thus, based both on our experimental analysis and on our more detailed recent study of sieve-like behavior of porous soft interfaces [Daniels, et. al. 2011], we believe that the primary contributor to the modification of protein mobility in agarose is steric interactions.
That we observe steric interactions between the agarose surface and both Alexa 555 and Alexa 555- labeled α-lactalbumin protein analytes contradicts an earlier study in which minimal steric surface interactions were observed when Fluorescence Recovery After Photobleaching (FRAP) was used to measure diffusion coefficients for α-lactalbumin interacting with 2% agarose [Pluen, et. al. 1999]. There are several possible explanations. First, uncertainties in laser beam dimensions in FRAP experiments could lead to misrepresentation of diffusion coefficients and hydrodynamic radii. In contrast, the current work employs a characterization of the confocal beam dimensions as part of every measurement to ensure that accurate confocal beam dimensions are used in calculating diffusion coefficients [Daniels, et. al. 2010; Daniels, et. al. 2011; Reznik, et. al. 2009; Reznik, et. al. 2008; Tcherniak, et. al. 2009]. Next, the present measurements employ a piezoelectric sample stage with nanometer stability precision for accurately (and reproducibly) positioning the confocal observation volume with respect to the thin supported film. As these and other depth-dependent measurements clearly demonstrate [Daniels, et. al. 2010], only by accurately overlapping the center of the Gaussian focal volume with the thin supported film is it possible to quantify the small contributions from surface interactions (see Methods section for discussion on focal volume). As demonstrated in Figure 6, if the measurement is performed in the bulk of the solution (and away from the surface), bulk diffusion dominates the signal, and surface interactions are negligible. Finally, because the FRAP study employed 2% agarose, the smaller pore size, relative to that in the 1% agarose use in the present work, would further exclude the dye and protein analytes and perhaps minimize the observable effects of surface interactions.
Anomalously slow diffusion, which is evidence of long-lived association interactions between the α-lactalbumin and the surface, is observed with the penta-argininamide -functionalized agarose surfaces (Figure 6F). The corresponding dye control, in which only hindered diffusion is observed with the Alexa 555 probe, is shown in Figure 6C. A further control, in which association-induced anomalous diffusion is demonstrated to occur only at discrete positions on the sparsely peptide-functionalized agarose surface, is discussed below. The slow fitted diffusion coefficients, and the dominance of these events in the detected signal, even when the beam has been moved into the solvent, are indicative of association events [Daniels, et. al. 2010]. When long-lived interactions are the predominant phenomenon, these events dominate the autocorrelation decay curves, even when measuring further away from the surface. This results from the nature of FCS phenomenology, and is discussed in previous work [Tcherniak, et. al. 2009]. The anomalously long extracted diffusion coefficient indicates long-range Coulombic interactions between the cationic charge-clustered penta-argininamide and the anionic probe molecules, and is consistent with previous work on the adsorption of proteins on penta-argininamide clustered-charge adsorbents [Fu, et. al. 2007] Future efforts will employ single event analysis to extract association/dissociation constants under conditions relevant to practical separations, as demonstrated previously [Daniels, et. al. 2010].
Heterogeneity of the Agarose Surface
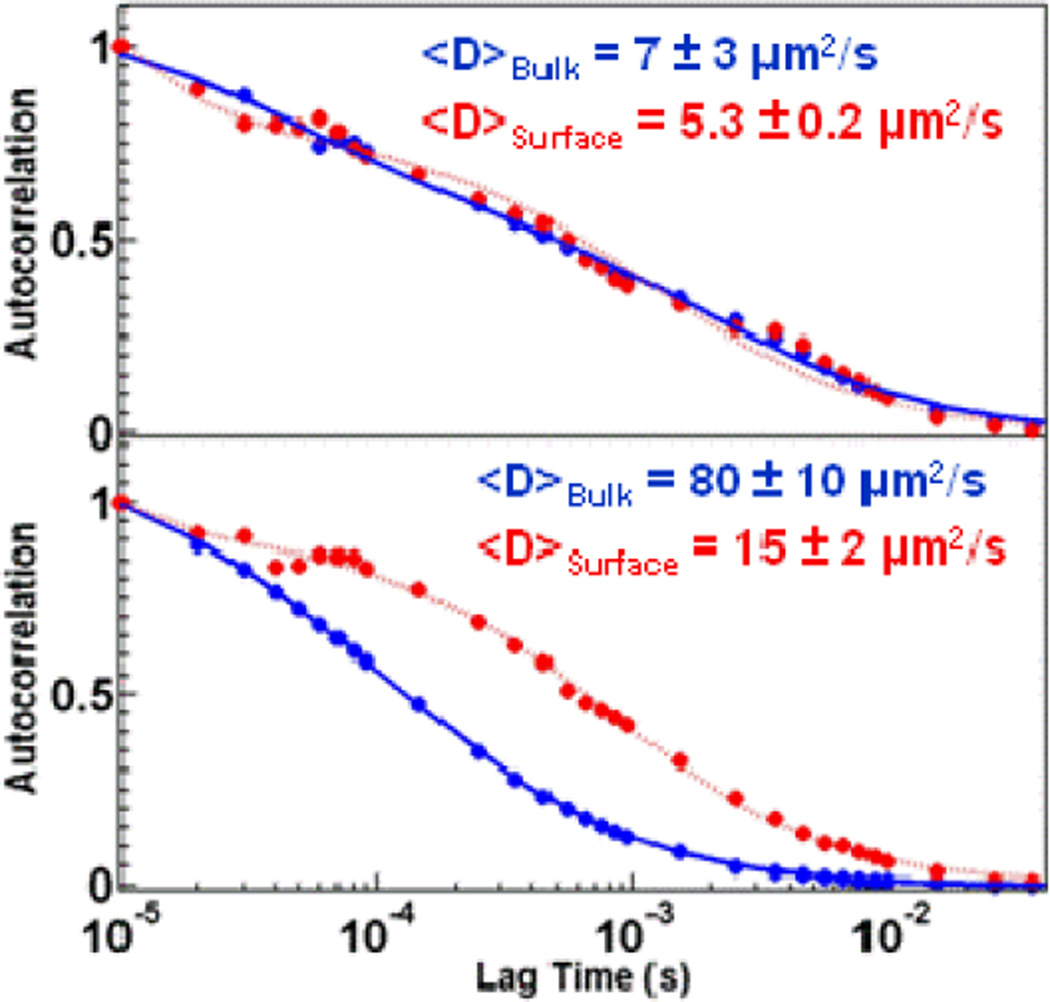
We would expect the slowest diffusion component, which we assign to protein-peptide associations, to be a localized observation. This is because the inter-peptide spacing is approximately 1 µm, and because the confocal beam radius is approximately 215 nm, and therefore the peptide spacing is sparse enough to differentiate between agarose-hindered diffusion and peptide association-induced anomalous diffusion on the same sample. This is demonstrated in Figure 7, in which anomalous diffusion, indicating association events, is only observed at certain positions on the sample, as would occur when the observation volume overlaps a penta-argininamide-functionalized region. By moving to other portions of the same sample, it is possible to extract the same hindered diffusion data as would be expected if the protein were only above the bare agarose surface.
Figure 7.
Autocorrelation curves for α-lactalbumin at different locations on a peptide functionalized agarose surface measured in the bulk (blue) and at 0.5 µm from the surface (red). Measurements at certain locations on the same sample indicate only nonspecific interactions dominate transport phenomena (top panel). Measurements at other locations indicate strong interactions between the protein and the peptide-functionalized agarose surface (bottom panel).
Protein-Peptide Interactions
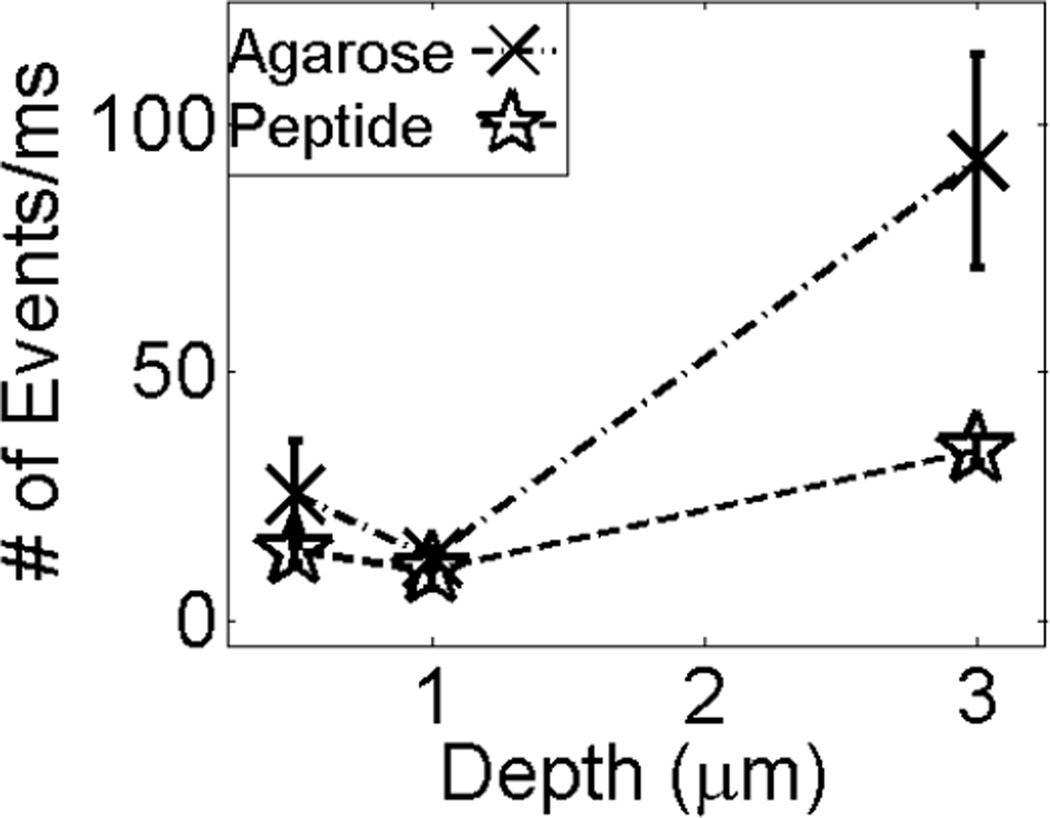
We also used single-event frequency analysis to characterize repulsive interactions between probes and surfaces, which are more difficult than attractive interactions to assess with traditional FCS analysis. Repulsion is important, however, because it is the competition between specific adsorptive attractions and non-specific desorptive repulsive interactions, tuned with various elution buffers, that controls separation efficiency and resolution. We successfully demonstrated that it is possible to study repulsive interactions using single event (blip) frequency analysis of single events in which a dye-labeled analyte diffuses into the observation volume, is detected, and diffuses out again. Figure 8 displays the average number of events (with standard deviations over three samples) obtained for each acquisition period (trajectories binned up from 10 µs to 1 ms) as a function of distance from the surface for the dye-labeled protein over both agarose and penta-argininamide functionalized agarose surfaces. Whereas the relative number of observed fluorescence events is constant (within the measurement error) at all distances from the peptide-functionalized surfaces, there were fewer detected fluorescence events near the pure agarose surface than in the bulk solvent. As discussed above, it is important to note that any detection of surface interactions far from the surface results from the nature of the confocal excitation volume (as discussed above), rather than from long-distance persistence of surface interactions.
Figure 8.
Single molecule blip frequency analysis of the Alexa 555-labeled α-lactalbumin diffusing over the agarose and peptide-functionalized agarose surfaces. The spread in intensity values for each point reflects reproducibility from multiple experiments. The negatively charged agarose repels the protein as shown by a smaller number of events near the surface as compared to the measurements in the bulk. The lines are included as a guide for the eye.
The blip frequency analysis in Figure 8 clearly demonstrates a decrease in the number of diffusion events close to the surface for the protein-agarose system. This would be expected in a system in which electrostatic repulsion, in the absence of specific binding, causes a decrease in concentration near the support. The Coulombic repulsion between the like-charged protein and agarose resulted in a decreased number of events (and thus adsorbate concentration), closer to the surface.
With the peptide functionalized surface, the effects are less dramatic, as there are also attractive forces between the penta-argininamide and the protein, in addition to nonspecific repulsive forces. In the presence of the ligands, the protein has a higher probability of staying close to the surface. This is not seen in an overall increase in the number of events close to the surface, however, because the proteins are inclined to stick to the ligands, which restricts the diffusion and lowers the number of pure diffusion events observed. Even so, due to the heterogeneity of the surface (Figure 7), there is still a probability that the proteins will be repelled from the surface into the bulk. This probably accounts for the slight increase in the number of events of the peptide-agarose surface moving from near the surface to the bulk solution, and also for the greater variability in the number of detected events close to the peptide-functionalized surface.
Conclusion
We have demonstrated the feasibility of each of the separate steps required for characterizing protein ion-exchange separations on a single molecule scale. We have prepared clustered-charge functionalized surfaces that show definite electrostatic interaction versus bulk diffusion. We have shown that it is possible to distinguish between free diffusion, hindered diffusion resulting from steric interactions with the interface, and electrostatic association. The benchmarks presented here for sample preparation and analysis will allow us to understand and optimize the clustered-charge ion exchange parameters at the molecular scale in future experiments.
Supplementary Material
Acknowledgements
Welch Foundation Grant E-1264 to RC Willson, supported the protein work. Additional support for this work was provided by the National Science Foundation [Grants CTS-0004544, CBET-1134417, CBET-1133965 and CHE-1151647], and the National Institutes of Health [Grant GM94246-01A1]. C. Landes thanks the Norman Hackerman Welch Young Investigator Program at Rice University.
Footnotes
Supporting Information Available
Additional information is available as noted in text. This material is available free of charge via the Internet at http://
References
- Acharya KR, Stuart DI, Walker NPC, Lewis M, Phillips DC. Refined structure of baboon α-lactalbumin at 1.7 å resolution. Comparison with c-type lysozyme. Journal of Molecular Biology. 1989;208:99–127. doi: 10.1016/0022-2836(89)90091-0. (Copyright (C) 2011 American Chemical Society (ACS). All Rights Reserved.) [DOI] [PubMed] [Google Scholar]
- Afanassiev V, Hanemann V, Wolfl S. Preparation of DNA and protein micro arrays on glass slides coated with an agarose film. Nucleic Acids Research. 2000;28:e66, ii–v. doi: 10.1093/nar/28.12.e66. (Copyright (C) 2011 American Chemical Society (ACS). All Rights Reserved.) [DOI] [PMC free article] [PubMed] [Google Scholar]
- Ajikumar PK, Ng JK, Tang YC, Lee JY, Stephanopoulos G, Too H-P. Carboxyl-terminated dendrimer-coated bioactive interface for protein microarray: High-sensitivity detection of antigen in complex biological samples. Langmuir. 2007;23:5670–5677. doi: 10.1021/la063717u. (Copyright (C) 2010 American Chemical Society (ACS). All Rights Reserved.) [DOI] [PubMed] [Google Scholar]
- Berk DA, Yuan F, Leunig M, Jain RK. Fluorescence photobleaching with spatial fourier analysis: Measurement of diffusion in light-scattering media. Biophys. J. 1993;65:2428–2436. doi: 10.1016/S0006-3495(93)81326-2. (Copyright (C) 2011 American Chemical Society (ACS). All Rights Reserved.) [DOI] [PMC free article] [PubMed] [Google Scholar]
- Berland KM, So PTC, Chen Y, Mantulin WW, Gratton E. Scanning two-photon fluctuation correlation spectroscopy: Particle counting measurements for detection of molecular aggregation. Biophys. J. 1996;71:410–420. doi: 10.1016/S0006-3495(96)79242-1. (Copyright (C) 2011 American Chemical Society (ACS). All Rights Reserved.) [DOI] [PMC free article] [PubMed] [Google Scholar]
- Blom H, Chmyrov A, Hassler K, Davis LM, Widengren J. Triplet-state investigations of fluorescent dyes at dielectric interfaces using total internal reflection fluorescence correlation spectroscopy. Journal of Physical Chemistry A. 2009;113(19):5554–5566. doi: 10.1021/jp8110088. [DOI] [PubMed] [Google Scholar]
- Blom H, Hassler K, Chmyrov A, Widengren J. Electrostatic interactions of fluorescent molecules with dielectric interfaces studied by total internal reflection fluorescence correlation spectroscopy. International Journal of Molecular Sciences. 2010;11:386–406. doi: 10.3390/ijms11020386. [DOI] [PMC free article] [PubMed] [Google Scholar]
- Boyd GE, Adamson AW, Myers LS., Jr The exchange adsorption of ions from aqueous solutions by organic zeolites. Ii. Kinetics. J. Am. Chem. Soc. 1947;69:2836–2848. doi: 10.1021/ja01203a066. (Copyright (C) 2011 American Chemical Society (ACS). All Rights Reserved.) [DOI] [PubMed] [Google Scholar]
- Cano T, Offringa ND, Willson RC. Competitive ion-exchange adsorption of proteins: Competitive isotherms with controlled competitor concentration. J. Chromatogr., A. 2005;1079:116–126. doi: 10.1016/j.chroma.2005.03.120. (Copyright (C) 2012 American Chemical Society (ACS). All Rights Reserved.) [DOI] [PubMed] [Google Scholar]
- Chen W-h, Fu JY, Kourentzi K, Willson RC. Nucleic acid affinity of clustered-charge anion exchange adsorbents: Effects of ionic strength and ligand density. J. Chromatogr. A. 2011;1218:258–262. doi: 10.1016/j.chroma.2010.11.024. (Copyright (C) 2012 American Chemical Society (ACS). All Rights Reserved.) [DOI] [PubMed] [Google Scholar]
- Daniels CR, Reznik C, Landes CF. Dye diffusion at surfaces: Charge matters. Langmuir. 2010;26(7):4807–4812. doi: 10.1021/la904749z. [DOI] [PMC free article] [PubMed] [Google Scholar]
- Daniels CR, Reznik CG, Landes CF. Permeability of anti-fouling pegylated surfaces probed by fluorescence correlation spectroscopy. Colloids and Surfaces B: Biointerfaces. 2011;88(1):33–38. doi: 10.1016/j.colsurfb.2011.05.044. [DOI] [PMC free article] [PubMed] [Google Scholar]
- Fernandez-Sousa JM, Perez-Castells R, Rodriguez R. A simple, one-step chromatographic procedure for the purification of lysozyme. Biochim. Biophys. Acta, Enzymol. 1978;523:430–434. doi: 10.1016/0005-2744(78)90045-1. (Copyright (C) 2011 American Chemical Society (ACS). All Rights Reserved.) [DOI] [PubMed] [Google Scholar]
- Fernandez-Sousa JM, Rodriguez R. Lysozyme-agarose interaction. Biochem. Biophys. Res. Commun. 1977;74:1426–1431. doi: 10.1016/0006-291x(77)90601-5. (Copyright (C) 2011 American Chemical Society (ACS). All Rights Reserved.) [DOI] [PubMed] [Google Scholar]
- Fu JY, Balan S, Potty A, Nguyen V, Willson RC. Enhanced protein affinity and selectivity of clustered-charge anion-exchange adsorbents. Analytical Chemistry (Washington, DC, United States) 2007;79:9060–9065. doi: 10.1021/ac070695n. (Copyright (C) 2010 American Chemical Society (ACS). All Rights Reserved.) [DOI] [PubMed] [Google Scholar]
- Gon S, Santore MM. Single component and selective competitive protein adsorption in a patchy polymer brush: Opposition between steric repulsions and electrostatic attractions. Langmuir. 2011;27:1487–1493. doi: 10.1021/la104592f. (Copyright (C) 2011 American Chemical Society (ACS). All Rights Reserved.) [DOI] [PubMed] [Google Scholar]
- Harinarayan C, Mueller J, Ljunglof A, Fahrner R, Van AJ, van RR. An exclusion mechanism in ion exchange chromatography. Biotechnol. Bioeng. 2006;95:775–787. doi: 10.1002/bit.21080. (Copyright (C) 2011 American Chemical Society (ACS). All Rights Reserved.) [DOI] [PubMed] [Google Scholar]
- Haustein E, Schwille P. Ultrasensitive investigations of biological systems by fluorescence correlation spectroscopy. Methods. 2003;29(2):153–166. doi: 10.1016/s1046-2023(02)00306-7. [DOI] [PubMed] [Google Scholar]
- Isailovic S, Li H-W, Yeung ES. Adsorption of single DNA molecules at the water/fused-silica interface. J. Chromatogr., A. 2007;1150:259–266. doi: 10.1016/j.chroma.2006.09.093. (Copyright (C) 2012 American Chemical Society (ACS). All Rights Reserved.) [DOI] [PubMed] [Google Scholar]
- Jennissen HP, Heilmeyer LMG., Jr General aspects of hydrophobic chromatography. Adsorption and elution characteristics of some skeletal muscle enzymes. Biochemistry. 1975;14:754–760. doi: 10.1021/bi00675a017. (Copyright (C) 2011 American Chemical Society (ACS). All Rights Reserved.) [DOI] [PubMed] [Google Scholar]
- Kang SH, Shortreed MR, Yeung ES. Real-time dynamics of single-DNA molecules undergoing adsorption and desorption at liquid-solid interfaces. Anal. Chem. 2001;73:1091–1099. doi: 10.1021/ac0013599. (Copyright (C) 2012 American Chemical Society (ACS). All Rights Reserved.) [DOI] [PubMed] [Google Scholar]
- Kang SH, Yeung ES. Dynamics of single-protein molecules at a liquid/solid interface: Implications in capillary electrophoresis and chromatography. Anal. Chem. 2002;74:6334–6339. doi: 10.1021/ac0261202. (Copyright (C) 2012 American Chemical Society (ACS). All Rights Reserved.) [DOI] [PubMed] [Google Scholar]
- Kubota N, Miura S, Saito K, Sugita K, Watanabe K, Sugo T. Comparison of protein adsorption by anion-exchange interaction onto porous hollow-fiber membrane and gel bead-packed bed. Journal of Membrane Science. 1996;117:135–142. (Copyright (C) 2011 American Chemical Society (ACS). All Rights Reserved.) [Google Scholar]
- Langford JF, Schure MR, Yao Y, Maloney SF, Lenhoff AM. Effects of pore structure and molecular size on diffusion in chromatographic adsorbents. J Chromatogr A. 2006;1126:95–106. doi: 10.1016/j.chroma.2006.06.060. (Copyright (C) 2011 U.S. National Library of Medicine.) [DOI] [PubMed] [Google Scholar]
- Mueller W. New ion exchangers for the chromatography of biopolymers. J. Chromatogr. 1990;510:133–140. (Copyright (C) 2011 American Chemical Society (ACS). All Rights Reserved.) [Google Scholar]
- Panchuk-Voloshina N, Haugland RP, Bishop-Stewart J, Bhalgat MK, Millard PJ, Mao F, Leung W, Haugland RP. Alexa dyes, a series of new fluorescent dyes that yield exceptionally bright, photostable conjugates. The Journal of Histochemistry & Cytochemistry. 1999;47(9):1179–1188. doi: 10.1177/002215549904700910. [DOI] [PubMed] [Google Scholar]
- Pluen A, Netti PA, Jain RK, Berk DA. Diffusion of macromolecules in agarose gels: Comparison of linear and globular configurations. Biophys. J. 1999;77:542–552. doi: 10.1016/S0006-3495(99)76911-0. (Copyright (C) 2011 American Chemical Society (ACS). All Rights Reserved.) [DOI] [PMC free article] [PubMed] [Google Scholar]
- Qasba PK, Kumar S. Molecular divergence of lysozymes and α-lactalbumin. Crit. Rev. Biochem. Mol. Biol. 1997;32:255–306. doi: 10.3109/10409239709082574. (Copyright (C) 2011 American Chemical Society (ACS). All Rights Reserved.) 255 plates. [DOI] [PubMed] [Google Scholar]
- Qian H, Elson EL. Analysis of confocal laser-microscope optics for 3-d fluorescence correlation spectroscopy. Appl. Opt. FIELD Full Journal Title:Applied Optics. 1991;30(10):1185–1195. doi: 10.1364/AO.30.001185. [DOI] [PubMed] [Google Scholar]
- Reichert U, Linden T, Belfort G, Kula M-R, Thommes J. Visualizing protein adsorption to ion-exchange membranes by confocal microscopy. Journal of Membrane Science. 2002;199:161–166. (Copyright (C) 2011 American Chemical Society (ACS). All Rights Reserved.) [Google Scholar]
- Reznik C, Estillore N, Advincula RC, Landes CF. Single molecule spectroscopy reveals heterogeneous transport mechanisms for molecular ions in a polyelectrolyte polymer brush. J. ys. Chem. B. 2009;113(44):14611–14618. doi: 10.1021/jp906487j. [DOI] [PubMed] [Google Scholar]
- Reznik C, Darugar Q, Wheat A, Fulghum T, Advincula RC, Landes CF. Single ion diffusive transport within a poly(styrene sulfonate) polymer brush matrix probed by fluorescence correlation spectroscopy. J. Phys. Chem. B FIELD Full Journal Title:Journal of Physical Chemistry B. 2008;112(35):10890–10897. doi: 10.1021/jp803718p. [DOI] [PubMed] [Google Scholar]
- Schirmer EB, Carta G. Protein adsorption kinetics in charged agarose gels: Effect of agarose content and modeling. AIChE J. 2008;55:331–341. (Copyright (C) 2011 American Chemical Society (ACS). All Rights Reserved.) [Google Scholar]
- Tcherniak A, Reznik C, Link S, Landes CF. Fluorescence correlation spectroscopy: Criteria for analysis in complex systems. Anal. Chem. (Washington, DC, US) FIELD Full Journal Title:Analytical Chemistry (Washington, DC, United States) 2009;81(2):746–754. doi: 10.1021/ac8013109. [DOI] [PubMed] [Google Scholar]
- Wang S, Zhu Y. Molecular diffusion on surface tethered polymer layers: Coupling of molecular thermal fluctuation and polymer chain dynamics. Soft Matter. 2010;6(19):4661–4665. [Google Scholar]
- Wang Z, Yang S. Adsorption behaviors of dppc/mo aggregates on sio2 surfaces. Langmuir FIELD Full Journal Title:Langmuir. 2008;24(20):11616–11624. doi: 10.1021/la801723j. [DOI] [PubMed] [Google Scholar]
- Wirth MJ, Swinton DJ, Ludes MD. Adsorption and diffusion of single molecules at chromatographic interfaces. J. Phys. Chem. B. 2003;107:6258–6268. (Copyright (C) 2011 American Chemical Society (ACS). All Rights Reserved.) [Google Scholar]
- Xavier KA, Shick KA, Smith-Gill SJ, Willson RC. Involvement of water molecules in the association of monoclonal antibody hyhel-5 with bobwhite quail lysozyme. Biophys. J. 1997;73:2116–2125. doi: 10.1016/S0006-3495(97)78242-0. (Copyright (C) 2012 American Chemical Society (ACS). All Rights Reserved.) [DOI] [PMC free article] [PubMed] [Google Scholar]
- Xu X-HN, Yeung ES. Long-range electrostatic trapping of single-protein molecules at a liquid-solid interface. Science (Washington, DC) 1998;281:1650–1653. doi: 10.1126/science.281.5383.1650. (Copyright (C) 2012 American Chemical Society (ACS). All Rights Reserved.) [DOI] [PubMed] [Google Scholar]
- Yang K, Shi Q-H, Sun Y. Modeling and simulation of protein uptake in cation exchanger visualized by confocal laser scanning microscopy. J. Chromatogr. A. 2006;1136:19–28. doi: 10.1016/j.chroma.2006.09.036. (Copyright (C) 2011 American Chemical Society (ACS). All Rights Reserved.) [DOI] [PubMed] [Google Scholar]
- Yang K, Bai S, Sun Y. Protein adsorption dynamics in cation-exchange chromatography quantitatively studied by confocal laser scanning microscopy. Chem. Eng. Sci. 2008;63:4045–4054. (Copyright (C) 2011 American Chemical Society (ACS). All Rights Reserved.) [Google Scholar]
- Yao Y, Czymmek KJ, Pazhianur R, Lenhoff AM. Three-dimensional pore structure of chromatographic adsorbents from electron tomography. Langmuir. 2006;22:11148–11157. doi: 10.1021/la0613225. (Copyright (C) 2011 American Chemical Society (ACS). All Rights Reserved.) [DOI] [PubMed] [Google Scholar]
Associated Data
This section collects any data citations, data availability statements, or supplementary materials included in this article.


