Abstract
The application of adaptive optics to vision science creates the potential to directly probe the link between the retinal mosaic and visual perception. However, interrogation on a cellular level requires small, threshold stimuli, and therefore an implicit detection model. Unfortunately the parameters governing detection at cone threshold are poorly constrained and whether or not appearance judgments interact with detectability under these conditions is unknown. We tested the assumption that subjects can report stimulus appearance without compromising sensitivity by having 4 subjects rate either detection certainty, color appearance, or both, for small, brief, monochromatic (580 nm) point stimuli presented to the dark adapted fovea. Reporting color, either alone or in conjunction with detection certainty, did not impair detection. Sensitivity actually increased in the simultaneous reporting task, while color reports were effectively unaltered. These results suggest that 1. color mechanisms contain information relevant for detection at cone threshold, 2. subjects cannot voluntarily make full use of this information in a simple detection task, and 3. simultaneous reporting is a viable method of investigating multiple stimulus attributes for small threshold stimuli.
1. Introduction
Spatial and color vision are mediated by 3 classes of spatially interleaved cones with unique but overlapping spectral sensitivities [1-3]. Since color vision requires comparing responses of all three classes, yet only one type of cone is present at any retinal location, there is a necessary ambiguity between the spatial and spectral information encoded in the retinal mosaic at fine spatial scales [4, 5]. This ambiguity, or information loss, is surprisingly inconsequential in everyday visual experience [4], and the visual system's strategy for effectively mitigating its impact remains unknown.
The visual system's strategy for resolving spatio-chromatic ambiguity when reconstructing a percept from individual cone inputs can be investigated at the receptor level with adaptive optics imaging and psychophysics [6, 7]. However, threshold intensities are required to produce stimuli effectively small enough to probe individual cones (at least within the central retina). For this reason, models developed to explain stimulus appearance in this context (e.g., see [7]; see also [8, 9] for related work with conventionally displayed small stimuli) require an implicit detection model, so that only seen stimuli and contributing receptor responses are considered. The parameters governing cone detection are poorly constrained however, and these models typically incorporate assumptions based on experiments in which the subject's task was simply to detect the stimulus (e.g. see [10]). The underlying assumption is that when a subject's main goal is not simply to detect a stimulus, but to note and report some aspect of the appearance, the subject's sensitivity and detection strategy are not compromised. This untested assumption has been implicitly incorporated in numerous prior studies, for example on color appearance at detection threshold and the contributions of luminance and chromatic mechanisms to detection [11-13]. However subjects may not be able to use fully independent strategies for detection and discrimination or identification (i.e. the strategy optimal for identification may be suboptimal for detection [14]), so it is not clear that this assumption will always hold.
Here we directly test the hypothesis that subjects can report color appearance, and the related hypothesis that subjects can validly report multiple stimulus attributes, without compromising the detectability of a small threshold stimulus. The latter would allow more efficient experimentation and experimental assessment of trial-by-trial correlations among different perceptual attributes, which could be particularly beneficial for constraining models of the image reconstruction process. We asked the following specific questions:
Does reporting color appearance impact detection threshold? An apparent reduction in detection sensitivity may occur in a color reporting task if subjects have difficulty registering color for very dim stimuli, and so are reluctant to report them as seen. Alternatively, subjects may experience a true reduction in sensitivity if the requirement to attend to and remember color appearance renders them less effective at detecting dim stimuli, as might be the case if limited attentional resources were directed toward color appearance and away from more relevant cues for detection. In both of these cases modeling detection with typical threshold parameters would underestimate the effective signal to noise ratio and number of cones participating in the appearance judgment, which can have a dramatic impact on data interpretations and conclusions.
Does simultaneously reporting detection certainty and color appearance impact either measure? A reduction in detection sensitivity when reporting more than one stimulus attribute may occur if subjects find registering, remembering, and reporting both attributes more difficult than reporting either independently, for example if their judgment draws on the same attentional resources [15, 16]. Color appearance reports may also be altered if subjects have difficulty attending to, and recalling, color when also explicitly tasked with assessing and reporting detection certainty. If subjects can rate detection certainty and appearance simultaneously, this would allow more direct experimental assessment of link between appearance and strength of the visual signal, which may more tightly constrain models of the image reconstruction process.
To answer these questions we asked subjects to report either detection certainty, color appearance, or both, for small, threshold, foveal stimuli. We found no impairment in sensitivity and no inclination to employ overly strict response criteria when reporting color appearance, either alone or in conjunction with detection certainty. In fact for some subjects sensitivity increased with the simultaneous report task. Using this simultaneous report scheme we also investigated the impact of response criterion, reflecting subjective brightness, on color appearance. We discuss the implications of these results for the independence of the luminance and chromatic mechanisms, the role of attention, and modeling the influences of the retinal mosaic on color appearance.
2. Methods
A. Subjects
Four subjects (1 male and 3 female) ranging in age from 22 to 39 participated in the study. Subjects 1 and 4 were the authors and subjects 2 and 3 were naïve to the purpose of the study. All subjects, except subject 3, were experienced psychophysical observers. All subjects had normal vision correctable to at least 20/20 and normal color vision as assessed by Hardy-Rand-Rittler (HRR) 4th edition color plates. The research followed the tenets of the Declaration of Helsinki and all subjects gave informed consent after an explanation of the study procedure and any possible risks. All study procedures were approved by the Institutional Review Board of the University of Houston.
B. Stimuli
Small (∼1 arcmin full width at half maximum), brief (6 ms), monochromatic spot stimuli were created with a 25 μm pinhole (subtending ∼0.2 arcmin visual angle) backlit by a broadband white LED in conjunction with a 580 nm (10 nm bandwidth) interference filter, displayed through a 2 mm artificial pupil. Wavelength was chosen to maximize variability in color appearance [8, 17]. Stimuli were presented monocularly to the central fovea after at least 10 min of dark adaptation, in an otherwise completely dark visual field, save for a fixation target composed of two small dim white dots (∼0.25° diameter) presented in Maxwellian view. Subjects fixated midway between these two dots, which were separated vertically by 2.25°. This target was chosen to minimize interference at the fovea without introducing large fixation errors. Reported accuracy of fixation for similar targets is 3–6 arcmin [18], which is not significantly different from that reported by Ditchburn for fixation of small central fixation targets [19]. A Badal optometer was used to correct defocus, along with habitual spectacle correction as needed for astigmatism (Subjects 2 and 4). No dilating or cycloplegic agents were used, since subjects' natural pupils were always larger than the 2 mm artificial pupil. This small pupil size also provided a large depth of focus, minimizing the potential impact of accommodative drifts and fluctuations on the experimental results [20].
Four stimulus intensities (including blanks) were used. Stimulus energy at the eye's pupil was measured without the interference filter with a Newport 1930C or 1936C power meter. Attenuation due to the interference filter was measured separately. After adjusting for the loss through the filter, stimulus energy at each intensity level was converted to quantal values (i.e., photons at the cornea) with the following relationship: photons = energy in Joules × stimulus peak wavelength × 5.0341 × 10¹⁵ J−1 m−1. Quantal values for subjects 2 and 4 included a further 1% correction for the estimated light loss due to reflection at the surface of the spectacle lenses. Stimulus duration was controlled by an electronic shutter (Uniblitz, model VS14) and timing was controlled by custom Matlab (Mathworks, Natick, MA) software incorporating Psychophysics Toolbox extensions [21, 22]. Stimuli were self-paced and were accompanied by auditory cues to facilitate detection, a tone at the start of each trial and the sound of the electronic shutter at stimulus presentation.
C. Psychophysical methods
Subjects rated stimuli using one of three response schemes: 1) detection certainty only (detection-only rating condition), 2) color appearance only (color-only rating condition), or 3) rating both color appearance and detection certainty (simultaneous rating condition). All three response conditions were effectively detection tasks (e.g., color was reported only when subjects felt they could see the stimulus). The response schemes were performed in randomly interleaved blocks without feedback on the presence of the stimulus.
Detection thresholds in the color-only and detection-only ratings conditions were compared to determine the impact of reporting color appearance on detection performance. To determine if simultaneously rating color appearance and detection certainty impacts either measure, detection thresholds were compared between the detection-only and simultaneous rating conditions, and color reports were compared between the color-only and simultaneous rating conditions. Use of the rating scale method in the detection-only and simultaneous conditions also allowed potential differences in subjective response criterion, in addition to sensitivity differences, to be assessed.
Rating schemes
Detection certainty
Subjects rated detection certainty by assigning each stimulus a rating from 1 to 5, where ‘1’ ≈ flash definitely not seen, ‘2’ ≈ seen but unsure, ‘3’ ≈ dim spot seen, ‘4’ ≈ moderate spot seen and ‘5’ ≈ bright spot seen. We have previously shown that the complexity of the rating scale task does not elevate detection thresholds [20].
Color appearance
Subjects rated color appearance with a hue-scaling response scheme in which each stimulus was rated by distributing 10 key presses among the categories red, green, yellow, blue, and white in any manner the subject felt best reflected appearance on that trial. Table 1 provides examples of desaturated (examples 1 and 2) and saturated color ratings (example 3), and an achromatic response (white or gray, example 4). Subjects were instructed to rate all seen flashes according to apparent hue and saturation and not apparent brightness. In the event that an ‘indescribable’ stimulus was seen subjects were instructed to use the ‘white’ category. Stimuli rated purely ‘white’ therefore reflected all stimuli without a discernable hue, including both ‘colorless’ or ‘indescribable’ stimuli as well as those appearing ‘white’ or ‘gray’.
Table 1.
Color ratings on each trial summed to 10, and were distributed among red, green, yellow, blue and white. Examples 1 to 4, shown before arcsine transformation, are of orange and blue-green desaturated color responses, a saturated color response, and an achromatic response.
| Example | Red | Green | Yellow | Blue | White/Gray | Sum |
|---|---|---|---|---|---|---|
| 1 | 3 | 0 | 3 | 0 | 4 | 10 |
| 2 | 0 | 4 | 0 | 3 | 3 | 10 |
| 3 | 10 | 0 | 0 | 0 | 0 | 10 |
| 4 | 0 | 0 | 0 | 0 | 10 | 10 |
Subjects entered both color and detection ratings with a small handheld numeric keypad. In the simultaneous rating condition detection certainty was always rated before color. Each key press was accompanied by an auditory tone to keep track of successfully entered ratings, with the final key press sounding a distinct ‘completion’ tone. Subjects were unable to proceed to the next stimulus until completing the requisite number of key presses. Only certain keys were allowed for detection and color ratings, and an error tone sounded with any unexpected key presses. Finally, subjects were instructed to intentionally press a non-rating key if they knew that a rating error had been made. Rating errors were excluded from analysis.
Practice and trial sessions
Subjects practiced until comfortable with the rating paradigms and responses were consistent, as evaluated by inspection of ratings distributions. Practice sessions were not included in the final analysis. Despite the seeming complexity of the rating schemes, subjects were generally proficient and comfortable after only 2-3 trial blocks, with each block consisting of approximately 80 trials. Experimental sessions lasted between 2 to 3 hours, with breaks as needed. Subjects 1 to 4 participated in 1500, 1000, 500, and 1000 trials per condition, completed over 2 (Subject 3) or 3 days. The different numbers of trials per condition per subject are a result of differences in stamina and availability. Subjects 3 and 4 completed all sessions (including practice) within 10 days, Subject 2 completed all sessions (including practice) over a two month period, and Subject 1 completed the 3rd session ∼6 months after the first two.
D. Data analysis
Detection thresholds and frequency of seeing data
For each trial session detection thresholds and associated confidence intervals were determined for each detection criterion by fitting psychometric curves to the frequency of seeing data and interpolating at 50% seen after accounting for nonzero false positive rates, using the following equation:
| (1) |
Where p(S|s) is the percentage of trials on which the stimulus was reported as seen (S) given the presence of the signal (s) and noise, p(S|n) is the percentage of trials reported as seen given the presence of noise (n) alone, and p(S|s)' is the percentage of seen trials adjusted for the nonzero false positive rate. For each subject, averaged thresholds and confidence intervals were estimated for each condition and criterion with weighted averages across sessions according to the number of trials (individual session data were first inspected for criterion consistency). Data acquired in the color-only response condition reflect the use of only a single response criterion. Consequently, we used linear interpolation to estimate thresholds and associated confidence intervals for the detection-only and simultaneous conditions at the same false positive rate (criterion) as in the color-only rating condition.
Discriminability
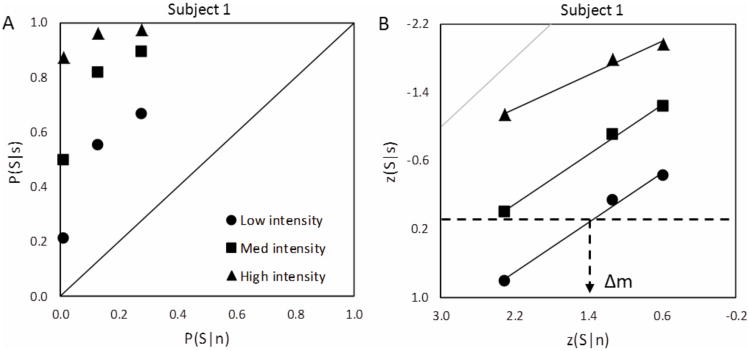
We also calculated the discriminability, Δm [23], of the different intensity stimuli for each subject and condition using receiver operator characteristic (ROC) analysis. Δm, like the more common d′, is useful because it is a measure of the separation between the noise and the signal plus noise distributions that is independent of the subject's response criterion. Unlike d′ though, it is applicable to those instances in which the variances of the signal plus noise and the noise distributions are not equal – as is the case with our low photon count, threshold-level data (see Fig. 1). Δm is defined by the following equation:
Figure 1.
Receiver Operating Characteristic (ROC) analysis and determination of discriminability, Δm. A) Typical ROC curves for Subject 1, from rating-only data. B) ROC curves for the same subject on a double probability plot and with a sample estimation of discriminability from linear fits to the low intensity curve −Δm equals z(S|n) on the ROC curve where z(S|s) equals zero (dashed lines). p(S|s) and p(S|n) are the correct detection and false positive rates, and z(S|s) and z(S|n) are their inverse normal distribution transformations. Here slopes fitting ROC data on double probability plots are less than one, as is expected with Poisson rather than Gaussian distributions. Gray line is a slope of one for comparison.
| (2) |
Where SN, S, and N are the means of the signal plus noise, signal, and noise distributions, respectively, and σn is the standard deviation of the noise distribution. Δm can be estimated graphically by plotting ROC curves in standard deviation units (double probability plots) and taking the distance from the noise distribution mean (distance from zero on the abscissa) that corresponds with the mean of the signal distribution (zero on the ordinate; see Fig. 1). For each subject we computed the percent change in discriminability between the detection-only (Δmd) and simultaneous (Δms) conditions for each stimulus intensity. These percent changes were then averaged across sessions and subjects. Discriminability comparisons could not be made with the color-only condition, since subjects used only a single response criterion in this condition (although discriminability can be estimated with a single response criterion, it requires Gaussian signal and noise distributions with equal variance [23, 24], assumptions that do not hold for our data, as described above and in Fig. 1.)
Hue ratings analysis
Mean hue ratings were calculated for each subject for the color-only and simultaneous rating conditions after an arcsine transformation of the data for uniform variance [25], according to the following equation:
| (4) |
Where RHue and are the original and transformed hue responses. After arcsine transformation, mean hues for all stimulus intensities and subjective response criteria were calculated and compared between the color-only and simultaneous rating conditions to determine whether valid appearance information is obtainable with the more complex simultaneous rating condition.
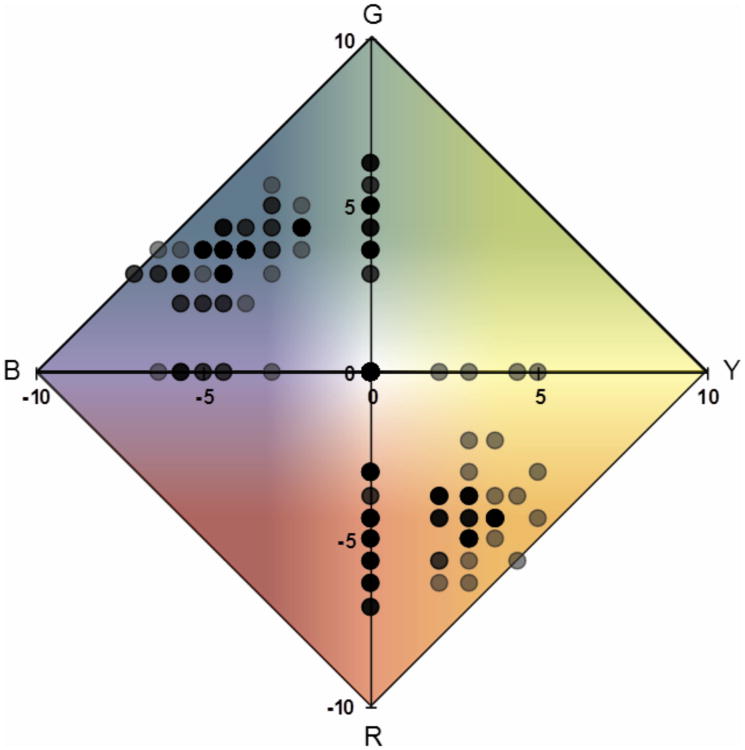
Individual and averaged hue ratings were also visualized using the Uniform Appearance Diagram (UAD) described by Abramov et al., [25] where the red-green and blue-yellow differences are plotted on the ordinate and abscissa, respectively. Figure 2 shows l set of color ratings plotted on a UAD for one subject (Subject 1). Data is shown for all non-blank stimuli seen in the color-only response condition (frequency of seeing from 40-95%). Reported appearance is typical and similar to that obtained in prior investigations on the color appearance of small, threshold, foveal stimuli [26, 27]. Repeated stimulus presentations result in considerable variability in both hue and saturation, presumably due to differences in the particular cones, and subsequent neural pathways, excited on each trial. Stimuli often appear blue-green and yellow-red (orange) but rarely, if ever, yellow-green or blue-red (violet).
Figure 2.
The Uniform Appearance Diagram showing typical color responses for one subject (Subject 1). Green-Red (ordinate) versus Yellow-Blue (abscissa) differences are plotted for all non-blank intensities (40-95% seen) reported with the color-only response scheme. Data has been arcsine transformed for uniform variance [25]. Boldness of the data points reflects the relative number of stimuli with the same color rating. Saturated hue responses fall along the outer perimeter and white responses fall at the origin. Background color is for illustrative purposes only.
3. Results
A. Reporting color appearance does not elevate detection threshold
To assess whether the color appearance task influences the subjective response criterion (as may occur if subjects wish to avoid potential difficulty in categorizing dim and possibly ambiguous stimuli), we compared the false positive rates in the color-only and detection-only conditions. Table 2, which lists the false positive rates in all response conditions, shows that subjects did not use overly strict detection criteria when rating color. For 3 subjects the detection criterion used in the color-only task was approximately the same as the most lenient criterion in the detection-only task (2 ‘unsure’), while for subject 1 the criterion used in the color-only task was more similar to the second most lenient criterion employed in the detection only task (3 ‘dim spot seen’).
Table 2.
False positive rates (%) for all three conditions (mean ± 1SD across sessions, except Subject 3 with only 2 sessions). Criterion use in the color-only condition typically falls nearest the most lenient criterion in the other two conditions (2 or more ‘unsure’).
| Subject | Unsure (2 or more) | Detection Dim (3 or more) | Moderate (4 or more) | Unsure (2 or more) | Simultaneous Dim (3 or more) | Moderate (4 or more) | Color |
|---|---|---|---|---|---|---|---|
| 1 | 28.6±2.7 | 12.8±2.3 | 1.36±1.22 | 21.9±3.3 | 5.7±2.2 | 0 | 13.9±2.4 |
| 2 | 9.6±2.6 | 1.2±1.1 | 0 | 5.3±5.0 | 0.3±0.6 | 0 | 7.6±2.1 |
| 3 | 4.1 | 0.6 | 0.6 | 5.1 | 0 | 0 | 4.2±4.1 |
| 4 | 14.2±3.2 | 2.9±1.9 | 0 | 10.4±4.0 | 0 | 0 | 14.2±5.6 |
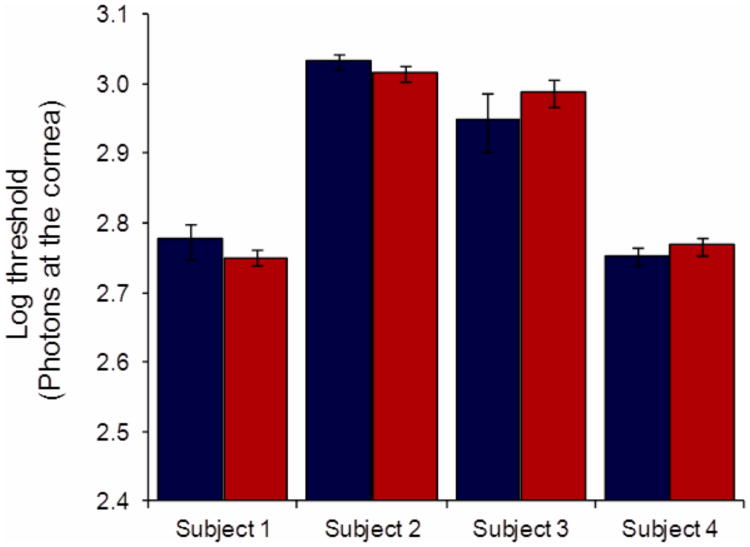
To assess whether the color appearance task impaired subjects' ability to detect the stimulus, we compared detection thresholds in the color-only condition to those in the detection-only condition interpolated at the same response criterion (false positive rate). Figure 3 shows that detection thresholds in the color-only rating condition were not significantly different from those in the detection-only condition for our four subjects (p = 0.17, 0.48, 0.83, and 0.99 for Subjects 1-4; two-tailed t-tests paired per session). This indicates that the task of attending to and reporting color does not reduce sensitivity or otherwise impair detection. Subjects 1 and 4 previously participated in an experiment where detection thresholds were measured for similar small stimuli, but at a wavelength of 550 nm [20]. The thresholds measured here with 580 nm stimuli were approximately twice as large as those reported in this earlier study, reflecting a greater increase than expected based solely on the difference in the eye's photopic sensitivity between these two wavelengths. While firm conclusions would require additional studies, it is possible that this difference reflects the relative influence of color-opponent and luminance mechanisms at cone threshold (i.e., as in the Sloan Notch [28]).
Figure 3.
There is no significant difference between detection thresholds in the detection-only (blue) and color-only (red) conditions. Detection-only thresholds are interpolated at the same false positive rate as employed in the color-only condition, error bars reflect the 95% confidence intervals estimated as described in the Methods.
B. Simultaneously reporting both color appearance and detection certainty does not elevate threshold
Our second goal was to determine if valid measures of detection certainty and color appearance can be obtained simultaneously. This would allow direct measurement of the relationship between detection certainty, which reflects the subjective intensity of the stimulus on each trial (presumably related to the cone catch), and color appearance. This would also allow the efficient combination of detection and color appearance studies.
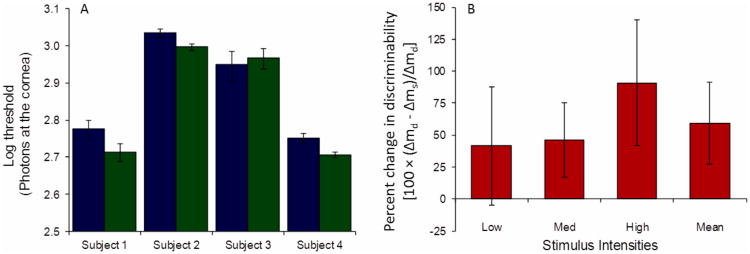
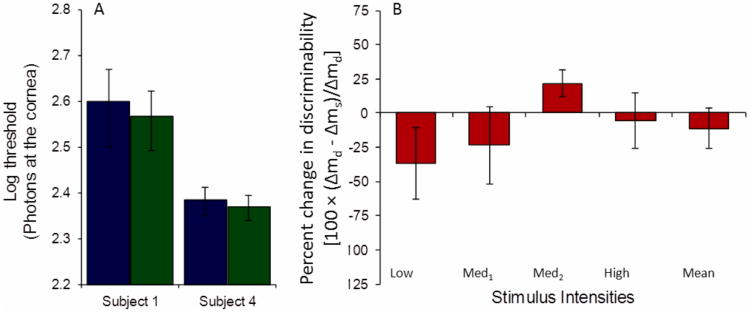
Table 2 shows that subjects used somewhat stricter detection criteria in the simultaneous rating condition than in the detection-only condition, a difference that was significant on average (p = 0.014, two-tailed paired t-test across subjects and criteria), although not on an individual level. Figure 4A shows that detection was not impaired in the simultaneous rating condition. For 3 subjects, thresholds in the simultaneous rating condition were, on average, 0.05 log units lower than in the detection-only rating condition, a trend that was present across both detection criteria and experimental sessions. This reduction was significant for Subjects 2 and 4 (z-tests equal 2.66 (p = 0.008), and 3.09 (p = 0.002), respectively) and approached significance for Subject 1 (z-test equals 1.75 (p = 0.08)). For Subject 3 (the least experienced subject) the same trend was not evident. Subjects 1 and 2, who repeated the experiment at a later date, exhibited the same behavior at both time points (data not shown). Consistent with this finding, discriminability, averaged across observers, was higher in the simultaneous than in the detection-only rating condition (Fig. 4B).
Figure 4.
(A) Detection thresholds are not higher in the simultaneous rating condition (green) than in the detection-only rating condition (blue), and are significantly lower for Subjects 2 and 4. To facilitate comparison with Fig. 3, thresholds in Fig. 4 are also interpolated at the color-only criterion, error bars reflect the 95% confidence intervals estimated as described in the Methods section. (B) On average, discriminability increases in the simultaneous rating condition compared with the detection-only condition. Ordinate is the percent change in discriminability between detection-only (Δmd) and simultaneous (Δms) rating conditions [100 × (Δmd - Δms)/Δmd]. Error bars are one standard error of the mean across subjects. The three leftmost bars are the mean across subjects at each intensity, and the rightmost bar is the overall mean across subjects and intensities.
Taken together these data demonstrate that detection performance is not compromised when subjects are required to report both color appearance as well as detection certainty, and in fact that sensitivity is enhanced or detection facilitated in some subjects under these conditions.
C. Facilitation is not explained by either reduced response rate or increased cognitive demand in the more complex simultaneous rating condition
The increased sensitivity for 3 of 4 subjects when reporting color in addition to detection certainty suggests that subjects may be able to access more stimulus-relevant information (i.e., all information encoded by the visual system potentially informative as to the presence of the visual stimulus) when rating both attributes together than when rating detection certainty alone. One possibility is that the more complicated simultaneous response scheme forces subjects to perform trials at a slower pace (given the longer time it takes to key in the response), which may enhance global attention and increase sensitivity. We've previously shown in one subject (Subject 1) that performing a similar detection experiment (550 nm, 30 ms stimulus of the same size) with and without a forced 4 second inter-stimulus interval elevated detection thresholds [20]. This suggests that the effective reduction in response rate in the more complex response scheme is not likely to account for the lower thresholds in the simultaneous response condition.
Another possibility is that the increased task complexity when reporting multiple stimulus attributes generally increases sensitivity (e.g., see [29]). To further explore this possibility Subjects 1 and 4 performed an additional experiment where apparent stimulus size rather than color appearance, was rated. Conditions were otherwise similar save for a 1.7 arcmin, 550 nm stimulus of 30 ms duration. Thresholds were not significantly different in the simultaneous size-detection rating condition than in the detection-only condition (see Fig. 5). Given this result, it seems unlikely that the facilitation observed when simultaneously reporting both color and detection certainty is simply a result of increased task complexity.
Figure 5.
(A) Detection thresholds are not significantly different in the simultaneous detection-size rating condition (green) than in the detection-only rating condition (blue). Error bars reflect the 95% confidence intervals estimated as described in the Methods section. (B) On average discriminability (Δm) was not significantly different between conditions for the 2 subjects. Ordinate is the percent change in discriminability between detection-only (Δmd) and simultaneous (Δms) rating conditions [100 × (Δmd - Δms)/Δmd]. Error bars are one standard error of the mean across subjects.
D. Color reports are not altered when simultaneously reporting color appearance and detection certainty
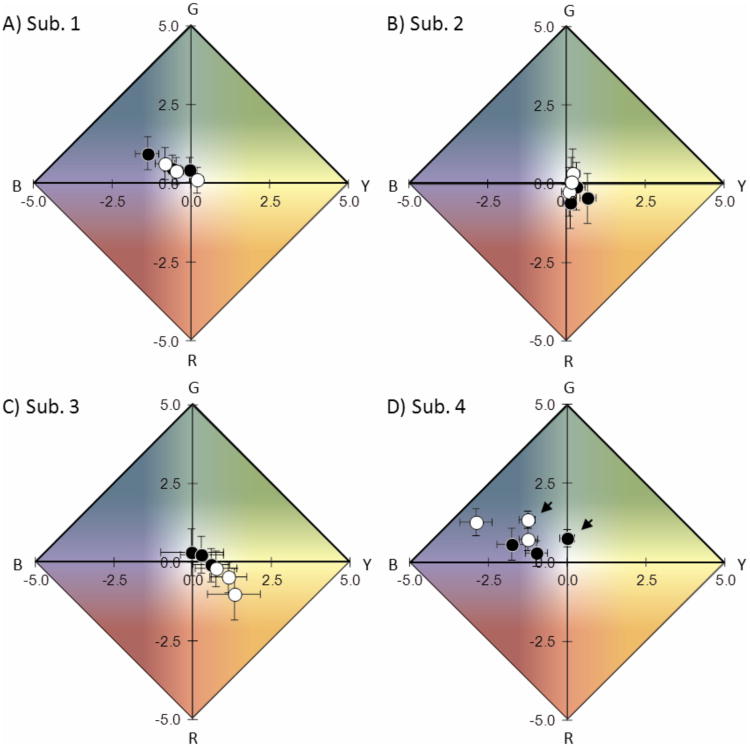
We've demonstrated that sensitivity is not impaired when subjects rate both color appearance and detection certainty (i.e., subjective brightness) simultaneously. We compared color reports in the simultaneous and color-only conditions to determine if valid color appearance data can also be obtained with the simultaneous response method. Color appearance reports may be altered if, for example, subjects have difficulty recalling color after rating detection certainty, or if subjects fail to register color for some stimuli when also required to assess and describe the subjective certainty of detection. Figure 6 shows averaged color ratings (red-green and yellow-blue) plotted on UADs for each subject for all non-blank stimulus intensities in the color-only and simultaneous rating conditions. Data plotted for the simultaneous condition include all stimuli rated a 2 (‘unsure’) or more. Table 2 shows that this criterion is approximately the same as that used in the color-only rating condition for all subjects except Subject 1, whose criterion in the color-only condition fell in between ratings of 2 (‘unsure’) and 3 (‘dim spot seen’). Average color ratings were generally not significantly different in the two conditions, the exception being the pair of points corresponding to the highest intensity stimulus for Subject 4 (see Table 3). This difference, and the slight apparent differences along the yellow-blue axis and in apparent saturation for some subjects, may be potentially related to the small differences in sensitivity in the two conditions (and criterion for Subject 1), as color appearance varies with stimulus strength (see Fig. 7).
Figure 6.
Color ratings averaged across sessions are not significantly different between the color-only condition (black) and simultaneous rating condition (white), except along the yellow-blue axis at high intensity for Subject 4 (arrows, panel D). This difference may be the result of the difference in sensitivity in the two conditions, which typically manifests along the yellow-blue axis. Error bars are one standard error of the mean of the arcsin transformed green-red and yellow-blue rating differences. The axes have been truncated to ± 5 to better display the average values. Background color is for illustrative purposes only. Data includes all seen stimuli (rated 2 or more in the simultaneous rating condition), and excludes false positive responses.
Table 3.
The differences in mean hue ratings in the yellow-blue and green-red directions (after arcsine transformation for uniform variance) in the color-only and simultaneous conditions (color-only minus simultaneous). Color ratings in the simultaneous condition include all seen stimuli (i.e., ratings of 2 or more). p-values reflect significance according to the two-tailed z-test. The difference in the yellow-blue direction is significant at high intensity for Subject 4.
| Yellow-Blue | Green-Red | ||||
|---|---|---|---|---|---|
| Subject | Intensity | Difference | p-value | Difference | p-value |
| 1 | Low | -0.5622 | 0.2439 | 0.3298 | 0.6515 |
| Med | -0.1146 | 0.7594 | 0.0883 | 0.8878 | |
| High | -0.2260 | 0.4602 | 0.3317 | 0.5542 | |
| 2 | Low | 0.0457 | 0.8850 | -0.3587 | 0.7528 |
| Med | 0.0959 | 0.7838 | -0.4042 | 0.7081 | |
| High | 0.5316 | 0.1132 | -0.5043 | 0.6528 | |
| 3 | Low | -1.3485 | 0.2971 | 1.3226 | 0.2318 |
| Med | -0.4680 | 0.6252 | 0.4481 | 0.5840 | |
| High | -0.5497 | 0.5158 | 0.4058 | 0.5683 | |
| 4 | Low | 1.1195 | 0.0971 | -0.6973 | 0.2918 |
| Med | 0.2513 | 0.5764 | -0.4493 | 0.4002 | |
| High | 1.2609 | 0.0001 | -0.5818 | 0.1406 | |
Figure 7.
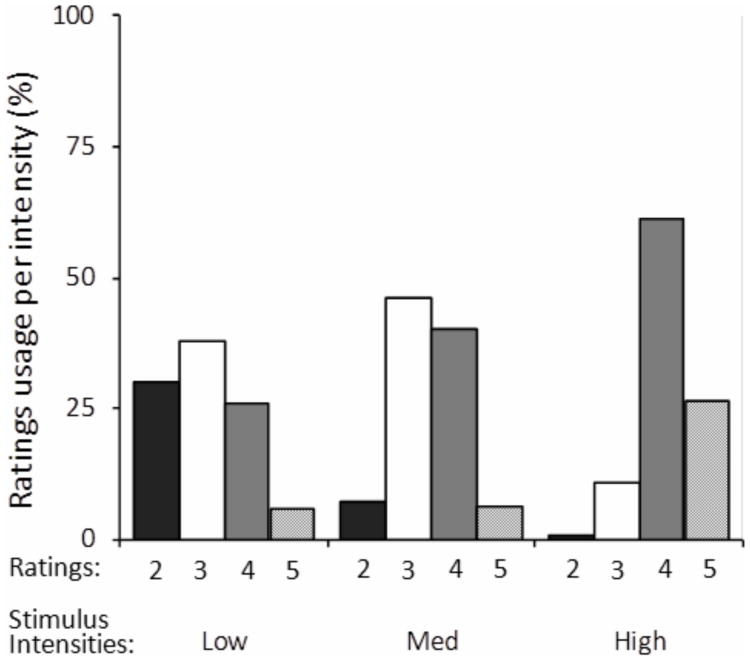
Typical variability in subjective ratings usage as a function of intensity. Subjective ratings for each intensity range from 2 (‘unsure’) to 5 (‘bright spot seen’). Data are from one simultaneous rating session (Subject 1). Stimuli of any intensity (Low, Med, High) may attain any subjective brightness.
E. Impact of detection criterion and intensity on color reports
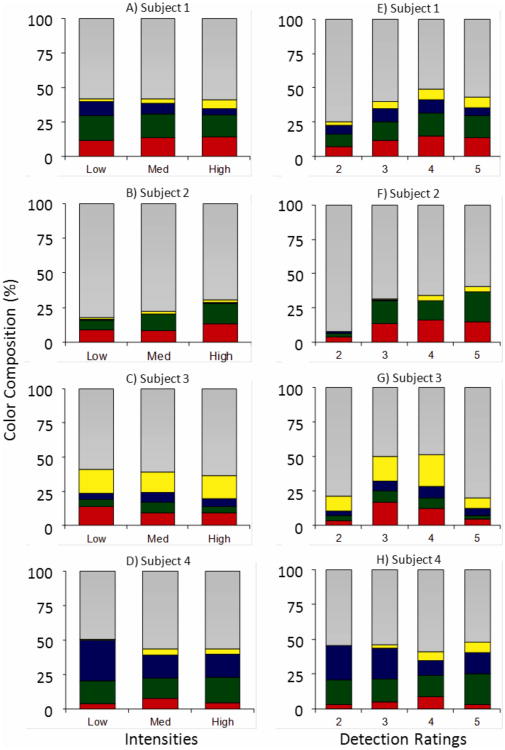
The simultaneous rating response method allows experimental assessment of the impact of the subjective response criterion on stimulus appearance. This is significant because quantum fluctuations cause great variability in the actual number of absorbed photons for threshold stimuli, which is reflected in the variability of subjects' detection ratings (Fig. 7). Given this variability, the subjective response criterion may be a better reflection of the strength of the visual signal, especially on a trial by trial basis, than the nominal stimulus intensity. Figure 8 shows the overall changes in color rating composition as a function of intensity (left column) and subjective detection criterion (right column), where each bar is the average composition of red, green, yellow, blue and white across sessions. For three subjects there is a shift in the blue-yellow balance towards the yellow direction (the veridical hue for this wavelength) with increasing intensity or criterion. Although similar dependencies are observed, it is evident that color appearance is more stable with respect to intensity changes than criterion changes, as expected.
Figure 8.
Red, green, yellow, blue and white responses (corresponding color segments, except gray segments incorporate white, gray, or uncertain hue responses) as a proportion of total hue response for each nonzero stimulus intensity (Subjects 1-4, A-D), and each subjective detection criterion (Subjects 1-4, E-H). For subjects 1, 2 and 4 the proportion of yellow (blue) tends to increase (decrease) with increasing intensity, a trend toward veridical hue for a 580 nm stimulus.
Figures 6 and 8 also demonstrate considerable individual differences in color reporting behavior for our four subjects. A portion of this variability is likely attributable to differences in the make-up of the retinal cone mosaic. For example, the presence or absence of S-cones near fixation may cause differences in the relative composition of green and blue responses [7], while differences in L and M-cone ratio may cause differences in the relative composition of red/orange versus green/blue responses [6, 7]. The latter differences are expected to be less pronounced in this study, with our conventionally displayed foveal stimuli, than found previously with adaptive optics corrected stimuli in the near periphery [6].
4. Discussion
A. Implications for modeling and studying the link between receptor signals and the visual percept
Our aims in the current report were two-fold. We first set out to test the basic assumption that asking subjects to note and report color appearance does not alter their sensitivity or strategy for detecting a stimulus. Detection thresholds in the latter condition were expected to be higher if, for example, subjects have difficulty registering color for dim stimuli or if subjects miss dim stimuli when mainly concerned with judging and reporting color. When detection thresholds in detection-only and color-only rating conditions were compared no significant difference was found, suggesting that subjects do not avoid dim stimuli in the latter condition and that the color appearance task does not otherwise interfere with detection. Given these findings, models designed to explain color appearance at detection threshold (e.g., [7]) can use typical cone detection parameters without underestimating either the signal to noise ratio or the number of cones effectively participating in detection.
Our second aim was to determine whether reporting more than one stimulus attribute alters a subject's detection strategy or negatively impacts their sensitivity, as this would allow more efficient experiments and experimental measurement of trial by trial correlations between multiple stimulus attributes. We found that subjects can simultaneously and validly report color appearance and detection certainty, as well as apparent stimulus size and detection certainty. Changes in color appearance with increased detection certainty (criterion) were similar, but more pronounced, than those with increased intensity. Taken together these results suggest the potential to more directly investigate the link between the strength of the visual signal and appearance (color, size, etc.).
B. Implications for the role of attention and the independence of chromatic and luminance mechanisms at cone threshold
Simultaneous reporting tasks have been used for at least the past four decades to compare detection and discrimination or identification thresholds (e.g., [30, 31]; and as described in [14]). In this manner, properties of the underlying mechanisms, e.g. bandwidth and interactions, can be evaluated. The idea is that thresholds for two mutually dependent mechanisms will be elevated in the simultaneous task relative to either task performed in isolation. For example, using a dual discrimination paradigm, Alais et al. [32] found interference within but not between vision (contrast discrimination) and audition (pitch discrimination), suggesting shared attentional resources in the former case but not in the latter. Similarly, that our subjects' detection thresholds were not negatively impacted in either of the simultaneous rating conditions (color-detection and size-detection) implies that these stimulus attributes do not recruit competing attentional resources [15, 16]. It is reasonable to presume, especially given our instructions to subjects, that the detection certainty rating task required luminance discrimination and the color rating task required chromatic discrimination. Given this assumption, the lack of interference we found in the simultaneous response condition is consistent with luminance and chromatic information being encoded in independent pathways (e.g., see [13, 33-35]).
The fact that detection thresholds in the simultaneous color-detection rating condition were lower for 3 subjects than in the detection-only rating condition, while detection criteria remained effectively unchanged, implies that subjects may be able to access more stimulus-relevant information when rating color appearance and detection certainty together than when rating detection certainty alone. While the non-interference of the color report task is consistent with independent luminance and chromatic pathways, the facilitation found for some subjects implies that information in both of these pathways is informative as to the presence of the stimulus at cone absolute threshold, yet subjects appear unable to marshal the attentional or motivational resources to make full use of this information without explicit instruction.
The involvement of both chromatic and luminance pathways in detection at cone threshold is also consistent with our subjects' use of chromatic and achromatic responses, under the assumption that chromatic responses at threshold reflect detection by chromatic mechanisms and achromatic responses reflect detection by luminance mechanisms [11]. The variability of both chromatic and achromatic responses for our subjects likely reflects variability in the relative excitation of the chromatic and achromatic pathways due to differences in the particular cones excited by the stimulus from trial to trial. Our results are also consistent with earlier work by Finkelstein and Hood [36, 37] where they conclude that detection of small (10 arcmin), brief lights on a photopic background may involve both opponent and non-opponent mechanisms.
That detection was apparently facilitated for some subjects in the simultaneous color-detection task is somewhat puzzling. If fully considering chromatic information improves detection performance, as we hypothesize, it is not clear why some subjects do not do so without explicit instruction. It may be that subjects are unaware of the relevance of the chromatic information (despite their considerable practice with the stimuli and task). It is possible that the explicit instructions to attend to and report color may have resulted in a sensory gain enhancement due to feature-selective attention [38], or may have allowed subjects to draw postdictively on feature characteristics already present in iconic memory (i.e., very short term visual memory) that would otherwise have been ignored (see [39]; and as discussed in [40]). The lack of the same facilitatory effect when simultaneously reporting size and detection certainty is possible either if relative size judgments were already being used to effectively inform detection certainty, or if they are otherwise inherent to detection of a luminance increment.
5. Conclusions
Our results show that subjects can report the appearance of small, threshold, foveal, stimuli without compromising detection. These results indicate that models developed to describe color appearance of these stimuli can incorporate typical cone detection parameters without the risk of underestimating either the signal to noise ratio or the number of cones involved in perception. Color ratings and detection certainty ratings (also size and detection certainty ratings) can also be validly combined into a simultaneous response task without elevating detection thresholds. This allows more direct experimental investigation of the link between the strength of the visual signal and appearance, which may assist in further constraining models of visual reconstruction. Most subjects were better able to detect the stimulus when simultaneously reporting color appearance and detection certainty than when reporting either attribute alone. This is consistent with separable pathways for luminance and color information, provided that both mechanisms contain information relevant for detection at absolute cone threshold.
Acknowledgments
The authors are grateful for the software support of Hope Queener and Lukasz Sterkowicz, and the optical and/or mechanical support of Chris Kuether, Charles Neff and Chueh Ting. These results were partially reported in poster form at the Optical Society of America's Fall Vision Meeting (2010) and the Association for Research in Vision and Ophthalmology (2011). This project was supported by NIH grants P30 EY07551 (CORE grant to UHCO) and R01 EY019069 (HJH).
Footnotes
Conflicts of Interest: Darren E. Koenig, None; Heidi J. Hofer, None
References
- 1.Young T. On the theory of light and colours. Phil Trans R Soc Lond. 1802;92:12–48. [Google Scholar]
- 2.Roorda A, Williams DR. The arrangement of the three cone classes in the living human eye. Nature. 1999;387:520–522. doi: 10.1038/17383. [DOI] [PubMed] [Google Scholar]
- 3.Hofer HJ, Carroll J, Neitz J, Neitz M, Williams DR. Organization of the human trichromatic cone mosaic. J Neurosci. 2005;25(42):9669–9679. doi: 10.1523/JNEUROSCI.2414-05.2005. [DOI] [PMC free article] [PubMed] [Google Scholar]
- 4.Williams DR. Advances in Photoreception: Proceedings of a Symposium on Frontiers of Visual Science. National Academy Press; 1990. The invisible cone mosaic; pp. 135–148. [PubMed] [Google Scholar]
- 5.Williams DR, Sekiguchi N, Haake W, Brainard D, Packer O. The cost of trichromacy for spatial vision. In: Valberg A, Lee BB, editors. From Pigments to Perception. Plenum Press; 1991. pp. 11–22. [Google Scholar]
- 6.Hofer HJ, Singer B, Williams DR. Different sensations from cones with the same photopigment. J Vis. 2005;5(5):5, 444–454. doi: 10.1167/5.5.5. [DOI] [PubMed] [Google Scholar]
- 7.Brainard DH, Williams DR, Hofer HJ. Trichromatic reconstruction from the interleaved cone mosaic: Bayesian model and the color appearance of small spots. J Vis. 2008;8(5):15, 1–23. doi: 10.1167/8.5.15. [DOI] [PMC free article] [PubMed] [Google Scholar]
- 8.Krauskopf J. On identifying detectors. In: Armstrong JC, Krauskopf J, editors. Visual Psychophysics and Physiology. Academic Press; 1978. pp. 283–295. [Google Scholar]
- 9.Otake S, Gowdy PD, Cicerone CM. The spatial arrangement of L and M cones in the peripheral human retina. Vis Res. 2000;40:677–693. doi: 10.1016/s0042-6989(99)00202-3. [DOI] [PubMed] [Google Scholar]
- 10.Marriott FHC. The foveal absolute visual threshold for short flashes and small fields. J Phys. 1963;169:416–423. doi: 10.1113/jphysiol.1963.sp007267. [DOI] [PMC free article] [PubMed] [Google Scholar]
- 11.King-Smith PE, Carden D. Luminance and opponent-color contributions to visual detection and adaptation and to temporal and spatial integration. J Opt Soc Am. 1976;66(7):709–717. doi: 10.1364/josa.66.000709. [DOI] [PubMed] [Google Scholar]
- 12.Mullen KT, Kulikowski JJ. Wavelength discrimination at detection threshold. J Opt Soc Am A. 1990;7(4):733–742. doi: 10.1364/josaa.7.000733. [DOI] [PubMed] [Google Scholar]
- 13.Lee BB, Sun H, Valberg A. Segregation of chromatic and luminance signals using a novel grating stimulus. J Physiol. 2011;589:59–73. doi: 10.1113/jphysiol.2010.188862. [DOI] [PMC free article] [PubMed] [Google Scholar]
- 14.Klein SA. Double-judgment psychophysics: problems and solutions. J Opt Soc Am A. 1985;2(9):1560–1585. doi: 10.1364/josaa.2.001560. [DOI] [PubMed] [Google Scholar]
- 15.Morrone MC, Denti V, Spinelli D. Different attentional resources modulate the gain mechanisms for color and luminance mechanisms. Vis Res. 2004;44:1389–1401. doi: 10.1016/j.visres.2003.10.014. [DOI] [PubMed] [Google Scholar]
- 16.Duncan J, Nimmo-Smith I. Objects and attributes in divided attention: Surface and boundary systems. Percept Psychoph. 1996;58(7):1076–1084. doi: 10.3758/bf03206834. [DOI] [PubMed] [Google Scholar]
- 17.Cicerone CM, Nerger JL. The relative numbers of long-wavelength-sensitive to middle-wavelength-sensitive cones in the human fovea. Vis Res. 1989;26:115–128. doi: 10.1016/0042-6989(89)90178-8. [DOI] [PubMed] [Google Scholar]
- 18.Rattle JD. Effect of target size on monocular fixation. Optica Acta. 1969;16:183–192. doi: 10.1080/713818162. [DOI] [PubMed] [Google Scholar]
- 19.Ditchburn RW. Eye Movements and Visual Perception. Clarendon Press; 1973. [Google Scholar]
- 20.Koenig DE, Hofer HJ. The absolute threshold of cone vision. J Vis. 2011;11(1):21, 1–24. doi: 10.1167/11.1.21. [DOI] [PMC free article] [PubMed] [Google Scholar]
- 21.Brainard DH. The psychophysics toolbox. Spat Vis. 10:433–436. [PubMed] [Google Scholar]
- 22.Pelli DG. The VideoToolbox software for visual psychophysics: Transforming numbers into movies. Spat Vis. 10:437–442. [PubMed] [Google Scholar]
- 23.McNicol D. A Primer of Signal Detection Theory. Lawrence Erlbaum Associates; 2005. [Google Scholar]
- 24.Gescheider GA. Psychophysics: The Fundamentals. Lawrence Erlbaum Associates; 1997. [Google Scholar]
- 25.Abramov I, Gordon J, Chan H. Color Appearance: Properties of the uniform appearance diagram derived from hue and saturation scaling. Atten Percept Psychophys. 2009;71(3):632–643. doi: 10.3758/APP.71.3.632. [DOI] [PubMed] [Google Scholar]
- 26.Krauskopf J, Srebro R. Spectral sensitivity of color mechanisms: Derivation form fluctuations of color appearance near threshold. Science. 1965;150:1477–1479. doi: 10.1126/science.150.3702.1477. [DOI] [PubMed] [Google Scholar]
- 27.Bouman MA, Walraven PL. Some color naming experiments with red and green monochromatic lights. J Opt Soc Am. 1957;57:834–839. doi: 10.1364/josa.47.000834. [DOI] [PubMed] [Google Scholar]
- 28.Sperling HG, Harwerth RS. Red-green cone interactions in the increment-threshold spectral sensitivity of primates. Science. 1971;172(3979):180–184. doi: 10.1126/science.172.3979.180. [DOI] [PubMed] [Google Scholar]
- 29.Spitzer H, Desimone R, Moran J. Increased attention enhances both behavioral and neuronal performance. Science. 1988;240(4850):338–340. doi: 10.1126/science.3353728. [DOI] [PubMed] [Google Scholar]
- 30.Nachmias J, Weber A. Discrimination of simple and complex gratings. Vis Res. 1975;15:217–223. doi: 10.1016/0042-6989(75)90210-2. [DOI] [PubMed] [Google Scholar]
- 31.Furchner CS, Thomas JP, Campbell FW. Detection and discrimination of simple and complex patterns at low spatial frequencies. Vis Res. 1977;17:827–836. doi: 10.1016/0042-6989(77)90126-2. [DOI] [PubMed] [Google Scholar]
- 32.Alais D, Morrone C, Burr D. Separate attentional resources for vision and audition. Proc R Soc B. 2006;273:1339–1345. doi: 10.1098/rspb.2005.3420. [DOI] [PMC free article] [PubMed] [Google Scholar]
- 33.Chaparro A, Stromeyer CF, Kronauer RE, Eskew RT. Separable red-green and luminance detectors for small flashes. Vis Res. 1993;34(6):751–762. doi: 10.1016/0042-6989(94)90214-3. [DOI] [PubMed] [Google Scholar]
- 34.Mullen KT, Losada MA. Evidence for separate pathways for color and luminance detection mechanisms. J Opt Soc Am A. 1994;11(12):3136–3151. doi: 10.1364/josaa.11.003136. [DOI] [PubMed] [Google Scholar]
- 35.Mullen KT, Sankeralli MJ. Evidence for the stochastic independence of the blue-yellow, red-green and luminance detection mechanisms revealed by subthreshold summation. Vis Res. 1999;39:733–745. doi: 10.1016/s0042-6989(98)00137-0. [DOI] [PubMed] [Google Scholar]
- 36.Finkelstein MA, Hood DC. Opponent-color cells can influence detection of small, brief lights. Vis Res. 1982;22:89–95. doi: 10.1016/0042-6989(82)90170-5. [DOI] [PubMed] [Google Scholar]
- 37.Finkelstein MA, Hood DC. Detection and discrimination of small, brief lights: variable tuning of opponent channels. Vis Res. 1984;24(3):175–181. doi: 10.1016/0042-6989(84)90119-6. [DOI] [PubMed] [Google Scholar]
- 38.Andersen SK, Müller MM, Hillyard SA. Color-selective attention need not be mediated by spatial attention. J Vis. 2009;9(6):2, 7. doi: 10.1167/9.6.2. [DOI] [PubMed] [Google Scholar]
- 39.Sperling G. The information available in brief visual presentations. Psychological Monographs. 1960;74(11):1–29. [Google Scholar]
- 40.Phillips I. Attention and iconic memory. In: Mole C, Smithies D, Wu W, editors. Attention: Philosophical and Psychological Essays. Oxford University Press; 2011. pp. 204–227. [Google Scholar]


