

Abstract
Objectives
Despite decreasing mortality rates in acute lung injury (ALI), studies of long term physical function in ALI survivors have consistently reported poorer quality of life persisting years into recovery for reasons that are not completely understood. We sought to determine if pulmonary dysfunction is independently associated with functional impairment among ALI survivors, and to determine if high resolution computed tomography could be used to predict its development.
Design
Secondary analysis of data from a randomized controlled trial in ALI.
Setting
Intensive care units at three academic medical centers.
Patients
Patients diagnosed with ALI who had high resolution computed tomography scans performed at 14 and/or 180 days after diagnosis.
Interventions
None.
Measurements and main results
An objective radiologic scoring system was used to quantify patterns present on chest high resolution computed tomography obtained at 14 and 180 days in patients with ALI. These scores were correlated in univariable and multivariable analyses with pulmonary function testing and quality of life survey data obtained at 180 days. Eighty-nine patients had evaluable data at day 14, and 47 at 180 days. At 180 days, increased radiologic scores for reticulation were associated with a decreased total lung capacity, forced vital capacity, and diffusing capacity for carbon monoxide (p values all <0.002). Decrements in quality of life attributable to pulmonary dysfunction were most strongly associated with higher radiologic scores. Additionally, radiologic scores at 14 days independently predicted poorer quality of life at 180 days, accounting for age, severity of illness, pneumonia as the ALI risk factor, and length of time on mechanical ventilation.
Conclusions
Among survivors of ALI, increasing chest high resolution computed tomography involvement correlated with restrictive physiology and poorer health related quality of life, implicating pulmonary dysfunction as a potential contributor to activity limitation in these patients.
Keywords: reticulation, biomarker, restriction, fibroproliferation, radiologic, pulmonary function
Introduction
Despite the lack of specific medical therapies to treat acute lung injury (ALI), mortality in this disorder has decreased to approximately 20–30% in academic medical centers and remained relatively static over the past decade(1;2), resulting in an increasing number of ALI survivors. Given the bilateral, severe lung involvement that is the sine qua non of ALI, coupled with the ubiquitous use of mechanical ventilation in these patients, it seems plausible that pulmonary dysfunction could contribute to poorer health-related quality of life among ALI survivors. Nevertheless, investigations have consistently attributed long-term functional impairment in survivors to neuromuscular weakness(3–5), while the contribution of residual pulmonary dysfunction has received less attention(6;7).
While prior investigations examining pulmonary function testing (PFT) in ALI survivors have reported normalization of median values for most parameters within months, approximately 25% of survivors exhibit a physiologic pattern consistent with restriction. This observation is exemplified in one well-characterized cohort of ALI survivors followed by Herridge and colleagues, where the percent predicted forced vital capacity (FVC), total lung capacity (TLC) and diffusing capacity for carbon monoxide (DLCO) were all below 80% one year after diagnosis(3), findings that persisted out to 5 years(4). Recent investigations in ALI survivors cared for with a low tidal volume ventilation strategy have confirmed these observations at 6 to 12 months (5–7). Published data suggest poorer quality of life in these ALI survivors (3;5;6), with reported correlations between pulmonary physiology and quality of life(5;6). However, it is unclear whether PFT abnormalities observed in ALI survivors are primarily from pulmonary or neuromuscular pathology since neuromuscular weakness has the potential to present as restrictive abnormality on PFTs. Therefore, the contribution of persistent pulmonary pathology to quality of life in ALI survivors remains incompletely understood.
Establishing the relative contribution of pulmonary impairment versus neuromuscular weakness to quality of life in ALI survivors has potentially important ramifications for therapy. To address these issues, we examined prospectively collected data from a cohort of ALI patients enrolled in a randomized controlled trial of granulocyte-macrophage colony stimulating factor (GMCSF). We hypothesized that among ALI survivors 180 days (6 months) after diagnosis, the extent of chest HRCT reticulation would correlate with PFT abnormalities suggesting restrictive dysfunction, and with poorer quality of life measured using validated questionnaires. Additionally, we postulated that the extent of chest HRCT reticulation at 14 days after ALI diagnosis would be associated with the subsequent development of PFT abnormalities consistent with restriction, and impaired quality of life 180 days after diagnosis.
Materials and Methods
Data were derived from an NIH-sponsored SCCOR project investigating the efficacy of GMCSF in a double blind randomized controlled trial for ALI (8).
Subjects examined
Individuals meeting criteria for ALI or ARDS by the American-European Consensus Conference definition were considered for enrollment(9). Patients with evidence of pre-existing chronic lung disease, including a history of GOLD stage III-IV COPD or interstitial lung disease (from any cause), were excluded. Enrolled subjects received standardized ventilator management based upon ARDS Network protocols(10). For our analysis, we evaluated patients with chest HRCTs performed at 14 and/or 180 days after ALI diagnosis and with PFTs available at 180 days after diagnosis (figure 1). Reasons for excluded patients not having had these tests performed included: death (either prior to 14 days or prior to 180 days), inability to safely tolerate HRCT per attending physician, lack of transportation to follow up site, persistent hospitalization at scheduled time for follow up, patient unwilling to proceed with study, investigator withdrawal of patient from the study, or study being halted by sponsor prior to completion of the 180 day follow up. Clinical data collected in the parent trial was used in our analyses. Mean daily tidal volume, positive end-expiratory pressure, and plateau pressure exposures were calculated by summing all available daily values for these parameters collected while patients were on mechanical ventilation, and dividing by the total number of days on mechanical ventilation.
Figure 1.
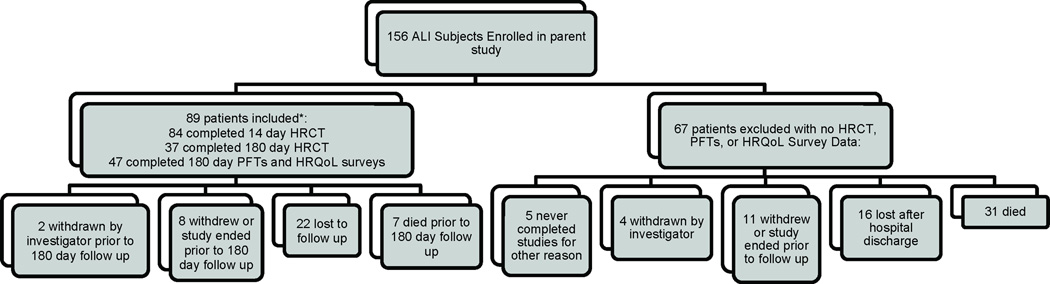
Derivation of study cohort from parent trial. *6 subjects had pulmonary function testing performed at 180 days, but did not undergo an HRCT of the chest at 14 days while inpatients. Eighty patients in the included group were randomized to study drug (43 GMCSF/37 placebo). ALI=acute lung injury; GMCSF=granulocyte macrophage colony stimulating factor; HRCT=high resolution computed tomography; PFTs=pulmonary function testing; HRQoL=health-related quality of life
High resolution CT scans
Chest HRCTs were performed at 14±2 and/or 180 days post ALI diagnosis. Mechanically ventilated patients were on ≥ 10 cm H2O PEEP during the HRCT(11). All patients underwent imaging at end-inspiration. Sections were obtained with 1.25-mm collimation and were reconstructed by using a high-spatial-frequency algorithm. All images were viewed at window settings optimized for assessment of lung parenchyma (window width, 1300 HU; window level, −500 HU). Completed HRCTs were evaluated by two chest radiologists using established methods (12;13). Images at 5 levels were assessed: aortic arch, 1cm above the dome of the right hemidiaphragm, and 3 additional levels equally spaced between these two levels. At each level, lungs were divided into anterior and posterior zones by drawing a horizontal line across the image, creating four quadrants for analysis per level. Specific radiologic patterns were quantified in each quadrant, including ground-glass opacification (GGO), intense parenchymal opacification (IPO), and reticulation. The extent of involvement for each pattern was assigned a numerical score, where 0=no involvement; 1= <5% involvement/minimal/not normal; 2= 5–25% involvement; 3=26–49% involvement; 4=50–75% involvement; and 5=greater than 75% involvement. For each radiologic pattern, the average score (range, 0–20) was calculated by summing all quadrant values for each of slice, adding these values together, and dividing by the number of slices with complete data. Missing data was scored as 0. Higher scores indicated more involvement by a given pattern.
Follow up of ALI survivors
In addition to the 180 day chest HRCT scan, patients underwent additional testing at 180 days after diagnosis including measurement of medical research council (MRC) scores (14–16), and PFTs. Additionally, patients completed short form (SF)-36 questionnaires (3–6;17) and St. George’s Respiratory Questionnaires (SGRQ)(6; 18–19). A clinically meaningful change in one’s SF-36 physical function score is 5 points (17), whereas a clinically meaningful change in the SGRQ is 4 points (18).
Statistical Analyses
Analyses with continuous data were performed with Student’s t test or the Wilcoxon rank sum test. Categorical data was analyzed using Fisher’s Exact Test. Correlation coefficients between continuous data were calculated by Spearman’s method. Linear regression was used to determine the association between HRCT scores (both from the 14 day and 180 day time points) and PFT parameters with (1) SF-36 scores, or (2) SGRQ scores, adjusting for potential confounders in these models. Finally, for some analyses, patients were stratified as having restrictive impairment (FVC and RV both <80% predicted) or not having restrictive impairment (FVC or RV ≥80% predicted) (20–21). Changes in HRCT scores over time in patients stratified using these criteria were evaluated using repeated measure ANOVA. Two-sided p values of <0.05 were deemed to be significant. JMP software (version 9, Cary, NC) was used in analyses.
Results
Description of cohort
The overall cohort was comprised of 89 patients who had PFTs and/or HRCTs available for analysis (figure 1). Overall demographic data for the 14 and 180 day groups is presented in table 1. These 89 patients had APACHE II scores of 18.1±7.4. Clinical characteristics of the 47 included patients who returned for 180 day follow up were similar to the 42 included patients who did not return (p>0.10 for all comparisons). Examination of data on the 67 patients enrolled in the parent trial, but not excluded in our final cohort of 89 patients revealed a 43% 28 day mortality that would clearly limit follow up, as well as higher severity of illness scores, and fewer ventilator-, ICU- and hospital-free days, along with a higher average PEEP and plateau pressure exposure. The percentage of patients among those excluded also contained a greater absolute percentage of African-Americans.
Table 1.
Demographic features from ALI survivors at with evaluable pulmonary function testing and /or high resolution CT scan data at 14 and 180 days post ALI diagnosis, and features from excluded ALI patients without such data.
| Characteristic | Included Patients with 14 day data n=89 |
Included Patients with 180 day data n=47* |
Patients excluded from analysis n=67 |
Comparison between Included** and Excluded Subjects |
|---|---|---|---|---|
| APACHE II score on admission | 18 (7) | 19 (7) | 23 (7) | <0.0001 |
| Highest total SOFA, week 1 | 10.7 (3.9) | 10.2 (4.0) | 12.8 (4.3) | 0.002 |
| Qualifying PaO2/FiO2 | 110 (49) | 110 (49) | 132 (58) | 0.08 |
| 28 day survival, % | 100% | 97% | 57% | 0.0001 |
| Ventilator-free days | 12.0 (8.3) | 12.8 (8.3) | 6.6 (8.1) | 0.0002 |
| ICU-free days | 8.4 (7.8) | 9.0 (8.2) | 4.5 (8.1) | 0.009 |
| Hospital-free days | 5.0 (6.2) | 5.8 (6.9) | 2.6 (5.6) | 0.02 |
| Average daily tidal volume while on mechanical ventilation, mL | 469 (90) | 481 (89) | 459 (83) | 0.44 |
| Average daily PEEP exposure while on mechanical ventilation, cm H2O | 7.8 (1.7) | 7.8 (1.5) | 9.2 (3.4) | 0.001 |
| Average daily plateau pressure while on mechanical ventilation, cm H2O | 23 (4) | 23 (5) | 26 (6) | 0.0006 |
| Sepsis diagnosis (1° or 2°), % | 67% | 60% | 67% | 0.86 |
| Aspiration diagnosis (1° or 2°), % | 16% | 17% | 24% | 0.31 |
| Pneumonia diagnosis (1° or 2°), % | 62% | 57% | 67% | 0.86 |
| Pulmonary source (as 1°), % | 51% | 49% | 49% | 1.0 |
| Average Age, years | 48 (14) | 46 (14) | 49 (15) | 0.48 |
| Race (%white/%black/%other) | 84%/12%/4% | 83%/13%/2% | 58%/37%/5% | 0.002 |
| Gender, % men | 57% | 60% | 61% | 0.74 |
| Received active GMCSF, number (%) | 39/89 (43%) | 22/47 (47%) | 23/66 (34%) | 0.29 |
| Subjects with HRCT of chest performed, number | 84/89 | 37/47 | 0/66 | n/a |
Numbers in parentheses are standard deviations. APACHE=Acute physiology and chronic health evaluation; SOFA=sequential organ failure assessment; PEEP=positive end expiratory pressure; GMCSF=granulocyte monocyte colony stimulating factor; HRCT=high resolution computed tomography.
p>0.10 for all comparisons between patients who had data only at 14 days (n=43) compared to those with data at 180 days (n=47).
Comparison between 89 subjects included versus 66 who were excluded from subsequent analyses.
Key features of HRCTs and 180 day data
HRCT average scores for reticulation, GGO, and IPO patterns were examined at each time point. For all 3 patterns, scores significantly decreased over time (p<0.05 for all comparisons, figure 2). Unique HRCT scores and the overall HRCT score within patients who had two available scans (the first at day 14 and the second at day 180) were moderate-to-highly correlated (reticulation, r=0.60; GGO, r=0.54; IPO, r=0.45; and overall, r=0.68). Median values for the majority of PFT parameters examined at 180 days in the 47 patients were greater than 80% predicted (table 2). However, as reported previously, approximately 25% of survivors had abnormal PFT values (defined as values <80% predicted). Five of the 47 subjects (11%) had MRC total scores ≤48 at 180 days, consistent with neuromuscular weakness (15;16). Median role physical SF-36 scores were most abnormal in these ALI patients at 180 days; for the SGRQ domains, activity scores were most abnormal.
Figure 2.

Chest high resolution CT Scores for ALI patients in the cohort. At 14 days, scores for GGO pattern were the most elevated, while at 180 days, reticulation and GGO scores did not differ significantly. For all three patterns, scores decreased significantly over time (p<0.0001). GGO=ground glass opacification; IPO=intense parenchymal opacification. Bars=means of data; black lines=standard deviation.
Table 2.
Results from assessments performed in ALI survivors at 180 days.
| Parameter | Results, n=47* |
|---|---|
| Forced vital capacity (FVC), % predicted | 82 (71–95) |
| Slow vital capacity (SVC), % predicted | 85 (68–96) |
| Forced expiratory volume in first second of exhalation (FEV1), % predicted | 81 (69–97) |
| FEV1/FVC ratio, % | 78 (70–85) |
| Total Lung Capacity (TLC), % predicted | 86 (77–99) |
| Functional residual capacity (FRC), % predicted | 82 (69–99) |
| Residual volume (RV), % predicted | 94 (77–114) |
| Diffusing Capacity for Carbon Monoxide (DLCO), % predicted | 68 (55–81) |
| Diffusing Capacity for Carbon Monoxide, Corrected for Alveolar Volume, % predicted | 88 (71–99) |
| Medical Research Council Score | 60 (56–60) |
| SF-36 Role Physical | 50 (25–94) |
| SF-36 Physical Function | 70 (20–90) |
| SF-36 Physical Health Subtotal | 58 (31–76) |
| SF-36 Total Score | 60 (33–84) |
| SGRQ Symptoms Score | 18 (9–40) |
| SGRQ Impact Score | 13 (0–36) |
| SGRQ Activity Score | 32 (6–70) |
| SGRQ Total Score | 20 (6–43) |
Values are medians (intraquartile range). SF-36= short form 36; SGRQ=St. George’s Respiratory Questionnaire.
Three patients were unable to perform maneuvers to obtain lung volumes.
Among ALI survivors, 180 day chest HRCT scores correlate with 180 day PFT parameters
To address our hypothesis that restrictive dysfunction specifically due to pulmonary disease is present among a subset of ALI survivors, the relationship between HRCT scores and PFT parameters were examined from patients who had both tests performed at 180 days (top half of table 3). Higher reticulation scores were strongly associated with a decreased FVC (r= −0.60, p=0.0004), while higher GGO scores were strongly associated with a decreased TLC (r= −0.50, p=0.001) and RV (r= −0.50, p=0.007). The IPO score was inversely associated with the DLCO (r=−0.60, p=0.0004). Overall HRCT scores were mostly strongly associated with a decreased TLC (r= −0.60, p=0.003). Notably, not all patients with abnormally low PFT values had concurrently elevated HRCT scores at the 180 day time point (supplemental digital content-1).
Table 3.
Correlations between high resolution chest CT patterns (both at 14 and 180 days post ALI diagnosis) and pulmonary function testing parameters at 180 days
| Pulmonary Function Testing Parameters at 180 Days after ALI Diagnosis | |||||||||||||||||||
|---|---|---|---|---|---|---|---|---|---|---|---|---|---|---|---|---|---|---|---|
| FVC, %predicted | FEV1/FVC ratio | TLC, %predicted | RV, %predicted | DLCO/VA, %predicted | DLCO, %predicted | ||||||||||||||
| R2 | r | P value |
R2 | r | P value |
R2 | r | P value |
R2 | r | P value |
R2 | r | P value |
R2 | r | P value |
||
| Chest HRCT Pattern Scores At 180 Days after ALI Diagnosis | Reticulation | 0.31 | −0.6 | 0.0004 | 0.06 | 0.2 | 0.16 | 0.30 | −0.5 | 0.0008 | 0.09 | −0.3 | 0.08 | 0.07 | −0.3 | 0.13 | 0.25 | −0.5 | 0.002 |
| GGO | 0.17 | −0.4 | 0.01 | 0.20 | 0.4 | 0.007 | 0.28 | −0.5 | 0.001 | 0.21 | −0.5 | 0.007 | 0.02 | −0.1 | 0.46 | 0.16 | −0.4 | 0.02 | |
| IPO | 0.18 | −0.4 | 0.01 | 0.02 | 0.1 | 0.38 | 0.22 | −0.5 | 0.006 | 0.06 | −0.2 | 0.16 | 0.21 | −0.5 | 0.006 | 0.32 | −0.6 | 0.0004 | |
| Overall | 0.27 | −0.5 | 0.001 | 0.14 | 0.4 | 0.03 | 0.34 | −0.6 | 0.003 | 0.18 | −0.4 | 0.01 | 0.06 | −0.2 | 0.16 | 0.26 | −0.5 | 0.002 | |
| Chest HRCT Pattern Scores At 14 Days after ALI Diagnosis | Reticulation | 0.15 | −0.4 | 0.01 | 0.05 | 0.2 | 0.16 | 0.37 | −0.6 | 0.0001 | 0.17 | −0.4 | 0.009 | 0.02 | −0.2 | 0.34 | 0.26 | −0.5 | 0.0005 |
| GGO | 0.08 | −0.3 | 0.07 | 0.06 | 0.2 | 0.11 | 0.34 | −0.6 | 0.0001 | 0.20 | −0.4 | 0.005 | 0.001 | −0.03 | 0.82 | 0.16 | −0.4 | 0.008 | |
| IPO | 0.05 | −0.2 | 0.17 | 0.04 | 0.2 | 0.17 | 0.23 | −0.5 | 0.002 | 0.17 | −0.4 | 0.009 | 0.01 | −0.1 | 0.58 | 0.10 | −0.3 | 0.04 | |
| Overall | 0.11 | −0.3 | 0.03 | 0.06 | 0.3 | 0.12 | 0.38 | −0.6 | 0.0001 | 0.22 | −0.5 | 0.003 | 0.01 | −0.1 | 0.57 | 0.20 | −0.5 | 0.002 | |
GGO=ground glass opacification; IPO=intense parenchymal opacification; FVC=forced vital capacity; TLC=total lung capacity; RV=residual volume; DLCO=diffusing capacity for carbon monoxide uncorrected for alveolar volume
Among ALI survivors, 180 day HRCT scores correlate with 180 day HRQoL
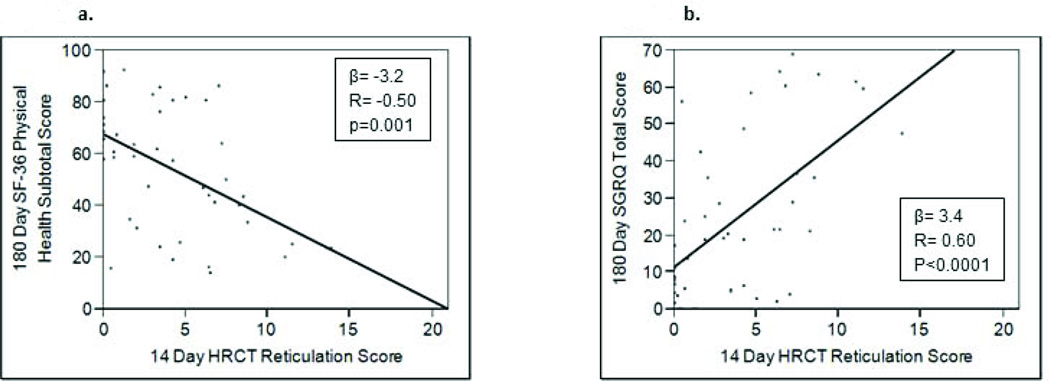
To determine if the degree of HRCT abnormalities in ALI survivors indicated pulmonary dysfunction that affects quality of life, HRCT scores were examined in association with SF-36 and SGRQ scores. In 37 patients who had undergone both HRCT exams and completed the SF-36 questionnaire, moderate strength associations between poorer SF-36 physical function, role physical, and physical health subtotal scores with HRCT reticulation, GGO, IPO, and overall scores were observed (r ≤ −0.40, p<0.05 for all comparisons, top of table 4a). However, reticulation and overall HRCT scores at 180 days demonstrated a moderate-to-strong correlation with poorer SGRQ impacts scores, activity scores and total scores (r = −0.50 to −0.60, p<0.003 for all comparisons, top of table 4b). Relationships between reticulation HRCT scores with quality of life indices were most pronounced, as illustrated in figure 3. PFT parameters at 180 days are associated with clinical factors and HRQoL. Using these data, moderate-to-strong associations between the FVC, TLC, and DLCO (uncorrected) and SF-36 parameters (r= −0.50 to −0.60, supplemental digital content-2) were observed, while somewhat weaker negative associations were observed between the 180 day SGRQ scores and the 180 day FVC and TLC (r= −0.40 to −0.50, supplemental digital content-2). We examined the relationship between PFTs and characteristics of critical illness, and determined that pulmonary-specific clinical patient factors were also associated with 180 day PFT variables, including the average plateau pressure exposure (versus TLC, r=−0.55, p=0.0001; versus FVC, r= −0.34, p=0.02) and the number of ventilator-free days (versus DLCO, r=0.41, p=0.005). Similarly, pneumonia as a primary or secondary risk factor for ALI was associated with a lower RV (88±21% vs. 112±37%, p=0.01), while a primary pulmonary cause for ALI (e.g. pneumonia or aspiration) was associated with a higher FEV1/FVC ratio (83±8% vs. 74±7%, p=0.0002); no relationship between the qualifying PaO2/FiO2 and any PFT parameter was observed. Neither APACHE II scores nor week one SOFA scores correlated with any PFT variable at 180 days. However, at 180 days, the MRC score displayed a modest relationship with the FVC (r=0.41, p=0.004), and the DLCO (uncorrected) (r=0.42, p=0.005).
Table 4.
Correlations between chest HRCT data at 180 and 14 days with health-related quality of life questionnaires obtained in ALI survivors at 180 days follow up.
| 4a. Short Form-36 Questionnaire (physical health-related domains) performed at 180 days. | ||||||||||
|---|---|---|---|---|---|---|---|---|---|---|
| SF-36 Parameters at 180 Days after ALI Diagnosis | ||||||||||
| Physical Function | Role Physical | Physical Health Subtotal | ||||||||
| R2 | r | p value | R2 | r | p value | R2 | r | p value | ||
| Chest HRCT Pattern Scores At 180 Days after ALI Diagnosis | Reticulation | 0.15 | −0.4 | 0.02 | 0.17 | −0.4 | 0.02 | 0.16 | −0.4 | 0.02 |
| GGO | 0.16 | −0.4 | 0.02 | 0.14 | −0.4 | 0.03 | 0.14 | −0.4 | 0.03 | |
| IPO | 0.12 | −0.3 | 0.05 | 0.14 | −0.4 | 0.03 | 0.13 | −0.4 | 0.04 | |
| Overall | 0.19 | −0.4 | 0.01 | 0.19 | −0.4 | 0.01 | 0.16 | −0.4 | 0.01 | |
| Chest HRCT Pattern Scores At 14 Days after ALI Diagnosis | Reticulation | 0.19 | −0.4 | 0.004 | 0.27 | −0.5 | 0.0003 | 0.23 | −0.5 | 0.001 |
| GGO | 0.12 | −0.3 | 0.03 | 0.19 | −0.4 | 0.004 | 0.18 | −0.4 | 0.005 | |
| IPO | 0.06 | −0.2 | 0.12 | 0.08 | −0.3 | 0.08 | 0.07 | −0.3 | 0.09 | |
| Overall | 0.16 | −0.4 | 0.008 | 0.21 | −0.5 | 0.001 | 0.20 | −0.5 | 0.002 | |
| 4b. St. George’s Respiratory Questionnaire performed at 180 days. | |||||||||||||
|---|---|---|---|---|---|---|---|---|---|---|---|---|---|
| SGRQ Parameters at 180 Days after ALI Diagnosis | |||||||||||||
| Symptoms Score | Activity Score | Impacts Score | Total Score | ||||||||||
| R2 | r | p value |
R2 | r | p value |
R2 | r | p value |
R2 | r | p value |
||
| Chest HRCT Pattern Scores At 180 Days after ALI Diagnosis | Reticulation | 0.08 | 0.3 | 0.10 | 0.24 | 0.5 | 0.003 | 0.32 | 0.6 | 0.0004 | 0.28 | 0.5 | 0.001 |
| GGO | 0.01 | 0.1 | 0.50 | 0.18 | 0.4 | 0.01 | 0.23 | 0.5 | 0.003 | 0.19 | 0.4 | 0.009 | |
| IPO | 0.05 | 0.2 | 0.17 | 0.17 | 0.4 | 0.01 | 0.14 | 0.4 | 0.03 | 0.16 | 0.4 | 0.002 | |
| Overall | 0.04 | 0.2 | 0.21 | 0.22 | 0.5 | 0.002 | 0.31 | 0.6 | 0.0005 | 0.25 | 0.5 | 0.002 | |
| Chest HRCT Pattern Scores At 14 Days after ALI Diagnosis | Reticulation | 0.09 | 0.3 | 0.05 | 0.39 | 0.6 | 0.001 | 0.26 | 0.5 | 0.0004 | 0.33 | 0.6 | 0.0001 |
| GGO | 0.03 | 0.2 | 0.28 | 0.26 | 0.5 | 0.0005 | 0.20 | 0.4 | 0.003 | 0.21 | 0.5 | 0.002 | |
| IPO | 0.03 | 0.2 | 0.29 | 0.13 | 0.4 | 0.02 | 0.15 | 0.4 | 0.009 | 0.14 | 0.4 | 0.001 | |
| Overall | 0.05 | 0.2 | 0.13 | 0.31 | 0.6 | 0.0001 | 0.22 | 0.5 | 0.0008 | 0.27 | 0.5 | 0.0003 | |
GGO=ground glass opacification; IPO=intense parenchymal opacification
Figure 3.

Examining the relationship between 180 day high resolution CT (HRCT) scores and health-related quality of life measurements revealed that as HRCT scores increased, quality of life was adversely affected, as indicated by lower short form (SF)-36 scores and higher St. George’s Respiratory Questionnaire (SGRQ) scores. (3a) HRCT reticulation score and SF-36 physical health subtotal; (3b) HRCT reticulation score and SGRQ Total Score.
HRCT scores at 180 days are associated with pulmonary-specific clinical factors
As with 180 day PFTs, pulmonary-specific indices in ALI patients were also associated with 180 day chest HRCT scores, including average PEEP exposure (r=0.38, p=0.02 versus GGO; r=0.33 p=0.05 versus HRCT total score) and average plateau pressure exposure (r=0.37, p=0.03 versus reticulation; r=0.54, p=0.0007 versus GGO; r=0.48, p=0.003 versus HRCT total score). Moreover, a diagnosis of pneumonia as either a primary or secondary risk factor for ALI was associated with significantly higher chest HRCT scores at 180 days (3.2 (IQR 1.6–10.1) versus 1.8 (IQR 0–3.4), p=0.03 for difference in overall HRCT score between groups). There were no significant differences in HRCT scores between patients with primary pulmonary versus those with non-pulmonary etiologies of ALI, and as was seen with PFT data, no significant relationships were observed between any HRCT score and APACHE II score, SOFA score, qualifying PaO2/FiO2 ratio, or the number of days on the ventilator (p values all >0.05). In contrast to what was observed with PFTs, no significant associations between 180 day MRC scores and chest HRCT scores for reticulation (p=0.33), GGO (p=0.70), or IPO (p=0.46) were observed.
Pulmonary dysfunction is independently associated with HRQoL in ALI
Multivariable analyses were performed to understand the influence of pulmonary dysfunction, neuromuscular weakness, and severity of illness on 180 day HRQoL. At 180 days, the FVC was the only variable independently associated with the SF-36 physical health subtotal score when 180 day overall HRCT score, the TLC value, MRC score, APACHE II score, age, number of days on the ventilator, average plateau pressure exposure, and pneumonia as ALI risk factor (yes/no) were included in the model (R2 for model 0.34, β for FVC 0.75±0.16, p<0.0001). In contrast, the 180 day chest HRCT overall score (β=0.99, p=0.07) as well as the FVC (β= −0.49, p=0.03) were both associated with a poorer SGRQ total score at 180 days, accounting for these same potential confounders (R2 for model 0.37).
Chest HRCT scores at 14 days predict restrictive PFT abnormalities at 180 days
To determine if radiologic patterns on chest HRCTs obtained at 14 days after ALI diagnosis would correlate with restrictive physiology at 180 days, data from 43 ALI patients who had had both studies performed were examined (bottom of table 3). Reticulation scores at day 14 were associated with a lower 180 day TLC (r=−0.60, p<0.0001) and DLCO (r=−0.50, p=0.0005). The overall HRCT score was similarly associated with these two parameters, and with a decreased RV (r= −0.50, p=0.003). GGO and IPO scores were also inversely associated with the TLC. Figure 4 highlights the relationships between 14 day chest HRCT scores and % predicted TLC. When patients were stratified on the presence or absence of restrictive physiology at 180 days (using the criteria of FVC and RV <80%, yes or no), reticulation, GGO, IPO and overall HRCT scores all decreased significantly over time for each group of patients (p values <0.03 for within groups change over time). However, HRCT scores in the restricted group were significantly higher at both the 14 and 180 day time points for all pattern scores and the overall score (reticulation, p<0.0001; GGO, p=0.0001; IPO, p=0.0007; overall, p<0.0001 for comparisons between restricted and non-restricted groups).
Figure 4.

180 day percent predicted total lung capacity versus 14 day chest high resolution CT scores. Examining the relationship between 14 day high resolution CT (HRCT) scores for (3a) reticulation, (3b) ground glass opacification (GGO), (3c) intense parenchymal opacifiation (IPO), and (3d) overall with the % predicted total lung capacity (TLC) at 180 days after ALI diagnosis revealed significant inverse associations. The HRCT overall score was calculated by totaling scores for reticulation, GGO, and IPO.
Chest HRCT patterns at 14 days predict 180 day HRQoL
To determine if 14 day HRCT scores could be utilized in the prediction of 180 day HRQoL, correlations between these data were evaluated. As illustrated in the bottom of table 4a, higher day 14 chest HRCT reticulation and overall scores demonstrated strong correlations with poorer SF-36 role physical (r= −0.50, p=0.0003; r=−0.50, p=0.001, respectively), and with the physical health subtotal (r=−0.50, p<0.001; r=−0.50, p=0.002, respectively) scores at 180 days. Similarly, when 14 day HRCT scores were compared with SGRQ scores from 180 days, moderate-to strong correlations (suggesting poorer quality of life) were noted for activity, impact and total SGRQ scores in relationship to scores for reticulation, GGO, and the overall HRCT score (bottom of table 4b). Figure 5 illustrates some of the key relationships between reticulation HRCT scores with quality of life indices whereregression coefficients demonstrated the most pronounced correlations.
Figure 5.
Examining the relationship between 14 Day high resolution CT (HRCT) scores and 180 day health-related quality of life measurements revealed that higher HRCT scores correlated with poorer quality of life. (4a) HRCT reticulation score and short form (SF)-36 physical health subtotal scores; (4b) HRCT reticulation score and St. George’s Respiratory Questionnaire (SGRQ) Total Score.
HRCT scores at 14 days are associated with pulmonary-specific clinical factors
To examine potential clinical influences on the 14 day HRCT patterns, clinical variables were examined in the context of HRCTs. Higher overall HRCT scores were associated with fewer ventilator-free (r=−0.34, p=0.002), ICU-free (r=−0.40, p=0.0002), and hospital-free (r=−0.45, p<0.0001) days; no relationships between this HRCT value and either age, qualifying PaO2/FiO2, APACHE II or week one SOFA scores was evident. Overall HRCT scores did not differ based on pulmonary versus non-pulmonary etiology of ALI; however, in patients who had pneumonia as either a primary or secondary ALI etiology, the median 14 day score was 15 (IQR 9–25) versus 12 (IQR 4–17), p=0.04. No differences in 14 day HRCT scores were observed that varied according to gender, randomization to active study drug, race, or 28 day survival.
HRCT scores at 14 days are independently associated with HRQoL in ALI survivors at 180 days
In multivariable analyses, day 14 chest HRCT reticulation scores were independently associated with SF-36 physical function (p=0.04), role physical (p=0.0004), and physical health subtotal (p=0.005) scores at 180 days, accounting for the patient’s age, the number of days on the ventilator, whether or not the patient had pneumonia as an ALI risk factor, and severity of illness (APACHE II scores). The GGO and overall HRCT scores were also independently related to these SF-36 domains, accounting for these covariates. The parameter estimates were the highest when 14 day HRCT reticulation scores were fit in these models (see supplemental digital content-3).
Chest HRCT reticulation scores were also determined to be independently associated with SGRQ activity scores (p=0.0002), impact scores (p=0.008), and the total score (p=0.002) in a multivariable model, again accounting for patient age, number of ventilated days, whether or not the patient had pneumonia as an ALI risk factor, and severity of illness. Similarly, GGO and overall scores were independently correlated with SGRQ activity, impact, and total scores accounting for these same four covariates. Once again, the parameter estimates were highest when 14 day HRCT reticulation scores were included in these models (supplemental digital content-3).
Discussion
In these investigations, using prospectively collected data from ALI patients, we observed that a subset of patients have both PFT and HRCT abnormalities 180 days after diagnosis. Moreover, at this time point, the degree of chest HRCT reticulation, GGO, and IPO (and their combination) correlated with a lower FVC, TLC, RV, and DLCO, consistent with restrictive pulmonary dysfunction. Additionally, as 180 day reticulation HRCT scores increased, a clinically relevant decrease in HRQoL was evident. In multivariable analyses, the quantity of HRCT involvement and the FVC at 180 days were independently associated with impaired HRQoL on validated surveys, independent of neuromuscular weakness, age, and severity of illness. The association between 180 day HRCT abnormalities, restrictive pulmonary physiology, and quality of life suggests that persistent respiratory dysfunction has a measureable impact on the physical capabilities of ALI survivors. Separate analyses using data from HRCTs obtained at day 14 after ALI diagnosis revealed a negative association between reticulation and overall HRCT scores with 180 day TLC, RV, and DLCO. These 14 day HRCT scores also predicted poorer HRQoL, independent of age, severity of illness, pneumonia as the etiology of ALI, and length of time on the ventilator. These latter data suggest that HRCTs obtained during hospitalization could aid in prognostication of long-term outcomes for ALI survivors.
Numerous investigations involving ALI survivors have reported poorer quality of life persisting months to years after the acute phase of illness (3–7). PFTs performed in these patients have revealed physiologic abnormalities similar to our observations. Both Heyland(6) and Orme(5) linked specific PFT abnormalities found in ALI survivors to long-term functional outcomes, observing that SF-36 and SGRQ values correlated significantly with PFT results among ALI survivors at 6 and 12 months. Our data support these earlier observations, and the magnitude of the correlations we observed in univariate analyses between the FVC, TLC, and DLCO with SF-36/SGRQ parameters was comparable to their reports.
Our data demonstrated that certain pulmonary-specific clinical factors (e.g. a diagnosis of pneumonia) were associated with both HRCT scores and PFT parameters; in contrast, the MRC score, indicating neuromuscular strength, only correlated with PFTs at 180 days. Also, at 180 day follow up, we determined that individual PFT parameters were more strongly associated with the SF-36, while HRCT scores were more strongly associated with the SGRQ. Notably, the SGRQ focuses on quantifying respiratory symptoms (e.g. cough or wheezing), the effect of respiratory problems on the ability to work or perform activities of daily living, and the impact of respiratory problems on daily life. The pulmonary-specific nature of these questions contrasts with SF-36 question content that does quantitate physical capabilities, but does not explicitly query lung symptomatology. Along these same lines, lung appearance on HRCT of the chest would be expected to reflect pulmonary-specific pathology. Therefore, the stronger associations between SGRQ and chest HRCT (in comparison to SF-36 and chest HRCT) as we observed provides additional support for HRQoL dysfunction among ALI survivors specifically referable to residual pulmonary impairment.
As lung biopsies are usually not performed patients with ALI, patterns observed in chest CT imaging have indirectly provided insight to the natural history of ALI, and have an acceptable risk in these patients. HRCT scanning of the chest days after ALI diagnosis typically displays radiographic ground glass and intense parenchymal opacification patterns (12), consistent with inflammation and airspace disease, whereas a predominantly reticular pattern is observed months later (12;22), despite the use of low tidal volume ventilator strategies(7). These dynamic HRCT changes in ALI prompted the development of a scoring system to define the correlation between radiologic patterns and clinical outcomes. Investigators reported that a higher overall composite score correlated with poorer short-term outcomes in ALI, including mortality(13). Our work provides evidence that HRCT radiologic scoring, particularly for reticulation, could provide useful information regarding respiratory dysfunction among ALI survivors.
An abnormal fibroproliferative response to ALI represents one possible explanation for the physiologic and radiologic abnormalities we observed. Translational ALI investigations suggest that pulmonary fibroproliferation begins within 72 hours of ALI diagnosis (23–26), and that pro-fibrotic activity is associated with important clinical outcomes, including mortality(23–25). Histologically, moderate to severe fibrosis has been demonstrated in 20% of ALI patients within 10 days of diagnosis, and has been associated with increased mortality (57%) (27). Nevertheless, more recent investigations have called the relevance of fibroproliferation to long-term ALI outcomes into question. Some investigations support that pro-fibrotic mechanisms are harmful (28–29), but others have reported a relationship between pro-fibrotic mechanisms and survival(30), as well as less time on mechanical ventilation(31). At the current time, the exact relationship of mediators and cells involved in long term functional outcomes, including restrictive pathophysiology, is not well established.
While our findings with this cohort of ALI patients are intriguing, they are not without limitations. First, the number of patients with data available at both 14 and 180 days was modest, and patients were racially homogeneous. The functional (and vital) status of some enrolled patients who did not follow up is unknown. However, given that the data were derived from a multi-center clinical trial where numerous possible confounders were controlled, we believe that our observations provide novel insight to the potential utility of HRCT in understanding ALI pathogenesis. Second, radiographic HRCT patterns were scored by 2 chest radiologists with HRCT interpretation experience. Whether radiologists without such HRCT interpretation experience would provide similar interpretations of these patterns is unknown. Additionally, MRC scores could have varied from observer to observer across sites affecting the validity of this outcome variable. However, clinicians performing these examinations did not have access to other long-term outcome variables, thus diminishing the potential for bias. Recently published investigations examining the reproducibility of MRC scores in patients, including critical illness survivors, suggest that inter-rater reliability is in fact quite good in this population (32;33). Nevertheless, formal nerve conduction studies/electromyographic testing in weak patients (with abnormal MRC scores) would have been helpful in confirming true neuromuscular dysfunction in this population (34). Finally, since enrolled patients were not screened with PFTs nor HRCT prior to enrollment, it is possible that some had pre-existing lung disease that confounded our results. However, a history of pre-existing lung disease was a specific exclusion criterion for this study. Moreover, it seems equally possible that ALI contributed to persistently higher HRCT scores at 180 days in a subset of survivors, particularly given the relatively young age of the cohort (making diseases such as IPF less likely), and the severity of the patients’ illness. Overall, the strength of these investigations lies in the prospective data collection (including physiologic and radiologic data) in a sizable number of ALI patients from multiple sites who were also receiving standardized ICU care, including a low tidal volume ventilator strategy.
Conclusion
Based on physiologic and radiologic data, and their correlation with quality of life measures, symptomatic pulmonary dysfunction is present in a substantial number of ALI survivors 180 days after the diagnosis of illness, independent of neuromuscular weakness. Further, quantifying the extent of chest HRCT involvement 14 days after ALI diagnosis may represent a useful, non-invasive strategy to predict symptomatic pulmonary dysfunction in survivors. Our observations pave the way to establish the prevalence of pulmonary dysfunction among ALI survivors more accurately, and to promote its earlier identification. Developing these concepts will enable the development of therapies to promote survival and enhance quality of life in ALI patients at risk for pulmonary dysfunction.
Supplementary Material
Supplemental Digital Content-1: 180 day percent predicted total lung capacity versus 180 day chest high resolution CT scores. An inverse relationship between % predicted total lung capacity (TLC) and chest high resolution CT (HRCT) scores evaluated at 180 days after ALI diagnosis was observed for all patterns examined, including, (1a) reticulation, (1b) ground glass opacification (GGO), (1c) intense parenchymal opacifiation (IPO), and (1d) overall HRCT score. The overall HRCT score was calculated by totaling together scores for reticulation, GGO, and IPO. 34 ALI survivors underwent both HRCT of the chest, as well as plethysmography to measure TLC at this 180 day time point.
Supplemental Digital Content-2: Pulmonary function testing compared with health related quality of life at 180 days.
Supplemental Digital Content-3: Relationship between HRCT score at 14 days, inpatient clinical variables, and 180 HRQoL as assessed by either the SF-36, or SGRQ.
Acknowledgements
Supported by: P50 HL074024
The authors wish to thank patients and staff at the University of Michigan Medical Center, Grady Memorial Hospital, and University of Colorado Hospital, who participated in this project.
Footnotes
Publisher's Disclaimer: This is a PDF file of an unedited manuscript that has been accepted for publication. As a service to our customers we are providing this early version of the manuscript. The manuscript will undergo copyediting, typesetting, and review of the resulting proof before it is published in its final citable form. Please note that during the production process errors may be discovered which could affect the content, and all legal disclaimers that apply to the journal pertain.
Work contained herein was performed at the University of Michigan School of Medicine, Emory University School of Medicine, and the University of Colorado School of Medicine
The authors have not disclosed any potential conflicts of interest
Reference List
- 1.Matthay MA, Brower RG, Carson S, Douglas IS, Eisner M, Hite D, Holets S, Kallet RH, Liu KD, MacIntyre N, et al. Randomized, Placebo-Controlled Clinical Trial of an Aerosolized Beta-2 Agonist for Treatment of Acute Lung Injury. Am. J. Respir. Crit Care Med. 2011 doi: 10.1164/rccm.201012-2090OC. [DOI] [PMC free article] [PubMed] [Google Scholar]
- 2.Wiedemann HP, Wheeler AP, Bernard GR, Thompson BT, Hayden D, deBoisblanc B, Connors AF, Jr, Hite RD, Harabin AL. Comparison of two fluid-management strategies in acute lung injury. N. Engl. J. Med. 2006;354:2564–2575. doi: 10.1056/NEJMoa062200. [DOI] [PubMed] [Google Scholar]
- 3.Herridge MS, Cheung AM, Tansey CM, Matte-Martyn A, Diaz-Granados N, Al-Saidi F, Cooper AB, Guest CB, Mazer CD, Mehta S, et al. One-year outcomes in survivors of the acute respiratory distress syndrome. N. Engl. J. Med. 2003;348:683–693. doi: 10.1056/NEJMoa022450. [DOI] [PubMed] [Google Scholar]
- 4.Herridge MS, Tansey CM, Matte A, Tomlinson G, Diaz-Granados N, Cooper A, Guest CB, Mazer CD, Mehta S, Stewart TE, et al. Functional disability 5 years after acute respiratory distress syndrome. N. Engl. J. Med. 2011;364:1293–1304. doi: 10.1056/NEJMoa1011802. [DOI] [PubMed] [Google Scholar]
- 5.Orme J, Jr, Romney JS, Hopkins RO, Pope D, Chan KJ, Thomsen G, Crapo RO, Weaver LK. Pulmonary function and health-related quality of life in survivors of acute respiratory distress syndrome. Am. J. Respir. Crit Care Med. 2003;167:690–694. doi: 10.1164/rccm.200206-542OC. [DOI] [PubMed] [Google Scholar]
- 6.Heyland DK, Groll D, Caeser M. Survivors of acute respiratory distress syndrome: relationship between pulmonary dysfunction and long-term health-related quality of life. Crit Care Med. 2005;33:1549–1556. doi: 10.1097/01.ccm.0000168609.98847.50. [DOI] [PubMed] [Google Scholar]
- 7.Masclans JR, Roca O, Munoz X, Pallisa E, Torres F, Rello J, Morell F. Quality of life, pulmonary function, and tomographic scan abnormalities after ARDS. Chest. 2011;139:1340–1346. doi: 10.1378/chest.10-2438. [DOI] [PubMed] [Google Scholar]
- 8.Paine R, III, Standiford TJ, Dechert RE, Moss M, Martin GS, Rosenberg AL, Thannickal VJ, Burnham EL, Brown MB, Hyzy RC. A randomized trial of recombinant human granulocyte-macrophage colony-stimulating factor for patients with acute lung injury. Crit Care Med. 2012;40:90–97. doi: 10.1097/CCM.0b013e31822d7bf0. [DOI] [PMC free article] [PubMed] [Google Scholar]
- 9.Bernard GR, Artigas A, Brigham KL, Carlet J, Falke K, Hudson L, Lamy M, LeGall JR, Morris A, Spragg R. The American-European Consensus Conference on ARDS. Definitions, mechanisms, relevant outcomes, and clinical trial coordination. Am. J. Respir. Crit Care Med. 1994;149:818–824. doi: 10.1164/ajrccm.149.3.7509706. [DOI] [PubMed] [Google Scholar]
- 10.Ventilation with lower tidal volumes as compared with traditional tidal volumes for acute lung injury and the acute respiratory distress syndrome. The Acute Respiratory Distress Syndrome Network. N. Engl. J. Med. 2000;342:1301–1308. doi: 10.1056/NEJM200005043421801. [DOI] [PubMed] [Google Scholar]
- 11.Crotti S, Mascheroni D, Caironi P, Pelosi P, Ronzoni G, Mondino M, Marini JJ, Gattinoni L. Recruitment and derecruitment during acute respiratory failure: a clinical study. Am. J. Respir. Crit Care Med. 2001;164:131–140. doi: 10.1164/ajrccm.164.1.2007011. [DOI] [PubMed] [Google Scholar]
- 12.Desai SR, Wells AU, Rubens MB, Evans TW, Hansell DM. Acute respiratory distress syndrome: CT abnormalities at long-term follow-up. Radiology. 1999;210:29–35. doi: 10.1148/radiology.210.1.r99ja2629. [DOI] [PubMed] [Google Scholar]
- 13.Ichikado K, Suga M, Muranaka H, Gushima Y, Miyakawa H, Tsubamoto M, Johkoh T, Hirata N, Yoshinaga T, Kinoshita Y, et al. Prediction of prognosis for acute respiratory distress syndrome with thin-section CT: validation in 44 cases. Radiology. 2006;238:321–329. doi: 10.1148/radiol.2373041515. [DOI] [PubMed] [Google Scholar]
- 14.Kleyweg RP, van der Meche FG, Schmitz PI. Interobserver agreement in the assessment of muscle strength and functional abilities in Guillain-Barre syndrome. Muscle Nerve. 1991;14:1103–1109. doi: 10.1002/mus.880141111. [DOI] [PubMed] [Google Scholar]
- 15.DeJonghe JB, Sharshar T, Lefaucheur JP, Authier FJ, Durand-Zaleski I, Boussarsar M, Cerf C, Renaud E, Mesrati F, Carlet J, et al. Paresis acquired in the intensive care unit: a prospective multicenter study. JAMA. 2002;288:2859–2867. doi: 10.1001/jama.288.22.2859. [DOI] [PubMed] [Google Scholar]
- 16.Ali NA, O'Brien JM, Jr, Hoffmann SP, Phillips G, Garland A, Finley JC, Almoosa K, Hejal R, Wolf KM, Lemeshow S, et al. Acquired weakness, handgrip strength, and mortality in critically ill patients. Am. J. Respir. Crit Care Med. 2008;178:261–268. doi: 10.1164/rccm.200712-1829OC. [DOI] [PubMed] [Google Scholar]
- 17.Ware JE, Jr, Sherbourne CD. The MOS 36-item short-form health survey (SF-36). I. Conceptual framework and item selection. Med. Care. 1992;30:473–483. [PubMed] [Google Scholar]
- 18.Jones PW, Forde Y. St. George's Respiratory Questionnaire Manual. 2008. pp. 1–16. [Google Scholar]
- 19.Davidson TA, Caldwell ES, Curtis JR, Hudson LD, Steinberg KP. Reduced quality of life in survivors of acute respiratory distress syndrome compared with critically ill control patients. JAMA. 1999;281:354–360. doi: 10.1001/jama.281.4.354. [DOI] [PubMed] [Google Scholar]
- 20.Pellegrino R, Viegi G, Brusasco V, Crapo RO, Burgos F, Casaburi R, Coates A, van der Grinten CP, Gustafsson P, Hankinson J, et al. Interpretative strategies for lung function tests. Eur. Respir. J. 2005;26:948–968. doi: 10.1183/09031936.05.00035205. [DOI] [PubMed] [Google Scholar]
- 21.Raghu G, Collard HR, Egan JJ, Martinez FJ, Behr J, Brown KK, Colby TV, Cordier JF, Flaherty KR, Lasky JA, et al. An official ATS/ERS/JRS/ALAT statement: idiopathic pulmonary fibrosis: evidence-based guidelines for diagnosis and management. Am. J. Respir. Crit Care Med. 2011;183:788–824. doi: 10.1164/rccm.2009-040GL. [DOI] [PMC free article] [PubMed] [Google Scholar]
- 22.Nobauer-Huhmann IM, Eibenberger K, Schaefer-Prokop C, Steltzer H, Schlick W, Strasser K, Fridrich P, Herold CJ. Changes in lung parenchyma after acute respiratory distress syndrome (ARDS): assessment with high-resolution computed tomography. Eur. Radiol. 2001;11:2436–2443. doi: 10.1007/s003300101103. [DOI] [PubMed] [Google Scholar]
- 23.Chesnutt AN, Matthay MA, Tibayan FA, Clark JG. Early detection of type III procollagen peptide in acute lung injury. Pathogenetic and prognostic significance. Am. J. Respir. Crit Care Med. 1997;156:840–845. doi: 10.1164/ajrccm.156.3.9701124. [DOI] [PubMed] [Google Scholar]
- 24.Clark JG, Milberg JA, Steinberg KP, Hudson LD. Type III procollagen peptide in the adult respiratory distress syndrome. Association of increased peptide levels in bronchoalveolar lavage fluid with increased risk for death. Ann. Intern. Med. 1995;122:17–23. doi: 10.7326/0003-4819-122-1-199501010-00003. [DOI] [PubMed] [Google Scholar]
- 25.Marshall RP, Bellingan G, Webb S, Puddicombe A, Goldsack N, McAnulty RJ, Laurent GJ. Fibroproliferation occurs early in the acute respiratory distress syndrome and impacts on outcome. Am. J. Respir. Crit Care Med. 2000;162:1783–1788. doi: 10.1164/ajrccm.162.5.2001061. [DOI] [PubMed] [Google Scholar]
- 26.Chesnutt AN, Kheradmand F, Folkesson HG, Alberts M, Matthay MA. Soluble transforming growth factor-alpha is present in the pulmonary edema fluid of patients with acute lung injury. Chest. 1997;111:652–656. doi: 10.1378/chest.111.3.652. [DOI] [PubMed] [Google Scholar]
- 27.Martin C, Papazian L, Payan MJ, Saux P, Gouin F. Pulmonary fibrosis correlates with outcome in adult respiratory distress syndrome. A study in mechanically ventilated patients. Chest. 1995;107:196–200. doi: 10.1378/chest.107.1.196. [DOI] [PubMed] [Google Scholar]
- 28.Budinger GR, Chandel NS, Donnelly HK, Eisenbart J, Oberoi M, Jain M. Active transforming growth factor-beta1 activates the procollagen I promoter in patients with acute lung injury. Intensive Care Med. 2005;31:121–128. doi: 10.1007/s00134-004-2503-2. [DOI] [PMC free article] [PubMed] [Google Scholar]
- 29.Horowitz JC, Cui Z, Moore TA, Meier TR, Reddy RC, Toews GB, Standiford TJ, Thannickal VJ. Constitutive activation of prosurvival signaling in alveolar mesenchymal cells isolated from patients with nonresolving acute respiratory distress syndrome. Am. J. Physiol Lung Cell Mol. Physiol. 2006;290:L415–L425. doi: 10.1152/ajplung.00276.2005. [DOI] [PMC free article] [PubMed] [Google Scholar]
- 30.Synenki L, Chandel NS, Budinger GR, Donnelly HK, Topin J, Eisenbart J, Jovanovic B, and Jain M. Bronchoalveolar lavage fluid from patients with acute lung injury/acute respiratory distress syndrome induces myofibroblast differentiation. Crit Care Med. 2007;35:842–848. doi: 10.1097/01.CCM.0000257254.87984.69. [DOI] [PubMed] [Google Scholar]
- 31.Quesnel C, Nardelli L, Piednoir P, Lecon V, Marchal-Somme J, Lasocki S, Bouadma L, Philip I, Soler P, Crestani B, et al. Alveolar fibroblasts in acute lung injury: biological behaviour and clinical relevance. Eur. Respir. J. 2010;35:1312–1321. doi: 10.1183/09031936.00074709. [DOI] [PubMed] [Google Scholar]
- 32.Fan E, Ciesla ND, Truong AD, Bhoopathi V, Zeger SL, Needham DM. Interrater reliability of manual muscle strength testing in ICU survivors and simulated patients. Int. Care Med. 2010;36:1038–1043. doi: 10.1007/s00134-010-1796-6. [DOI] [PMC free article] [PubMed] [Google Scholar]
- 33.Hough CL, Lieu BK, Caldwell ES. Manual muscle strength testing of critically ill patients: feasibility and interobserver agreement. Crit Care. 2011;15(1):R43. doi: 10.1186/cc10005. [DOI] [PMC free article] [PubMed] [Google Scholar]
- 34.Khan J, Harrison TB, Rich MM, Moss M. Early development of critical illness myopathy and neuropathy in patients with severe sepsis. Neurology. 2006;67(8):1421–1425. doi: 10.1212/01.wnl.0000239826.63523.8e. [DOI] [PubMed] [Google Scholar]
Associated Data
This section collects any data citations, data availability statements, or supplementary materials included in this article.
Supplementary Materials
Supplemental Digital Content-1: 180 day percent predicted total lung capacity versus 180 day chest high resolution CT scores. An inverse relationship between % predicted total lung capacity (TLC) and chest high resolution CT (HRCT) scores evaluated at 180 days after ALI diagnosis was observed for all patterns examined, including, (1a) reticulation, (1b) ground glass opacification (GGO), (1c) intense parenchymal opacifiation (IPO), and (1d) overall HRCT score. The overall HRCT score was calculated by totaling together scores for reticulation, GGO, and IPO. 34 ALI survivors underwent both HRCT of the chest, as well as plethysmography to measure TLC at this 180 day time point.
Supplemental Digital Content-2: Pulmonary function testing compared with health related quality of life at 180 days.
Supplemental Digital Content-3: Relationship between HRCT score at 14 days, inpatient clinical variables, and 180 HRQoL as assessed by either the SF-36, or SGRQ.