

Abstract
Understanding the processes of DNA replication, chromatin assembly and maturation, and the replication stress response requires the ability to monitor protein dynamics at active and damaged replication forks. Detecting protein accumulation at replication forks or damaged sites has primarily relied on immunofluorescent imaging, which is limited in resolution and antibody sensitivity. Here, we describe a procedure to isolate proteins on nascent DNA (iPOND) that permits a high-resolution spatiotemporal analysis of proteins at replication forks or on chromatin following DNA replication in cultured cells. iPOND relies on labeling of nascent DNA with the nucleoside analog 5-ethynyl-2′-deoxyuridine (EdU). Biotin-conjugation to EdU-labeled DNA using click chemistry facilitates a single-step streptavidin purification of proteins bound to the nascent DNA. iPOND permits an interrogation of any cellular process linked to DNA synthesis using a 3-4 day protocol.
Keywords: DNA replication, chromatin assembly, chromatin maturation, click chemistry, 5-ethynyl-2′-deoxyuridine (EdU), biotin azide, DNA damage, DNA repair, histone, epigenetics?
INTRODUCTION
During S-phase, DNA replication and chromatin assembly are coordinated at the replication fork to duplicate the genome and epigenome rapidly and accurately. DNA template damage and other forms of replication stress challenge genetic stability and activate a DNA damage response1. This signaling pathway protects and repairs damaged replication forks to promote successful completion of chromosome replication and prevent diseases such as cancer2.
Immunofluorescent imaging is a useful method to detect proteins in active replisomes or proteins recruited to damaged forks. However, immunofluorescent imaging suffers from low resolution, poor sensitivity, and a requirement for highly specific antibodies3. Other methods like chromatin immunoprecipitation have limited applicability to mammalian cell replication due to difficulties in obtaining synchronous cultures and the lack of highly efficient, sequence specified, origins of replication4. Purification of replisome protein complexes through protein-protein interactions is useful to identify potential components, but provides limited spatial information about protein localization.
To overcome these technical challenges, we developed iPOND (isolation of proteins on nascent DNA)5. In addition to monitoring replisome dynamics, iPOND provides a method to examine protein recruitment and modification at damaged replication forks, and to analyze chromatin deposition and maturation.
Overview of iPOND
The iPOND methodology enables purification of proteins bound directly or indirectly to the nascent DNA at replication forks. The method relies on labeling short fragments of nascent DNA with EdU, a nucleoside analog of thymidine6. EdU contains an alkyne functional group that permits copper-catalyzed cycloaddition (click chemistry)7 to a biotin azide to yield a stable covalent linkage (Fig. 1). This facilitates a single-step purification of DNA-protein complexes based on the high affinity biotin-streptavidin interaction.
Fig. 1. Click chemistry addition of biotin tags to nascent DNA.
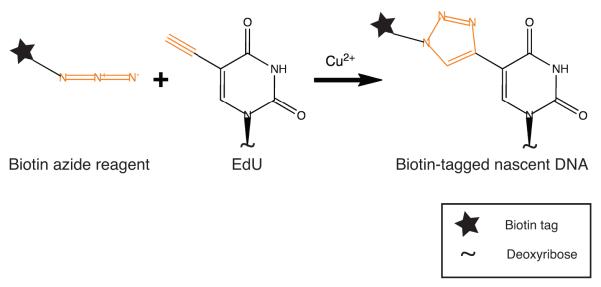
EdU incorporated into nascent DNA is covalently tagged with biotin in the copper-catalyzed click reaction. Orange color represents the functional groups involved in the click chemistry reaction.
The iPOND procedure (Fig. 2) begins by incubating cells with EdU for a short period of time (typically 2-15 minutes). The cells are then fixed with formaldehyde, which serves to both stop DNA replication and crosslink protein-DNA complexes. A click reaction in the presence of copper to conjugate biotin to EdU is completed in detergent permeabilized cells. Some DNA fragmentation occurs during this step due to copper-catalyzed hydrolysis of the DNA. Cells are then lysed in denaturing conditions and sonication completes the DNA fragmentation producing solubilized DNA-protein complexes. Streptavidin-coated beads purify the nascent, EdU-labeled DNA-protein complexes. Finally, the proteins are eluted from the complexes. Standard immunoblotting or mass spectrometry methodologies can be used to detect the purified proteins and post-translational modifications.
Fig. 2. Schematic overview of the iPOND procedure.

The iPOND procedure consists of pulsing cells with EdU to label nascent DNA in vivo, formaldehyde crosslinking protein-DNA complexes, covalently tagging EdU-labeled DNA with biotin using click chemistry, lysing and sonicating cells, purifying the solubilized protein-DNA complexes, and eluting bound proteins for analysis by SDS-PAGE and immunoblotting or MS. Numbering corresponds to the procedure step number
The spatial and temporal resolution achieved with iPOND depends on EdU incubation time, the rate of DNA synthesis, and chromatin fragment size. Experimentally, EdU incubation time and replication rate are the major determinants of iPOND resolution since the protocol consistently yields chromatin fragments of 100-300 base pairs. The shortest EdU incubation time we have used to purify replisome components is 2.5 minutes5. Since forks move between 750-2000 base pairs per minute8, as much as 5000 base pairs could contain EdU during a 2.5-minute incubation yielding a resolution of 5kb. This is likely a significant underestimation of the resolution since EdU must enter the cell and be phosphorylated prior to incorporation. Our analysis indicates that a 2.5 minute incubation with EdU is sufficient to capture replisome proteins and longer incubations with EdU are required to isolate newly deposited chromatin5.
Applications
Thus far, we have used iPOND in three major applications. First, iPOND is useful to identify proteins associated with active replisomes. This application requires combining iPOND within a pulse-chase experimental framework (Fig. 3A, Fig. 4). Cells are labeled with EdU for a short time (the pulse) then EdU is replaced with thymidine for increasing periods of time (the chase). Samples are harvested at the end of the pulse and chase periods. A true replisome protein should be detected only in the pulse sample and not the chase sample. In contrast, other chromatin bound proteins like histones may be detected in both samples.
Fig. 3. Schematic of experimental procedures used to identify replisome or DNA damage proteins and modifications at the replication fork.

A. To identify replisome proteins, a pulse-chase variation of the iPOND protocol employs a thymidine chase to move the nascent, EdU-labeled DNA segment away from the replication fork. The chase sample provides a control to distinguish replisome components from general chromatin binding factors. B. To study proteins and modifications associated with damaged replication forks, an agent that stalls replication forks such as hydroxyurea is added following the EdU labeling period.
Fig. 4. Example of results obtainable with iPOND.
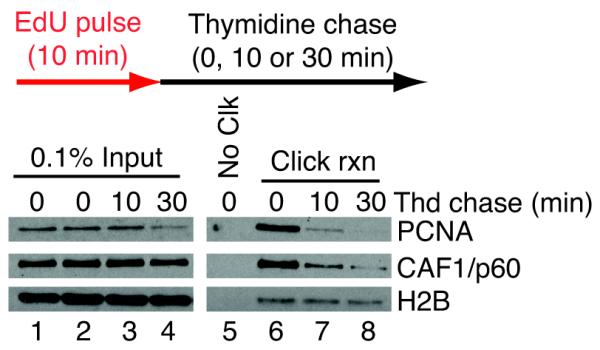
Cells were pulsed with EdU for 10 minutes and then incubated with thymidine for 0, 10, or 30 minutes as indicated.. iPOND was performed as described in the protocol. Eluted proteins (lanes 5-8) were analyzed by SDS-PAGE followed by immunoblotting for the replication proteins PCNA, chromatin assembly factor 1 (CAF-1/p60), and histone H2B. As expected, proteins are detectable in every sample of the input (lanes 1-4). In the absence of click chemistry (No Clk, lane 5, negative control), no proteins are isolated from nascent DNA. PCNA and CAF-1 are enriched specifically at the replication fork (Click rxn, lane 6), but not on nascent DNA that is thymidine chased away from the replication fork (Click rxn, lanes 7,8). In contrast, a chromatin bound protein such as H2B is detectable both at the replication fork (Click rxn, lane 6) and in thymidine chased samples (Click rxn, lanes 7,8).
The pulse-chase experimental design is also the method of choice for the second major iPOND application – monitoring changes in chromatin located at various distances from the replication fork. Chromatin reassembly after passage of the replication fork occurs as a function of time and hence distance from the elongating fork9. Using iPOND to purify histones on a segment of EdU-labeled DNA after various times of thymidine chase permits an analysis of how chromatin architecture is restored behind the elongating fork. For example, we used iPOND to document the timing of deacetylation of newly synthesized histone H4 after deposition5.
Finally, iPOND can be used to detect protein recruitment or post-translational modifications of proteins at damaged forks. The procedure in this case is to pulse for a short time with EdU, then to add a replication stress agent like hydroxyurea (HU) or camptothecin (Fig. 3B). Hydroxyurea is particularly useful since high concentrations largely stop fork movement facilitating an analysis of transiently or persistently stalled forks. Combining the DNA damaging protocol with the pulse-chase procedure also enables an examination of DNA damage-dependent events at different distances from the damaged fork. For example, we used this procedure to demonstrate spreading of H2AX phosphorylation from an HU-stalled fork5. Thus, the high spatial resolution of iPOND is derived from the capacity to measure the position of protein changes in relation to the replication fork. Theoretically, this system can also be used to monitor long-term changes in chromatin structure after DNA damage or replication stress by simply extending the time frame of the chase.
These three major applications are quite powerful especially when combined with genetic or small molecule-mediated inactivation of specific pathways that regulate DNA replication, chromatin deposition and maturation, and DNA repair. iPOND is compatible with all proliferating cell types. We have used it successfully in HEK293T, HCT116, NIH3T3, and mouse embryonic fibroblasts (unpublished observations, B.M.S. and D.C.). Thus, cell lines engineered to have mutations in specific pathways can be used directly with iPOND without any major modifications to the protocol. iPOND can also be extended for use beyond mammalian cell culture. Any cell type that can incorporate EdU during DNA synthesis (or be engineered to utilize EdU) can be used. In fact, we have used iPOND to purify DNA-protein complexes from the yeast S. cerevisiae, although significant optimization will be required to improve purification efficiency (unpublished observations, F.B.C. and D.C.).
In addition to these three documented applications, iPOND can be utilized to study other processes that involve DNA or even RNA synthesis. An example would be DNA repair synthesis outside of S-phase. Synchronized or terminally differentiated cell cultures could be exposed to DNA damaging agents in the presence of EdU. The late steps in repair of that damage or the re-establishment of chromatin following repair synthesis can be monitored with iPOND. Synchronized cell cultures could also be used to examine the differences in DNA replication, chromatin deposition, or DNA repair that occur in early vs. late S-phase cells. This approach was used by Kliszczak et al., in a recently published manuscript describing a similar methodology to iPOND10. Another application could be to monitor DNA synthesis outside of the nucleus such as in mitochondrial DNA if iPOND is combined with a purification step that isolates this organelle. iPOND could theoretically be adapted to analyze even proteins on nascent RNA, since click chemistry has been used to label newly synthesized RNA with the uridine analog 5-ethynyluridine (EU)11.
Finally, combining iPOND with quantitative mass spectrometry should be a powerful methodology for identifying new replisome and DNA damage response proteins, as well as monitoring the significant amount of post-translational modifications at damaged forks.
Comparison to other methods
Compared to conventional indirect immunofluorescence, iPOND has improved sensitivity of detection since even low abundance replisome proteins such as polymerases are isolated5. It also provides improved spatial and temporal resolution. An improved imaging technique permits single molecule detection of replisome proteins in bacteria12; however, unlike imaging, iPOND is compatible with unbiased approaches for protein identification such as mass spectrometry.
Chromatin immunoprecipitation (ChIP) is a powerful substitute for several iPOND capabilities in organisms like S. cerevisiae that have highly efficient, sequence defined origins of replication and cell cycle synchronization is easily achieved. ChIP has the advantage of being more sensitive than iPOND since it detects DNA sequences after PCR amplification. However, ChIP requires highly specific, often unavailable antibodies and is not compatible with unbiased approaches like mass spectrometry. Also, while ChIP has been used in mammalian systems to examine protein recruitment to origins of replication13, it is generally not useful to study the dynamic processes associated with fork elongation and chromatin maturation. Finally, adapting ChIP to studying damaged replication forks in mammalian cell culture awaits the development of ways to engineer site-specific DNA lesions that stall forks with high efficiency as has been done using Xenopus egg extracts to study inter-strand crosslink repair14,15.
The most comparable technology to iPOND is the immunoprecipitation of nascent DNA-protein complexes with antibodies to halogenated nucleoside analogs, which was utilized to examine recruitment of RAD51 to sites of replication fork stalling16. However, the relatively low affinity of this antibody-epitope interaction and the requirement for DNA denaturation for antibody access necessitated a very long CldU labeling period (40 minutes) providing little advantage over biochemical fractionation of chromatin. In principle, biotin-dUTP could be used directly to label the nascent DNA avoiding the need to perform the click chemistry reaction. However, biotin-dUTP is not cell permeable necessitating some cellular manipulation to introduce it into cells and the large biotin tag may interfere with DNA structure and protein associations with DNA.
Experimental design options
Several parameters can be varied within the iPOND protocol depending on the specific experimental purpose. As outlined above, the EdU pulse and chase combinations yield different types of information. In addition, it may be useful to omit the formaldehyde crosslinking step. In particular, formaldehyde crosslinking may complicate analysis of proteins by mass spectrometry if the crosslinks are not fully reversed. Chromatin can be captured with iPOND without crosslinking provided that Igepal or another non-denaturing detergent is used in the lysis step and the salt concentration in the wash step is reduced (Box 1).
BOX 1. Native iPOND.
iPOND performed without formaldehyde crosslinking (Native iPOND) may simplify mass spectrometry analyses of purified histones.
Culture 5 × 10⁷ cells in one 150mm dish per sample.
Label samples with 10μM EdU for 60 mins.
Harvest cells by scraping on ice.
Collect pellets by centrifuging at 100g for 5 mins, 4°C.
Discard supernatant and wash with 5ml ice cold PBS. Collect by centrifuging at 100g for 5 mins, 4°C.
Discard supernatant and lyse by resuspension in ice cold Cell Lysis Buffer with Igepal CA-630 at 1×10⁷ cells/ml.
Vortex 5× for 5 secs with 5 secs between pulses.
Collect nuclei by centrifugation at 100g for 5 mins, 4°C.
Discard supernatant and wash 2× in 5ml Cell Lysis Buffer without Igepal CA-630.
Collect by centrifugation at 100g for 5 mins, 4°C.
Discard supernatant and resuspend in ice cold Nuclei Buffer at 2.5 ×10⁷ cells/ml.
Set up click reactions using formula in Table 1.
Incubate for 1 h on shaker at 4°C and protect from light.
Collect nuclei by centrifugation at 100g for 5 mins, 4°C.
Discard supernatant and resuspend in ice cold Nuclei Buffer at 2 × 10⁷ cells/ml.
Add EDTA to a final concentration of 1mM and CaCl2 to 2mM.
Warm to 37°C in water bath and add Micrococcal Nuclease to 20 Kurntz units per 1 × 10⁷ cells.
Incubate at 37°C for 3.5 mins.
Add EDTA to a final concentration of 2mM to quench reactions. Collect nuclei by centrifugation at 100g for 5 mins, 4°C.
Extract chromatin by discarding supernatant and resuspending nuclei in ice cold Extraction Buffer at 5 × 10⁷ cells per 3ml. Rotate for 2 h to overnight at 4°C, protected from light.
Centrifuge at 16,100g for 5 mins, 4°C to remove all insoluble material. Move supernatant to a fresh tube and discard pellet.
Remove 0.5% total volume and save as ‘input’ sample. To remaining lysate, add 20μl of streptavidin agarose beads per 1 × 10⁷ cells. Rotate 1.5 h to overnight at 4°C, protected from light.
Collect beads by centrifugation at 1,800g for 1 min. Let beads stand for another minute to settle completely. Aspirate supernatant and discard.
Move the beads to a 1.5ml centrifuge tube.
Wash beads 2× with 1ml of Extraction Buffer for 5 mins, 4°C.
Add an equal volume of 2×SB and heat to 95°C for 10 mins.
Separate recovered proteins using SDS-PAGE and analyze by immunoblotting or mass spectrometry.
A second experimental design option is to change the elution methodology. For most applications we found that boiling in SDS-sample buffer is sufficient to reverse crosslinks and solubilize proteins after purification (Fig. 2, Elution Option A). However, this method also releases any proteins that bind to the bead matrix non-specifically and does not release the DNA from the beads. The use of a cleavable biotin-azide in the click reaction facilitates elution in milder conditions to improve specificity and recovery of the DNA (Fig. 2, Elution Option B). Several cleavable biotin-azides have been described17. We successfully use a UV-photocleavable biotin-azide synthesized by Ned Porter’s group at Vanderbilt18. This elution option may also be useful in experimental systems where biotinylation of endogenous proteins is a concern.
Controls
Control samples are essential to interpret the results. Most importantly, a control for the specificity of the purification is needed. This control is analogous to the pre-immune control for co-immunoprecipitation experiments. We typically use a sample that omits the biotin-azide during the click reaction (Steps 29 and 30). Alternatively, a sample in which the cells were not incubated with EdU can be used as the control. No DNA-protein complexes should be purified in this control sample. If any protein is detected, it likely comes from non-specific interactions with the streptavidin matrix or precipitation of protein during the manipulations.
A second control is needed to ensure that a purified protein is actually enriched at replication forks, as opposed to simply being an abundant chromatin-associated protein. This control is a sample in which the EdU is removed and cells are incubated with thymidine for several minutes prior to harvesting (a chase sample). Proteins that travel with the replication fork will only be detected before this thymidine chase. If a protein is detected in the chase sample, this indicates it is a chromatin-bound protein but not specifically part of the replisome.
Finally, control immunoblots to examine known replisome components, such as proliferating cell nuclear antigen (PCNA), should be performed within each experiment to ensure that the procedure worked as expected.
iPOND limitations and other considerations
Currently, the major limitation of iPOND is the large amount of starting material needed. Each sample requires approximately 1 × 10⁸ cells for efficient iPOND capture of replisome proteins using a 10 minute EdU incubation. The large number of cells needed for the procedure is dictated by the sensitivity of the immunoblotting and mass spectrometry detection methods. This cell number is based on unsynchronized cultures of 293T cells in which about 50% of the cells are in S-phase at the time of the experiment. Synchronizing cells such that 100% are in S-phase would reduce the cells needed while use of cell types with fewer replicating cells would increase it. Although these cell numbers are large, they are obtainable using standard cell culture methods.
iPOND is an ensemble methodology, meaning that the data comes from hundreds of replication forks in millions of cells. It provides a picture of an average replication fork and cannot distinguish the significant heterogeneity between cells in the population or between forks within different genomic regions. Thus, identification of two proteins using iPOND does not mean those two proteins are necessarily recruited to the same nascent DNA segment. Furthermore, distinguishing the relative distribution of proteins within the chromosomal space at the replication fork is currently not possible using iPOND. Such high-resolution mapping has been achieved with in vitro replication systems using T4 DNA polymerase and primer template DNA containing a position specific cross-linkable aryl azide19. This elegant study provided topographical information about the location of binding of accessory proteins respective to polymerase interaction with and movement along the DNA template. Lastly, iPOND resolution may be improved in a system where EdU exists as the sole nucleoside to pair with adenosine. This could be achieved in a cellular system such as Xenopus where dNTPs are added in a controlled manner for incorporation into nascent DNA.
MATERIALS
REAGENTS
EdU (5-ethynyl-2′-deoxyuridine) (Invitrogen, cat. no. E10187)
Thymidine (Sigma, cat. no. T1895)
37% (w/v) formaldehyde solution (Sigma, cat. no. F1635) CAUTION Very toxic if inhaled, ingested or absorbed through skin.
10× PBS pH 7.2 (Gibco, cat. no. 70013)
Glycine (Fisher, cat. no. BP 381)
Cell lifter (Corning, cat. no. 3008)
Triton X-100 (Sigma, cat. no. T8787) CAUTION Hazardous in case of eye contact, ingestion or inhalation.
BSA (Sigma, cat. no. A7030)
Dimethyl sulfoxide (DMSO) (Fisher, cat. no. A4034) CAUTION Readily permeates skin. Combustible liquid and vapor. Hygroscopic.
Copper (II) sulfate pentahydrate (CuSO4•5H2O) (Fisher, cat. no. C489) CAUTION Harmful.
(+) Sodium L-ascorbate (Sigma, cat. no. A4034)
Biotin azide (Invitrogen, cat. no. B10184)
SDS (Sigma, cat. no. L4390) CAUTION Toxic in contact with skin, harmful if swallowed, causes skin, eye, and respiratory irritation.
Tris, pH 8.0 and pH 6.7
Sodium chloride (NaCl)
RNase A solution (Sigma, cat. no. R6148)
Proteinase K (Sigma, cat. no. P5568)
Glycerol
Bromophenol blue
EDTA
Agarose (Bio-Rad Laboratories, cat. no. 161-3101)
Dithioerythritol (DTT) (Sigma, cat. no. D-8255)
Aprotinin (Sigma, cat. no. A6279)
Leupeptin (Sigma, cat. no. L2884)
Streptavidin agarose (Novagen, cat. no. 69203-3) (CRITICAL, different bead surfaces and binding capacities will alter iPOND efficiency)
Trichloroacetic acid (TCA) CAUTION Corrosive.
Acetone CAUTION Highly flammable.
Western Lightning Plus enhanced chemilluminescence substrate (ECL) (Perkin Elmer, cat. no. NEL103001EA)
EQUIPMENT
90 micron nylon mesh (Small Parts Inc., cat. no. B000FN0PGQ)
Glass vial screw thread with cap attached for UV photocleavage (Fisher, cat. no. 03-338AA) (CRITICAL, other vial surfaces may perturb penetration of UV light necessitating different elution times or conditions)
Magnetic micro stirring bar 2 diameter × 7mm length (Fisher, cat. no. 1451363)
Microtip sonicator for cell lysis and chromatin fragmentation (Misonix 4000 or Fisher Scientific Sonic Dismembrator Model 500)
Rotating platform for biotin captures
UV lamp (UVP, cat. no. UVLMS-38 EL Series 3UV Lamp, 365/302/254nm UV 8-Watt)
Magnetic stir plate
Microcentrifuge for 1.5ml Eppendorf tubes
Table-top centrifuge for 15ml and 50ml conical tubes
Cell culture incubator
Biological safety cabinet
REAGENT SETUP
EdU (5-ethynyl-2′-deoxyuridine) Dissolve EdU in DMSO for a final concentration of 10mM. Protect from light. Store in aliquots at −20°C for up to 1 year. Before use, thaw at 37°C. To EdU label cells, pipet 1:1,000 of EdU directly into media for a final concentration of 10μM.
Thymidine Dissolve in water at a final concentration of 10mM. Store in aliquots at −20°C for up to 1 year. Before use, thaw. Use at final concentration of 10μM.
1× PBS Make 1× PBS from 10× PBS stock by diluting 1:10 with water and store at RT for up to a year.
1% formaldehyde/PBS Dilute 37% formaldehyde 1:37 with PBS. Prepare fresh and keep at room temperature (25°C, RT) until cell fixation (Step 12).
1.25M Glycine Prepare 1.25M glycine stock in water and store at RT for up to 1 year. Use at 1:10 dilution for final concentration of 0.125M glycine.
Permeabilization buffer Make stock 20% Triton X-100 in water and keep at RT. Dilute to 0.25% Triton X-100 in PBS. Store at 4°C for several months.
0.5% BSA in PBS wash buffer Prepare 0.5% BSA in PBS (w/v) and filter sterilize. Store at 4°C for a couple of weeks.
Click reaction stock solutions
1mM biotin-azide Dissolve biotin-azide in DMSO to a final concentration of 1mM. Aliquot and store at −20°C for up to a year.
100mM CuSO4 Prepare stock 100mM CuSO4 in H2O and store at RT for several months.
Sodium L-ascorbate Freshly prepare 20mg/ml of (+) sodium L-ascorbate (reducing agent) in H2O, limit exposure to air, and store on ice until needed.
Click reaction mixes To prepare click reaction cocktails, please see Table 1 for details. Cocktails are prepared freshly for each experiment prior to the click reaction (Step 28).
Table 1.
Click reaction cocktails for a sample with 1 × 10 cells. Adjust volumes proportionally for actual cell number.
| Reagent | [stock] | [final] | Control reaction volume (ml) |
Experimental reaction volume (ml) |
|---|---|---|---|---|
| 1×PBS | 4.35 | 4.35 | ||
| DMSO | 0.05 | |||
| Biotin-azide | 1mM | 10μM | 0.05 | |
| Sodium ascorbate | 100mM | 10mM | 0.5 | 0.5 |
| CuSO4 | 100mM | 2mM | 0.1 | 0.1 |
| Total Volume | 5.0 | 5.0 |
Lysis buffer Prepare 1% SDS in 50mM Tris, pH 8.0. Store at RT for several months. Prior to use, add protease inhibitors aprotinin and leupeptin to a final concentration of 1μg/ml.
Salt wash Prepare 5M NaCl in water. Dilute to 1M NaCl with water prior to use. Store at RT for 1 year.
2× SDS Laemmli sample buffer (2×SB) Mix 0.4 g SDS, 2 ml 100% Glycerol, 1.25 ml 1M Tris pH 6.8, and 0.01g Bromophenol blue in 8ml H2O. Store at −20°C for up to 1 year. Prior to use, add 1M DTT to a final concentration of 0.2M.
Crosslink reversal solution Prepare freshly. Mix 2μl of 0.5M EDTA, 4μl of 1M Tris, pH 6.7, and 1μl of Proteinase K. Prepare sufficient crosslink reversal solution mix to add 7μl to each sample in step 8 of Box 2.
Cell Lysis Buffer (Prepared freshly) 10mM Tris, pH 8.0, 2mM MgCl2, 1% Igepal CA-630. Prior to use, add protease inhibitors aprotinin and leupeptin to a final concentration of 1μg/ml.
Nuclei Buffer (Prepared freshly) 15mM Tris, pH 8.0, 0.125M sucrose, 15mM NaCl, 40mM KCl, 0.5mM spermidine, and 0.15M spermine.
Extraction Buffer (Prepared freshly) 1× PBS with 350mM NaCl, 2mM EDTA, and 0.1% Triton X-100.
PROCEDURE
Cell culture preparation – Timing 1-7 d
1| Calculate the number of dishes of cells needed for the experiment. Each sample requires at least 1.0 × 10⁸ cells at the time of the EdU pulse. We use three, 150mm dishes of HEK293T cells per sample typically. The number of cells may need to be increased depending on the application and cell type.
2| Expand cell cultures one day prior to EdU incubation (Step 3) to ensure the cells are growing optimally. Include one extra dish of cells for counting the cell number in Step 3. CRITICAL STEP For HEK293T cells, the experiment works best when cell confluence is between 4-6 × 10⁷ cells/dish on the day of the EdU pulse. Cells must be in log phase of growth and cannot be overgrown. Monitor proper incubator temperature and CO2 content. EdU incorporation is not maximal unless these critical parameters are met. If performing chases, equilibrate media to 37°C and the proper CO2 content overnight.
EdU labeling of nascent DNA – Timing 10 min-8 h
3| Determine the cell number in the extra dish of cells from Step 2. This cell number will be used to calculate the amount of the reagents used for each sample in Step 29.
4| Plan out times to pulse, chase, fix, quench, collect and wash samples. CRITICAL STEP Stagger samples to ensure that each sample is treated equally throughout the processing steps.
5| To pulse cells with EdU, remove dishes from incubator and place in biological safety cabinet.
6| Add 23μl of the 10mM EdU stock into 23ml of cell culture media in each dish to achieve a final EdU concentration of 10μM. Return to incubator for desired pulse time (e.g. 10 mins).
7| If not performing thymidine chases or drug treatments, skip to Step 11.
8| To perform thymidine chase or addition of drug, remove plates from incubator and decant media.
9| Carefully wash cells with 5ml of chase media and decant. The chase media should have been pre-equilibrated to 37°C and the proper CO2 content.
10| Add 20ml of chase media containing 10μM thymidine or desired concentration of DNA damaging drug. Return to incubator for desired length of time.
CRITICAL STEP It is important to perform Steps 5-10 as fast as possible to prevent pH and temperature changes in the media that can affect replication rates.
Formaldehyde crosslink and collect cells – Timing 1 h
11| After EdU pulse and/or chase, decant media.
12| Immediately fix cells on dish by adding 10ml of 1% formaldehyde in PBS and incubate for 20 mins at RT.
13| Quench cross-linking by adding 1ml of 1.25M glycine.
14| Collect sample by scraping with cell lifter and transfer to 50ml conical tube. Note the volume. This is same volume to be used for PBS washes in Step 17.
15| Centrifuge 5 mins at 900g, 4°C.
16| Decant supernatant.
17| Wash pellets 3× with 1× PBS and centrifuge 5 mins at 900g, 4°C. PBS wash volume is same as fixation volume noted in Step 14. Vortex to resuspend pellets in PBS.
18| After last wash, decant PBS.
PAUSE POINT—The samples can be flash frozen and stored at −80°C for several weeks.
Cell permeabilization – Timing 1 h
19| Resuspend cells in permeabilization buffer at a concentration of 1 × 10⁷ cells/ml.
20| Incubate cells at RT 30 mins. During incubation, thaw and prepare reagents necessary for click reaction cocktail, see Steps 28 and 29.
21| Spin down 5 mins at 900g, 4°C.
22| Carefully decant supernatant.
23| Wash cells 1× with cold 0.5% BSA in PBS using same volume as used for permeabilization.
CRITICAL STEP BSA prevents cell pellet from detaching from wall of 50ml conical. Loose pellet will lead to loss of cells in this step.
24| Centrifuge 5 mins at 900g, 4°C and decant supernatant.
25| Wash cells 1× with PBS using same volume as used for permeabilization.
26| Spin down 5 mins at 900g, 4°C.
27| Decant supernatant and place pellets on ice while finishing click reaction cocktail preparation.
Click reaction – Timing 2 h
28| Thaw an aliquot of stock biotin-azide by placing on 37°C heat block. CRITICAL STEP If using photocleavable biotin-azide, keep reagent protected from light and prepare click reaction cocktail in the dark.
29| To calculate click reaction cocktail volumes, Table 1 lists the amounts of each reagent needed per reaction with an example sample size of 1 × 10⁸ cells. The actual volumes should be adjusted based on the cell number measured per sample (Step 3). Note that two click reaction cocktails will need preparation: one for the control, which contains DMSO, and one for the experimental samples, which contains the biotin-azide.
30| Combine click reaction cocktail reagents on ice in the order listed in Table 1.
31| Resuspend cell pellets from Step 27 in click reaction cocktail from Step 30 by vortexing.
32| Rotate reactions at RT for 1-2 h.
33| Centrifuge samples 5 mins at 900g, 4°C and decant supernatant.
34| Wash cells 1× with cold 0.5% BSA in PBS using same volume as used in click reaction for one sample.
35| Centrifuge 5 mins at 900g, 4°C and decant supernatant.
36| Wash cells 1× with PBS using same volume as used in click reaction for one sample.
37| Decant PBS and invert tubes on paper towel to remove all PBS.
PAUSE POINT—The samples can flash frozen and stored at −80°C for a few days.
Cell lysis and sonication – Timing 1 h
38| Prepare lysis buffer by adding aprotinin and leupeptin before use (see Reagent Setup) and place on ice.
39| Resuspend samples from Step 37 at a concentration of 1.5 × 10⁷ cells per 100μl of lysis buffer and transfer to 1.5ml centrifuge tubes on ice. To examine DNA fragment size at this step, see Box 2.
40| Sonicate cells using microtip sonicator and the following settings: Pulse: 20 seconds constant pulse, 40 seconds pause; Power: 13-16 Watts; Repeat pulse 1× for every 200μl of cell lysate; Total pulse time: 4-5 mins per sample CRITICAL STEP Lysate should appear clear/opaque after sonication and not cloudy. Cloudiness is an indicator of improper ratio of SDS to protein in lysate or insufficient sonication. During sonication, keep samples on ice slurry to prevent overheating.
41| Centrifuge samples for 10 mins at 16,100g, RT in table-top centrifuge.
CRITICAL STEP Lysate should appear clear after centrifugation. The presence of white precipitate or a white film on top of the lysate is indicative of insufficient clearing of the lysate.
42| Filter supernatant through a 90 micron nylon mesh into new tube. Place on ice.
43| Note the lysate volume (LV).
44| To examine DNA fragment size at this step, see Box 2 for crosslink reversal and DNA analysis.
45| Dilute lysate 1:1 (v/v) with cold PBS containing 1μg/ml of aprotinin and leupeptin. CRITICAL STEP Samples have been diluted to contain 0.5% SDS, 25mM Tris because less efficient biotin capture is observed in lysates containing 1% SDS.
46| Note the final capture volume (FCV).
47| Remove 15μl of lysate to save as the input sample (for use in Step 67) and place on ice. Immediately add 15μl of 2×SB to this input sample and store at −80°C. The remaining lysate is used for the streptavidin capture below.
Streptavidin capture of biotin-tagged nascent DNA and associated proteins – Timing 16-20 h
48| To capture biotin-tagged nascent DNA, each sample from Step 47 is incubated with streptavidin agarose beads at a concentration of 100μl bead slurry (50μl packed volume) per 1 × 10⁸ cells. Firstly, wash sufficient beads for all samples together by centrifuging bead slurry at 1,800g for 1min, RT.
49| Slowly and carefully aspirate storage buffer from beads.
50| Wash beads 2× with 1:1 (v/v) of Lysis Buffer containing aprotinin and leupeptin.
51| Carefully and slowly aspirate supernatant after each wash.
52| Wash beads 1× with 1:1 (v/v) of PBS containing aprotinin and leupeptin and carefully aspirate supernantant.
53| Resuspend beads 1:1 (v/v) in PBS containing protease inhibitors.
54| Add an equal volume of beads to each sample from Step 47 using pipet tip that is cut at the end.
55| Rotate biotin captures in cold room for 16-20 h (in dark if using photocleavable biotin azide).
56| Centrifuge the streptavidin-agarose beads with captured DNA and associated proteins for 3 mins at 1,800g, RT.
57| Very slowly and carefully aspirate most of supernatant.
CRITICAL STEP Supernatant should be light blue/clear with no precipitate.
58| Add 1ml of cold Lysis Buffer (no additives needed) to wash beads.
59| Rotate at RT for 5 mins.
60| Centrifuge for 1min at 1,800g, RT and carefully aspirate and discard supernatant.
61| Wash beads 1× with 1ml of 1M NaCl.
62| Rotate and pellet beads by repeating Steps 59-60.
63| Repeat Lysis Buffer washes (Steps 58-60) 2×.
Elution of proteins bound to nascent DNA – Timing 1-4 h
64| Protein elution can be performed using option A (boiling in 2×SB) or option B (UV photocleavage) depending on the amount of background observed in the negative control. Option B is best suited for proteins that exhibit significant background and require larger amounts of starting material for detection.
A—boiling in 2×SB
After the last wash in Step 63, aspirate all of the supernatant. Protein-DNA complexes isolated on the beads are the capture sample.
To elute proteins bound to nascent DNA, add 2×SB to packed beads from Step 64Ai 1:1 (v/v of packed beads; e.g.: 100μl 2× SB : 100μl packed beads).
Incubate capture sample from Step 64ii and input sample from Step 47 for 25 mins at 95°C.
Centrifuge boiled samples for 1min at 1,800g, RT. The supernatant is the 2× eluted capture and is ready to use in standard SDS-PAGE and immunoblotting procedures (see Step 65). Typically, both the input and iPOND purified capture samples should be examined concurrently.
B—UV photocleavage, TCA concentration, then boiling in 2×SB
After the last wash in Step 63, wash one additional time with 1× PBS containing leupeptin and aprotinin as in Steps 59-60.
Centrifuge for 1min at 1,800g, RT and carefully aspirate supernatant.
Add 1:1 (v/v) of 1× PBS containing protease inhibitors to packed beads and resuspend by pipetting.
Transfer resupended beads into a glass vial with a mini magnetic stir bar.
Place glass vial containing sample on magnetic stir plate and adjust to stir on lowest possible speed.
Position UV lamp as close to glass vial as possible. UV photoelute at 365nm for 1-2 h at RT.
Transfer bead slurry from glass vial into a 1.5ml centrifuge tube.
Centrifuge 1min at 1,800g, RT to pellet beads.
Carefully remove supernatant into fresh tube. This is the UV photo-eluted capture in PBS.
If concentration of sample is not desired, add 2×SB to the photo-eluted capture sample and boil at 95°C for 25 mins then proceed to analysis of proteins (Step 65). To concentrate sample, proceed with TCA precipitation protocol below.
Add ice-cold 100% TCA to the UV photo-eluted capture sample from Step 64Bix to achieve a final concentration of 15% TCA (v/v).
Incubate on ice for 30 mins.
Centrifuge at 16,100g for 30 mins in cold room.
Carefully remove the supernatant and save it.
Wash the pellet with 1ml ice-cold acetone.
Centrifuge 10 mins at 16,100g in cold room.
Carefully remove the supernatant and save it.
Air dry the pellet for 2-3 mins until acetone smell is undetectable. CRITICAL STEP If pellet is not visible at this step, spin down supernatant saved from Step 64Bxiv, then repeat Steps 64Bxv-xviii. If no pellet is observed, spin down supernatant previously saved from Step 64Bxvii and repeat Step 64Bxviii.
Add 30μl of 2×SB to the protein pellet to resuspend sample.
Incubate capture sample (from Step 64Bx if not TCA precipitated or Step 64Bxix if TCA precipitated) and input sample (from Step 47) for 25 mins at 95°C. The samples are ready for use in standard SDS-PAGE and immunoblotting procedures.
Analysis of eluted proteins using Western blotting– Timing 2-3 days
65| Prepare standard SDS-PAGE gel20. To examine purification of positive controls concurrently (a replication protein and a histone, eg. PCNA and H3, respectively), it is useful to prepare a 15% gel.
66| To detect purified proteins from input and capture samples (from Step 64Aiv or Step 64Bxx), load the equivalent of 3-6 × 10⁷ cells per well from the total protein capture (eg. 3-6 × 10⁷ of 1 × 10⁸). This means that each sample of 1 × 10⁸ cells yields sufficient sample for analysis of 2-3 immunoblots. For input samples, load the equivalent of 0.1% input (v/v) per well.
CRITICAL STEP Depending on antibody quality, different proteins may require more cells for detection than others. This will require empirical determination.
67| Electrophorese to resolve proteins based on molecular weight, transfer, and proceed with standard immunoblotting using desired antibodies according to supplier instructions or MS analysis21.
68| Proteins can be detected using chemiluminescence (e.g. Western Lightning Plus, Perkin Elmer) or quantitative immunoblotting using the Odyssey infrared imaging system (Li-Cor Biosciences).
TIMING
Steps 1-2, prepare cell cultures: 1-7 d
Steps 3-10, EdU labeling and thymidine/HU chase: variable, typically 10 min-8 h
Steps 11-18, Cell fixation/collection: 1 h
Steps 19-26, Cell permeabilization: 1 h
Steps 27-37, Click reaction: 1-2 h
Steps 38-47, Cell lysis and sonication 1 h
Steps 48-55, Biotin capture: 16-20 h
Steps 56-64, Washes and protein elution: variable, typically 1-4 h
Steps 65-68, Analysis of eluted proteins: variable, typically 2-3 days
? TROUBLESHOOTING
Troubleshooting advice can be found in Table 2.
Table 2.
Troubleshooting
| Step | Problem | Reason | Solution |
|---|---|---|---|
| 24 | Poor cell recovery | The cells were not pelleted sufficiently during the centrifugation. |
Increase the time or speed of the centrifugation. Be sure wash solution contains BSA. |
| 40 | Cell lysate is cloudy after sonication |
Sonication did not completely lyse cells or SDS-protein complexes precipitate from solution. |
Increase sonication times and be sure to avoid foaming of samples. Ensure the proper volume of lysis buffer was used in Step 39. |
| 56 | White precipitate layer observed above beads after centrifugation of biotin captures |
Lipids from cell membranes were not properly pelleted after sonication |
Make certain that lysate is clear after sonication and centrifugation. If white layer is observed on top of cell lysate, remove lysate, and clear again by centrifugation. |
| 64, Elution Option B, xviii |
No pellet is observed after air drying the TCA concentrated iPOND eluate |
Sample was lost during TCA precipitation |
Centrifuge the supernatant saved in Step xiv. Proceed with steps xv-xviii. If no pellet is observed, centrifuge supernatant previously saved in Step xvii. Continue with step xix. |
| 68 | High background signal in the control sample |
Protein binds to streptavidin beads non-specifically. |
Use elution option B, increase the number of washes in Steps 62-63. |
| 68 | Poor signal for control proteins like PCNA in the experimental sample |
Poor EdU incorporation. |
Increase the number of cells used in each sample and ensure the cells are growing well prior to experiment. |
| 68 | Poor detection of protein of interest in the input samples |
Poor antibody or formaldehyde crosslinking interferes with epitope detection. |
Optimize immunoblotting conditions or change antibody. Consider increasing the boiling time in Step 65Aiii or Step 65Bxx to completely reverse the formaldehyde crosslinks. |
ANTICIPATED RESULTS
Typically, 1 × 10⁸ cells are EdU labeled and processed using iPOND to yield sufficient material for immunoblotting using 2-3 antibodies. A protein is interpreted to be enriched at the replication fork if the following conditions are met: the protein is detected in a click reaction sample that has been EdU labeled (Fig. 4, lane 6); the protein is not detected in a sample that omits the click reaction (Fig. 4, lane 5); and the protein level is progressively decreased in the thymidine chase samples (Fig. 4, lanes 7-8). Chromatin-bound proteins will appear enriched specifically after the click reaction but will also be detected in the thymidine chase sample (Fig. 4, e.g. histone H2B). Replication stress proteins recruited to damaged forks will be detected only after a chase into a replication stress reagent (Fig. 3B).
BOX 2. CROSSLINK REVERSAL AND DNA ANALYSIS.
To examine DNA fragmentation size, crosslinks are reversed from lysates collected before and after DNA sonication, bound proteins are digested, DNA fragments are separated on an agarose gel and analyzed under UV light.
Prior to sonication (Step 39), remove 5μl of lysate and place on ice. This is the Pre-sonication sample.
After sonication and sample filtration (Step 44), remove 5μl of lysate and place on ice. This represents the Post-sonication sample.
To all samples, add 90μl of H2O and 4μl of 5M NaCl.
Incubate at 65°C for 4-16 h.
Add 1μl of RNase A (20mg/ml) to each sample.
Incubate in a 37°C water bath for 30 mins.
Prepare the crosslink-reversal solution (see Reagent Setup).
Add 7μl of crosslink-reversal solution to each sample.
Incubate at 45°C for 1-2 h.
During the incubation time, pour a 1.5% agarose/TAE gel (w/v) without ethidium bromide.
Add DNA loading dye to 20μl of sample and load on 1.5% agarose gel.
Electrophorese at 75V for 3 h in 1× TAE buffer to resolve DNA fragments.
Stain gel with ethidium bromide.
Visualize DNA fragments under UV light.
AKNOWLEDGEMENTS
This work was supported by NCI grants R01CA136933 and R01CA102729 to D.C. B.M.S. is supported by a Department of Defense Breast Cancer Research Program predoctoral fellowship (W81XWH-10-1-0226). We thank Drs. Ned Porter, Kerri Tallman, Daniel Liebler and Simona Codreanu who developed the UV-photocleavable biotin-azide and optimized methods of photo-elution. We also thank Drs. Larry Marnett, Kathy Gould, Janel McLean, and Mahesh Chandrasekharan for helpful advice and discussions.
Footnotes
AUTHOR CONTRIBUTIONS B.M.S. developed the protocol and F.B.C. made modifications to omit the formaldehyde crosslinking step. D.C. conceived and supervised the project. B.M.S. and D.C. wrote the manuscript.
COMPETING FINANCIAL INTERESTS The authors have no competing financial interests
References
- 1.Cimprich KA, Cortez D. ATR: an essential regulator of genome integrity. Nat Rev Mol Cell Biol. 2008;9:616–627. doi: 10.1038/nrm2450. [DOI] [PMC free article] [PubMed] [Google Scholar]
- 2.Hoeijmakers JH. Genome maintenance mechanisms for preventing cancer. Nature. 2001;411:366–374. doi: 10.1038/35077232. [DOI] [PubMed] [Google Scholar]
- 3.Berkovich E, Monnat RJ, Jr., Kastan MB. Assessment of protein dynamics and DNA repair following generation of DNA double-strand breaks at defined genomic sites. Nat Protoc. 2008;3:915–922. doi: 10.1038/nprot.2008.54. [DOI] [PubMed] [Google Scholar]
- 4.Bell SP, Dutta A. DNA replication in eukaryotic cells. Annu Rev Biochem. 2002;71:333–374. doi: 10.1146/annurev.biochem.71.110601.135425. [DOI] [PubMed] [Google Scholar]
- 5.Sirbu BM, Couch FB, Feigerle JT, Bhaskara S, Hiebert SW, Cortez D. Analysis of protein dynamics at active, stalled, and collapsed replication forks. Genes Dev. 2011;25:1320–1327. doi: 10.1101/gad.2053211. [DOI] [PMC free article] [PubMed] [Google Scholar]
- 6.Salic A, Mitchison TJ. A chemical method for fast and sensitive detection of DNA synthesis in vivo. Proc Natl Acad Sci U S A. 2008;105:2415–2420. doi: 10.1073/pnas.0712168105. [DOI] [PMC free article] [PubMed] [Google Scholar]
- 7.Moses JE, Moorhouse AD. The growing applications of click chemistry. Chem Soc Rev. 2007;36:1249–1262. doi: 10.1039/b613014n. [DOI] [PubMed] [Google Scholar]
- 8.Herrick J, Bensimon A. Global regulation of genome duplication in eukaryotes: an overview from the epifluorescence microscope. Chromosoma. 2008;117:243–260. doi: 10.1007/s00412-007-0145-1. [DOI] [PubMed] [Google Scholar]
- 9.Probst AV, Dunleavy E, Almouzni G. Epigenetic inheritance during the cell cycle. Nat Rev Mol Cell Biol. 2009;10:192–206. doi: 10.1038/nrm2640. [DOI] [PubMed] [Google Scholar]
- 10.Kliszczak A, Rainey M, Harhen B, Boisvert F, Santaocanale C. DNA mediated chromatin pull-down for the study of chromatin replication. Scientific Reports. 2011;1:1–7. doi: 10.1038/srep00095. [DOI] [PMC free article] [PubMed] [Google Scholar]
- 11.Jao CY, Salic A. Exploring RNA transcription and turnover in vivo by using click chemistry. Proceedings of the National Academy of Sciences of the United States of America. 2008;105:15779–15784. doi: 10.1073/pnas.0808480105. [DOI] [PMC free article] [PubMed] [Google Scholar]
- 12.Reyes-Lamothe R, Sherratt DJ, Leake MC. Stoichiometry and architecture of active DNA replication machinery in Escherichia coli. Science. 2010;328:498–501. doi: 10.1126/science.1185757. [DOI] [PMC free article] [PubMed] [Google Scholar]
- 13.Aladjem MI. Replication in context: dynamic regulation of DNA replication patterns in metazoans. Nat Rev Genet. 2007;8:588–600. doi: 10.1038/nrg2143. [DOI] [PubMed] [Google Scholar]
- 14.Raschle M, Knipscheer P, Enoiu M, Angelov T, Sun J, Griffith JD, Ellenberger TE, Scharer OD, Walter JC. Mechanism of replication-coupled DNA interstrand crosslink repair. Cell. 2008;134:969–980. doi: 10.1016/j.cell.2008.08.030. [DOI] [PMC free article] [PubMed] [Google Scholar]
- 15.Ben-Yehoyada M, Wang LC, Kozekov ID, Rizzo CJ, Gottesman ME, Gautier J. Checkpoint signaling from a single DNA interstrand crosslink. Molecular cell. 2009;35:704–715. doi: 10.1016/j.molcel.2009.08.014. [DOI] [PMC free article] [PubMed] [Google Scholar]
- 16.Petermann E, Orta ML, Issaeva N, Schultz N, Helleday T. Hydroxyurea-stalled replication forks become progressively inactivated and require two different RAD51-mediated pathways for restart and repair. Mol Cell. 2010;37:492–502. doi: 10.1016/j.molcel.2010.01.021. [DOI] [PMC free article] [PubMed] [Google Scholar]
- 17.Szychowski J, Mahdavi A, Hodas JJ, Bagert JD, Ngo JT, Landgraf P, Dieterich DC, Schuman EM, Tirrell DA. Cleavable biotin probes for labeling of biomolecules via azide-alkyne cycloaddition. J Am Chem Soc. 2010;132:18351–18360. doi: 10.1021/ja1083909. [DOI] [PMC free article] [PubMed] [Google Scholar]
- 18.Kim HY, Tallman KA, Liebler DC, Porter NA. An azido-biotin reagent for use in the isolation of protein adducts of lipid-derived electrophiles by streptavidin catch and photorelease. Mol Cell Proteomics. 2009;8:2080–2089. doi: 10.1074/mcp.M900121-MCP200. [DOI] [PMC free article] [PubMed] [Google Scholar]
- 19.Capson TL, Benkovic SJ, Nossal NG. Protein-DNA cross-linking demonstrates stepwise ATP-dependent assembly of T4 DNA polymerase and its accessory proteins on the primer-template. Cell. 1991;65:249–258. doi: 10.1016/0092-8674(91)90159-v. [DOI] [PubMed] [Google Scholar]
- 20.Gallagher SR. Ch. 10. In: Ausubel FM, et al., editors. Current Protocols in Molecular Biology. Vol. 2 1999. [Google Scholar]
- 21.Shevchenko A, Tomas H, Havlis J, Olsen JV, Mann M. In-gel digestion for mass spectrometric characterization of proteins and proteomes. Nat Protoc. 2006;1:2856–2860. doi: 10.1038/nprot.2006.468. [DOI] [PubMed] [Google Scholar]